Summary:
- Tech stocks have experienced a recent selloff, but after earnings, Applied Materials looks poised for upside.
- Applied Materials stock chart looks bullish, with potential to clear moving averages and reach new highs.
- Cisco stock chart also looks bullish, but may be nearing the end of its bull run, with weaker relative strength and guidance.
Tippapatt
Tech stocks have had a rough go of it for the past month or so, as the techy Nasdaq has seen a rather sharp selloff. The index was way overbought and sentiment was far too bullish back in July, but today, it appears to my eye that we’ve worked through both of those things.
There was a slew of tech earnings reports in the past few weeks, including big names like the subjects of this article, Applied Materials (NASDAQ:AMAT) and Cisco Systems (NASDAQ:CSCO). Below, we’ll compare and contrast the two bellwethers, and I’ll explain why at this moment, I prefer Applied Materials over Cisco. Let’s begin.
Applied Materials Vs. Cisco – Two different, but bullish charts
Before we look at each chart, I’ll start by saying both of these look bullish in their own way. In my estimation, there’s more upside potential, however, in Applied Materials, which we’ll start with.
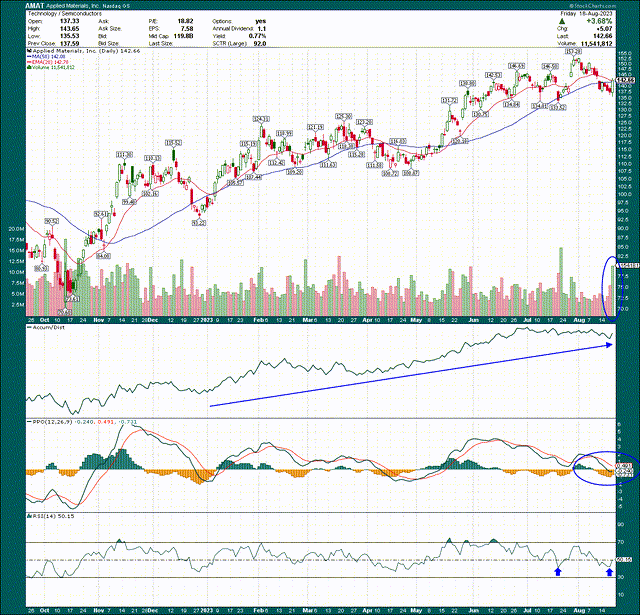
We can see the stock had a huge uptrend into the Q3 report, selling off slightly just ahead of the release late last week. However, the bull trend looks intact to me, and I think there’s more upside ahead.
The stock is looking to clear the 20-day exponential moving average in red, and the 50-day simple moving average in blue, in order to continue the uptrend. That’s the first hurdle, and after that, we have the prior high at ~$146, and then the ultimate high at $153. I think both will be taken out.
The accumulation/distribution line measures buying activity during the trading day, and Applied Materials has seen relentless strength this year in the A/D line. In addition, the 14-day RSI and PPO are both turning higher after resetting from overbought levels, which simply means momentum has sufficiently reset as to give the bulls enough dry powder to get another serious uptrend moving.
I like Applied Materials’ chart so long as it holds the low-$130s, which was the bottom of the consolidation channel from earlier this year. If that level fails, we could see some ugly selling but I don’t think we’ll see that.
Finally, relative strength for Applied Materials has been weak against its semiconductor peers, but the group has been outstanding this year.
The semis have put 42% between themselves and the S&P 500 this year, and while Applied Materials has lagged the group by 9%, it’s still destroying the broader market.
Now, let’s compare that with Cisco, which looks bullish as well, but for different reasons, after it’s Q4 earnings report.
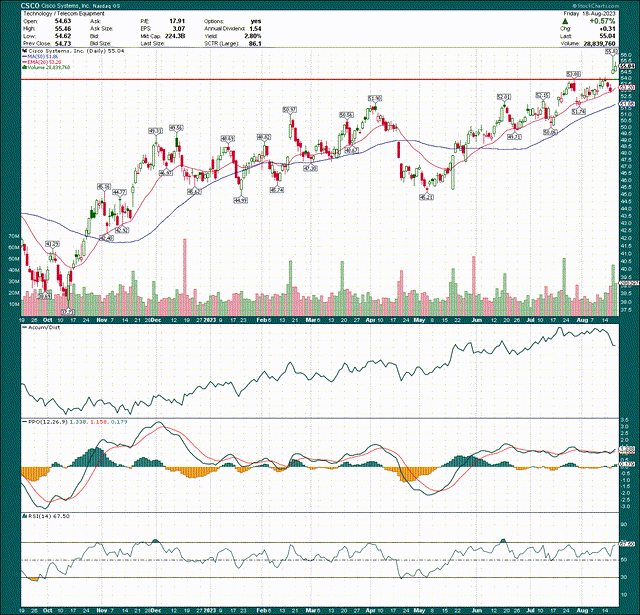
Cisco’s bullishness comes from the breakout that was achieved in mid-August from the $54 level. That’s the line in the sand for the bulls; long ahead of that, sell below it.
Now, the A/D line doesn’t look quite as good, and the PPO and 14-day RSI have both shown some fairly pronounced divergences. In other words, price keeps going higher but there’s no confirmation from momentum. That can often portend the start of a trend change, although it’s certainly no guarantee. However, when I look at these charts, I see Applied Materials as having reset after a big bull run, whereas Cisco looks to be at or near the end of its bull run. We shall see.
Relative strength is also nowhere near as compelling for Cisco.
It’s beaten its peers in telecom by about 5% this year, but the group is about flat to the broader market. Meh.
Now, let’s take a look at the fundamental case for each.
Growth or stability?
Anyone that has read my work knows I’m a growth-oriented trader, favoring those stocks that could outperform the S&P 500 through higher revenue and/or EPS revisions, and bullish looking charts. We have two good looking charts, with Applied Materials looking better in my view. But what do the fundamentals say?
Applied Materials posted a very strong Q3, and blowout guidance for the fourth quarter. Adjusted EPS came to $1.90, which was 15 cents better than expected. Revenue was roughly flat but beat estimates by $250 million at $6.43 billion. Adjusted operating margin fell 170bps to 28.3% of revenue from the year-ago period, but the revenue decline and fall in margins were both expected to be worse.
Critically, guidance for Q4 was great, as the company offered up $6.51 billion in sales, +/- $400 million, and adjusted EPS of $1.82 to $2.18. Those compare quite favorably to consensus of $5.88 billion and $1.60, respectively. That’s exactly the kind of thing I want from long candidates; great results and guidance well past expectations.
Cisco, on the other hand, also saw better than expected quarterly results, but guidance for the new fiscal year was quite uninspiring. For Q4, adjusted EPS beat estimates by eight cents at $1.14, and revenue was $150 million better than estimates at $15.2 billion. That was also up a very strong 16% year-over-year.
Software revenue rose 17%, software subscription revenue was up 20%. Annualized recurring revenue rose 5%, and product annualized recurring revenue was up 10%. Cisco also added 11% to its remaining performance obligations to $34.9 billion. That all sounds great, and Q4 was terrific. The problem is that guidance was weak, and unsupportive of more highs in the stock.
Guidance for the year came in under consensus for revenue, and about equal with consensus for EPS. Revenue is expected in the range of $57 billion to $58.2 billion; well shy of the $58.37 billion estimate. Adjusted EPS is expected in the range of $4.01 to $4.08; consensus was $4.04.
That’s where I draw the line with these two, which again, supports what I see in the charts. Cisco looks to me to be nearing the end of its bull move, and weak guidance supports that. Applied Materials, however, offers upside guidance and a chart with more upside potential. In short, Cisco offers stability while Applied Materials offers growth.
Let’s now turn our attention to revisions, because I see that as a critical component when finding great stocks to buy. We’ll start with Applied Materials.
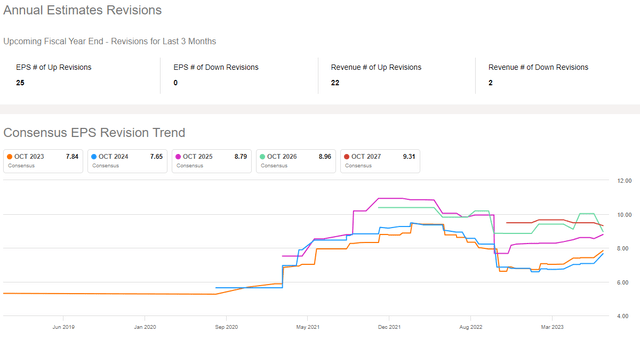
Fully 25 of the last 25 EPS revisions have been higher, and 22 of the 24 most recent revenue revisions have been up. You literally cannot do much better than that, and we can see there’s a lot of optimism brewing for Applied Materials after the froth of COVID-fueled optimism wore off. I love this chart.
Cisco, on the other hand, well, have a look.
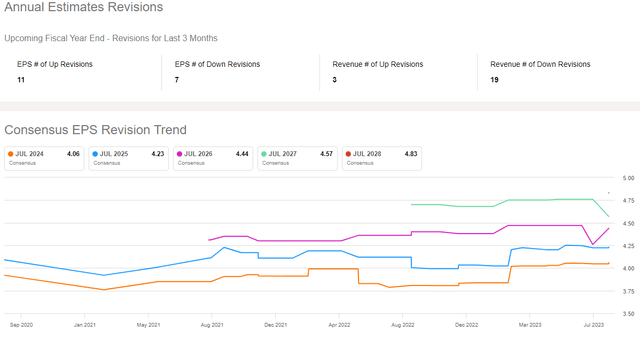
Revisions for EPS are mixed, but revenue revisions are decidedly negative. For the third time in this article, Cisco’s data supports a potential top in the stock, while Applied Materials supports more highs ahead. You may agree or disagree, but this is how I’m reading the evidence, and the evidence says Applied Materials is a much better buy.
AMAT Vs. CSCO – Growth rates and stock valuation
As we look to put the icing on this cake, let’s take a look at forward growth rates to see what clues they offer us for these stocks, beginning with Applied Materials.
Seeking Alpha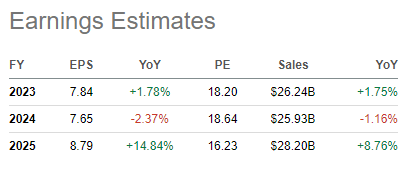
We’re looking at roughly flat EPS for this year and fiscal 2023, with a resumption of strong growth in 2025. Keep in mind the semis were massive beneficiaries of COVID-fueled demand, so earnings and revenue were brought forward for the industry in a huge way. That’s working its way through, and we’ll see more normalized results in the relatively near future. In other words, flat earnings this year and next are not indicative – in my view – of “normal” for Applied Materials.
Cisco’s growth profile, on the other hand, looks like a consumer staple or utility stock.
Seeking Alpha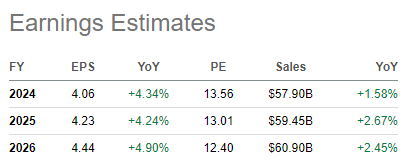
We see steady, low-single digit revenue and steady, mid-single digit EPS growth. Again, stability versus growth. I choose the latter, but there’s a place for Cisco in some investors’ portfolios; I just don’t get excited about 4% growth.
Let’s wrap up with the valuation chart, which shows some interesting characteristics. We’ve got three years of data here, giving us plenty of historical context to work with.
Applied Materials has ranged between 9.6X and 23.7X forward earnings during this period, a huge range that shows the stock moves to periods of overvaluation and undervaluation to the extreme. Cisco has ranged between 11.1X and 18.3X, again showing that relative stability against Applied Materials.
To me, Cisco looks slightly undervalued here at 13.6X forward earnings against its average of 14.1X during this period. Applied Materials, on the other hand, is at 19.3X against a 16.8X average. However, given what we’ve seen, I think both of those things make sense.
Cisco’s revenue and EPS growth are slowing, and revisions are coming down. That warrants a below-average valuation. Applied Materials offered massive upside in its guidance; that warrants an above-average valuation. To be clear, overvaluation or undervaluation are in the eye of the beholder, but I can justify why Cisco is undervalued today, and I can justify why Applied Materials isn’t.
The bottom line here is that we have a tale of two tech titans that – in my view – very clearly favors Applied Materials. The company offers a chart with more upside, much better guidance/revisions, and a stronger long-term growth profile. I can’t ask for much more than that, and for that reason, I’m putting a hold on Cisco and a buy on Applied Materials after the company’s respective earnings reports.
Analyst’s Disclosure: I/we have no stock, option or similar derivative position in any of the companies mentioned, and no plans to initiate any such positions within the next 72 hours. I wrote this article myself, and it expresses my own opinions. I am not receiving compensation for it (other than from Seeking Alpha). I have no business relationship with any company whose stock is mentioned in this article.
Seeking Alpha’s Disclosure: Past performance is no guarantee of future results. No recommendation or advice is being given as to whether any investment is suitable for a particular investor. Any views or opinions expressed above may not reflect those of Seeking Alpha as a whole. Seeking Alpha is not a licensed securities dealer, broker or US investment adviser or investment bank. Our analysts are third party authors that include both professional investors and individual investors who may not be licensed or certified by any institute or regulatory body.
If you liked this idea, sign up for a no-obligation free trial of my Seeking Alpha Marketplace service, Timely Trader! I sift through various asset classes to find the best places for your capital, helping you maximize your returns. Timely Trader seeks to find winners before they become winners, and keep you out of losers. In addition, you get access to our community via chat, direct access to me, real-time price alerts, a model portfolio, and more.

