Summary:
- Alphabet’s stock has been relatively flat over the past year, but has rebounded from its lows in January.
- The Bear-Case in an discounted cash flow analysis suggest that Alphabet is currently only slightly overvalued.
- The Base- and Bull however indicated that the company might be heavily undervalued right now.
Ole_CNX
Alphabet (NASDAQ:GOOG, NASDAQ:GOOGL) is almost flat over the last year, just being up ~8% year over year.
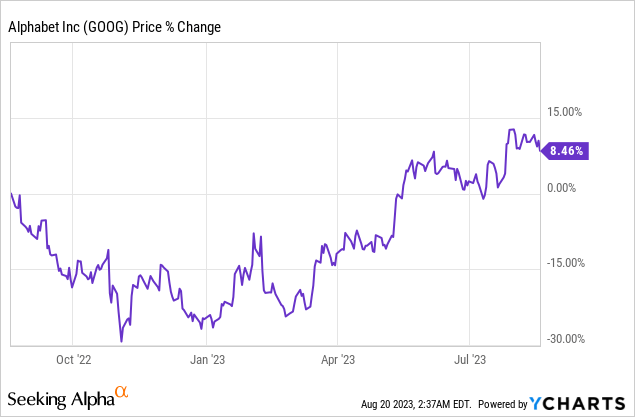
Over the last 14 months the company is even down almost 14%. Alphabet however has seen a significant rebound from its recent lows in January, where it was down almost 40% from the All-Time-High. This poses the question, is the company still a good buy at these prices, even after the recent rebound since January?
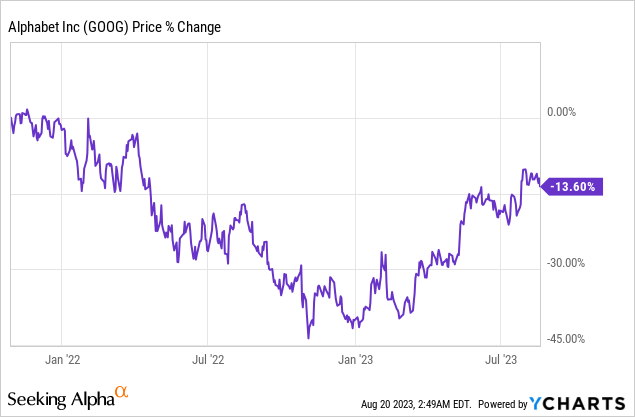
To answer this question, I conducted an in-depth Discounted Cash Flow Analysis (DCF), that factors in both the risks and possible growth catalysts of Alphabet.
The Business
Alphabet is one of the most significant digital corporations in the world, it began as a search engine initiative by Larry Page and Sergey Brin in 1996. From there the company has greatly expanded and diversified its portfolio over time. Its primary area of expertise is still internet services, but it has expanded to include a wide range of other businesses and sectors. For our analysis, I segmented the company in Services, Cloud and Other.
Services: The Search Engine is Google’s main offering and the one with which it is most well-known. However, the business provides a wide range of other services. Google owns YouTube, a well-known video-sharing website. Then there is Google Maps, which provides mapping services and is now used by millions of people for navigation. Their online shop, Google Play, serves as the official app store for their Android operating system. Additionally, Google also offers a set of office tools that directly compete with Microsoft’s (MSFT) Office program, including Google Docs, Sheets, and Slides.
Cloud: Google Cloud Platform (GCP) is the division of Alphabet’s cloud services that competes directly with Microsoft Azure and Amazon (AMZN) AWS. GCP provides computer power for hosting web applications. In addition to computers, data storage, data analytics, and machine learning, it offers a wide range of services. GCP has experienced substantial expansion over time and has attracted a lot of interest from both new and existing enterprises. Additionally, it offers collaboration capabilities through Google Workspace (formerly G Suite), which includes Gmail, Meet, Drive, and more, and caters to developers with technologies like Firebase.
Other: Alphabet also includes a number of “Other Bets.” These are companies that are unrelated to Google’s primary online offerings. Alphabet, for instance, has a self-driving technology project called Waymo. Another subsidiary, DeepMind, is dedicated to researching artificial intelligence and has made considerable strides in machine learning. Alphabet’s forays into the medical and biotechnology fields are Verily and Calico, respectively. Their version of drone delivery technology is called Wing, and Loon was a large-scale initiative to bring the internet to isolated locations using high-altitude balloons.
For simplicity purposes and for a good overview I included revenues from hedging and unallocated corporate costs into this segment, but more on that when we jump into the numbers.
The Scenarios
To consider positive and negative aspects, we’ll separate the DCF in three different scenarios: The Bear-Case, Base-Case and Bull-Case.
1. Segment: Services
The services segment is mainly composed of Google Advertising revenue. In their latest quarterly earnings, the company declared a Google Advertising revenue of $58,143 million – this includes Google Search, YouTube and Google Network. $8,142 million came from other sources, which means that around 88% of the service revenue is indeed labeled as advertising by Alphabet. To keep things simple, I assume that GOOG’s whole service segment behaves like digital advertising.
According to statista, Google is currently holding ~28% of the global market-share in global digital ad revenue.
Net digital advertising revenue share of major ad-selling online companies worldwide from 2016 to 2023 (statista.com)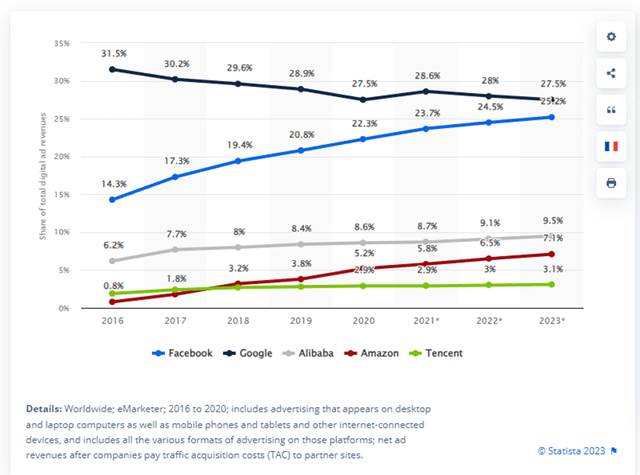
As can be seen above, the general share of Alphabet has been declining over the last few years, which makes it in turn very difficult for the company to grow above the general digital advertising market.
Experts predict that the digital ad spend will grow like the following each year:
- 2024: 10.9%
- 2025: 10.0%
- 2026: 9.20%
- 2027: 8.60%
As there is also a general declining trend, we can extrapolate the linear trend and get the following expected growth rates until 2030:
- 2028: 7.75%
- 2029: 7.00%
- 2030: 6.20%
From these assumptions, I generated revenue CAGRs for the three scenarios. For the Bear-Case I anticipated that Alphabet only manages to grow its business at half the market rate, while in the Base-Case the company grows at exactly the predicted rate and is therefore able to hold its market share consistent. As the general trend shown above is indicating that Alphabet is losing market share over the last few years, I think a high growth rate above the market rate is highly unlikely, which is why I only expect the growth rate to be 20% above the market rate in the Bull scenario. My numbers are summarized here:
| CAGR | 2024 | 2025 | 2026 | 2027 | 2028 | 2029 | 2030 |
| Bear -50% | 5.45% | 5.00% | 4.60% | 4.30% | 3.88% | 3.50% | 3.10% |
| Base / Market | 10.9% | 10.0% | 9.20% | 8.60% | 7.75% | 7.00% | 6.20% |
| Bull +20% | 13.1% | 12.0% | 11.0% | 10.3% | 9.30% | 8.38% | 7.45% |
For 2023 I anticipate a growth rate of 9.5%, for all three scenarios to get a similar starting point.
Let’s take a look at the margins now. Over the last five years, the company has achieved margins in the service segment ranging from 32% to 39%. There isn’t a general trend – decline or increase – visible in my opinion.
| 2018 | 2019 | 2020 | 2021 | 2022 | |
| EBIT Margin | 33% | 32% | 32% | 39% | 34% |
The average of these 5 years – 34% – seems like a good starting point for the year 2023 in our DCF. From there on, I anticipated the following development, based on the different scenarios:
| EBIT Margin | 2024 | 2025 | 2026 | 2027 | 2028 | 2029 | 2030 |
| Bear -0.5% p.a. | 33.5% | 33% | 32.5% | 32% | 31,5% | 31% | 30.5% |
| Base consistent | 34% | 34% | 34% | 34% | 34% | 34% | 34% |
| Bull +0.5% p.a. | 34.5% | 35% | 35.5% | 36% | 36.5% | 37% | 37.5% |
2. Segment: Cloud
As of now the Services segment of Alphabet is way larger than its Cloud business, currently around 89% of Alphabet’s revenue is generated in said service segment. However as stated above the anticipated growth in this segment is rather mediocre. This isn’t the case in the cloud computing space.
For Q2 2023 statista anticipates that Alphabet’s market share in worldwide cloud infrastructure is currently at 11% following Microsoft’s Azure with 22% and Amazon’s AWS at 32%.
Market share in the worldwide cloud infrastructure market (statista.com)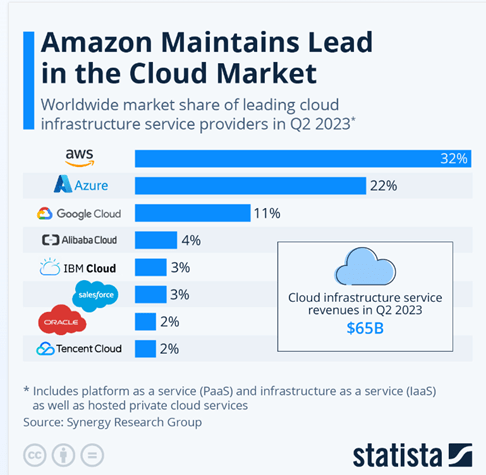
The general trend in this market seems that market contestants other than Google, Microsoft and Amazon are losing market share. The portion lost seems to be divided between Microsoft and Alphabet, with Microsoft increasing its share substantially and Alphabet growing its share slowly over the last years.
Cloud infrastructure services vendor market share worldwide from 4th quarter 2017 to 4th quarter 2022 (statista.com)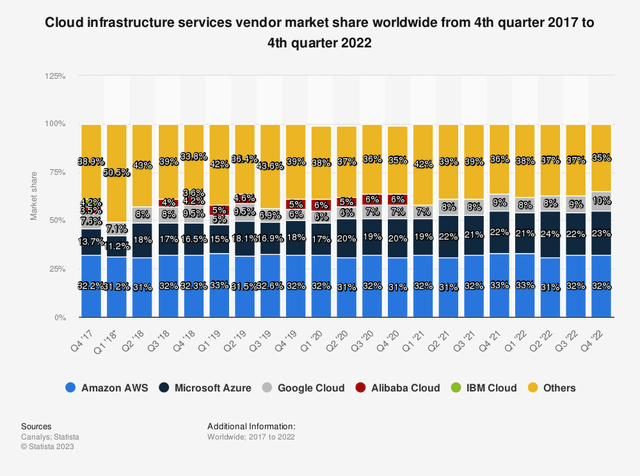
Alphabet has grown its revenue in the cloud segment significantly over the last 5 years:
| 2018 | 2019 | 2020 | 2021 | 2022 | |
| Revenue Cloud [$ million] | 5,838 | 8,918 | 13,059 | 19,206 | 26,280 |
| CAGR | 44% | 53% | 46% | 47% | 37% |
From 2023 to 2030, the global cloud computing market is expect to grow at a compound annual growth rate of 20%. This seems well achievable if we take a look at the historical growth rates of Amazon and Google. Microsoft unfortunately doesn’t separately break down its Azure revenue in the earnings, as they are mentioned together with server and enterprise services in the “intelligent cloud” segment.
| 2018 | 2019 | 2020 | 2021 | 2022 | |
| 44% | 53% | 46% | 47% | 37% | |
| Amazon | 47% | 37% | 30% | 37% | 29% |
Similarly to the Services business of Alphabet, we’ll now anticipate different growth metrics for the three scenarios. As the general market is expected to grow with a CAGR of 20% this is our base case, with Alphabet holding its market share.
Due to the fact that they managed to increase their market share generally – as can be seen above – I think a reduction of 25% to 15% growth p.a. seems reasonable for the Bear-Case.
Same could be said the other way around: If Alphabet continues to expand their market share, a growth rate above market should be achievable, which is why I’ll assume a growth rate of 25% in the Bull-Case for the time horizon of 2023 to 2030.
The EBIT margin of Google’s cloud have developed as follows:
| 2018 | 2019 | 2020 | 2021 | 2022 | |
| EBIT Margin | -74% | -52% | -43% | -16% | -11% |
The trend is clearly going in the right direction and Alphabet is doing its best to improve their costs in this segment. They are doing pretty well in 2023 already, as in the latest quarter they already managed to achieve an EBIT margin in this segment of ~+5% and are thus profitable the second quarter in a row.
Taking into account the margins of AWS and Azure however there is still a lot of room to grow, as AWS for example had EBIT margins between 35% and 24% in the last few quarters. As mentioned above MSFT isn’t opening its book of their pure cloud performance, but last quarter their “intelligent cloud” business had an EBIT margin of 43%.
For the different scenarios, I expect the margins to develop as follows:
| EBIT Margin | 2024 | 2025 | 2026 | 2027 | 2028 | 2029 | 2030 |
| Bear+1.5% p.a. 15% max. | 6.5% | 8.0% | 9.5% | 11% | 12.5% | 14% | 15% |
| Base +3% p.a. 20% max. | 8.0% | 11% | 14% | 17% | 20% | 23% | 25% |
| Bull+4.5% p.a. 35% max. | 9.5% | 14% | 19.5% | 24% | 29.5% |
34% |
35% |
For 2023 I anticipated the EBIT margin to stay at Q2 of 2023’s level of 5% for all three scenarios.
3. Segment: Other
The “Other” segment of Alphabet contains other bets – for example Waymo, DeepMind or Wing – and gains from hedging on the revenue side.
On the EBIT side there are the losses these other bets have generated and other unallocated corporate costs. Over the last three years these metrics were the following:
| Financial year | 2020 | 2021 | 2022 |
| Revenue [million] $ | 833 | 902 | 3,028 |
| Revenue Growth Rate | -25% | 8% | 236% |
| EBIT “Margin” | -933% | -1113% | -289% |
| EBIT [million] | -7,775 | -10,042 | -8,762 |
| EBIT Growth Rate | 23% | -29% | -13% |
The revenue in this segment is highly volatile as the bets are often high risks investments that Alphabet isn’t currently expecting to turn a profit or to generate revenue. Around 2/3 of 2022 revenue was from hedging and not from “normal” business activities.
For our DCF I want to keep pretty simple in this segment. The revenue here won’t be the main turning point for the next 8 years. However the burn rate that Alphabet is producing in this segment is highly worrying and needs to be addressed in our analysis. That’s why I predicted these EBITs for the Other segment, with a starting point of $-10,000 million for 2023.
| EBIT Other [$ million] | 2024 | 2025 | 2026 | 2027 | 2028 | 2029 | 2030 |
| Bear-1,000 EBIT p.a. | -11,000 | -12,000 | -13,000 | -14,000 | -15,000 | -16,000 | -17,000 |
| Base consistent | -10,000 | -10,000 | -10,000 | -10,000 | -10,000 | -10,000 | -10,000 |
| Bull+500 EBIT p.a. | -9,500 | -9,000 | -8,500 | -8,000 | -7,500 |
-7,000 |
-6,500 |
To set things a bit more into perspective here, the last time Alphabet had a negative EBIT of $11,000 million in this segment was when they had to pay a $5.1 billion fine. Therefore the Bear and Base Case seem reasonably conservative.
The Valuation – Discounted Cash Flow Analysis
With most of the metrics needed defined, we can jump now into the Discounted Cash Flow Analyses itself. We however need some more assumptions, to properly calculate GOOG’s fair value.
- Revenue & EBIT Margin These assumptions come from the paragraph “The Scenarios”
- Financial Result And Taxes: Here I averaged out the last three years and used 91% to calculate the net profit for all three cases.
- Tax Rate: To predict the tax rate, I also averaged out the last three years and assumed it’ll stay flat at 16% till 2030.
- Free Cash Flow: I calculated the EBIAT using the aforementioned tax rate and then attempted to estimate an appropriate EBIAT to FCF ratio. I here again averaged out the last three years and used 7% to calculate Alphabet’s future Cash Flow.
- WACC: Here I used 8.5%, which is the current WACC of GOOG.
- Perpetuity Growth Rate: The perpetuity growth rate assumed for the analysis is 3%. This seems reasonable as GOOG’s Free Cash Flow CAGR in 2030 in the Bear-Case is at 3.3%
The cells highlighted blue in the DCF screenshots are the main assumptions I took.
Bear-Case Scenario
Google Discounted Cash Flow Analysis Bear-Case (I) (seekingalpha.com; abc.xyz; own predictions) Google Discounted Cash Flow Analysis Bear-Case (II) (seekingalpha.com; abc.xyz; own predictions)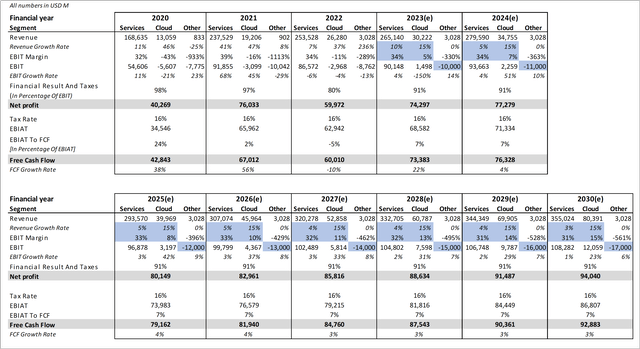
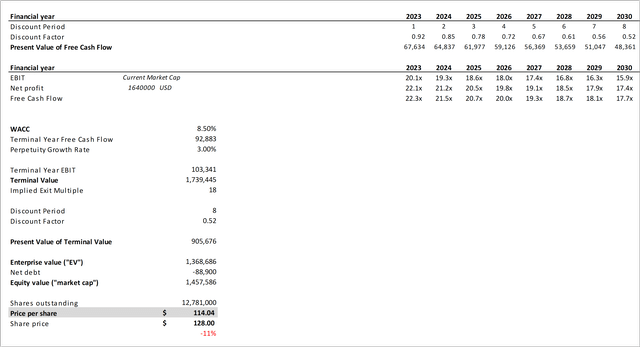
Within our Bear-Case scenario and consequently with predicting low growth rates in both the Advertising and the Cloud Segment as well as declining margins in the ad business and slowly increasing ones in the cloud business, we get a price target of ~$114 indicating that the company could be overvalued by “only” 11% right now.
Base-Case Scenario
Google Discounted Cash Flow Analysis Base-Case (I) (seekingalpha.com; abc.xyz; own predictions) Google Discounted Cash Flow Analysis Base-Case (II) (seekingalpha.com; abc.xyz; own predictions)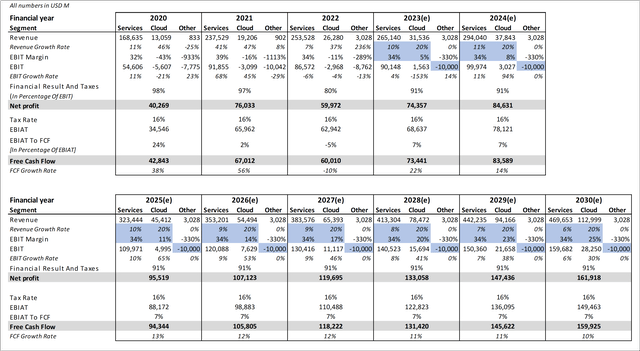
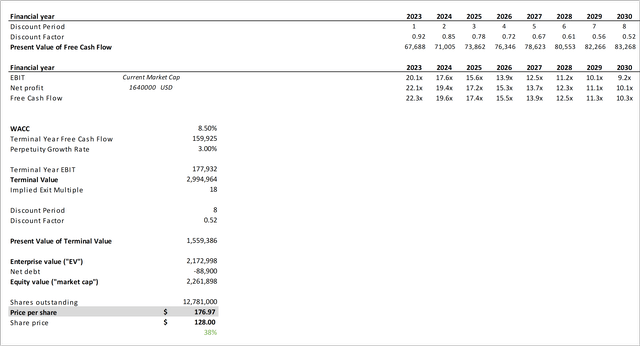
In the Base-Case we get a price target of ~$177, indicating that the company could be undervalued by 38% right now. This prediction includes that the company grows at the anticipated market CAGRs for digital advertising and cloud as well as keeping margins at a consistent level for the next 8 years.
Bull-Case Scenario
Google Discounted Cash Flow Analysis Bull-Case (I) (seekingalpha.com; abc.xyz; own predictions) Google Discounted Cash Flow Analysis Bull-Case (II) (seekingalpha.com; abc.xyz; own predictions)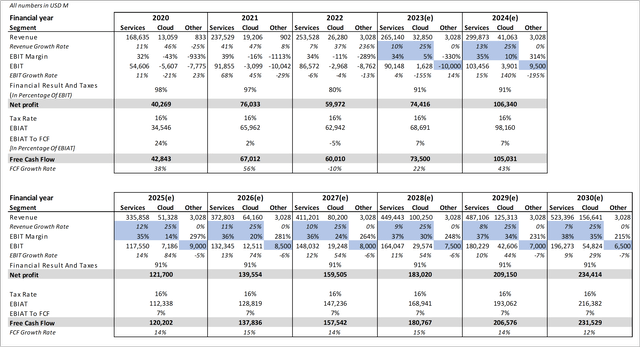
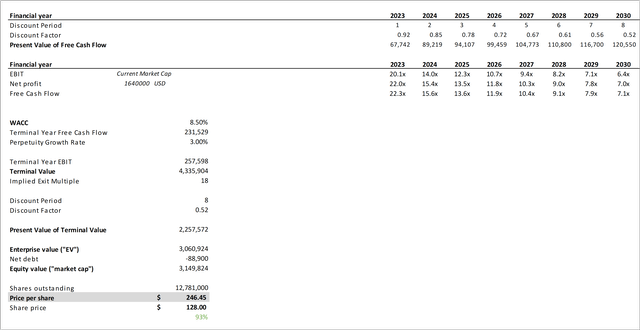
Considering the aggressive but still realistic assumptions, we took in our Bull-Case scenario we get a price target of ~$246, indicating that Alphabet could currently be undervalued by 90+%. This however requires that the company grows above the segments it operates in and simultaneously increases its margins in both major segments.
Conclusion
Based on our three scenarios we get these price targets:
Bear: $114 – Overvalued by 11%
Base: $177 – Undervalued by 38%
Bull: $246 – Undervalued by 93%
Of course the truth will probably be somewhere in between these three scenarios or we could even get a result that isn’t in the laid out range. Let’s say for example that one of Google’s other bets becomes ready for series production and starts to generate meaningful revenue and profits or on the other hand a big lawsuit by the Antitrust Commission could negatively impact Alphabet’s business, revenue or profits.
These predictions and analyses should always be taken with a grain of salt, as 8 years is a long time horizon and nobody can precisely predict a company’s future business down to the percentage. However I believe that this DCF and this article give a solid understanding of Alphabet’s possible undervaluation and its growth trajectory.
With all that in mind, the possible upside currently heavily outweighs the potential downside in my opinion, which is why I rate the company as a ‘Strong Buy’.
Analyst’s Disclosure: I/we have a beneficial long position in the shares of GOOG either through stock ownership, options, or other derivatives. I wrote this article myself, and it expresses my own opinions. I am not receiving compensation for it (other than from Seeking Alpha). I have no business relationship with any company whose stock is mentioned in this article.
Seeking Alpha’s Disclosure: Past performance is no guarantee of future results. No recommendation or advice is being given as to whether any investment is suitable for a particular investor. Any views or opinions expressed above may not reflect those of Seeking Alpha as a whole. Seeking Alpha is not a licensed securities dealer, broker or US investment adviser or investment bank. Our analysts are third party authors that include both professional investors and individual investors who may not be licensed or certified by any institute or regulatory body.
