Summary:
- Comcast reported impressive growth in net income driven by its theme parks and major film studios.
- The stock maintains a robust upward trend with potential for further growth, presenting investment opportunities.
- However, there are risks associated with relying too heavily on theme parks and studios, as well as market volatility.
Justin Sullivan
Comcast Corporation (NASDAQ:CMCSA) recently reported impressive growth in net income for its latest quarterly results. This growth seemed to be an upward trend from the previous year and garnered positive reactions, causing an uptick in the stock price. However, when delving deeper into the details, the primary sources of this remarkable growth were its theme parks and a major film studio. Successful movie releases played a pivotal role in driving the studio’s revenue. This article delves into a technical analysis of Comcast’s stock price to predict its future. Notably, the stock maintains a robust upward trend with the potential for further growth. Dips or corrections within this positive trajectory are prime investment opportunities for long-term investors.
Financial Performance
In Q2 2023, Comcast reported a remarkable upward trajectory in its financial metrics. The Adjusted EBITDA saw a 4.2% growth, reaching the commendable mark of $10.2 billion. Similarly, the Adjusted EPS climbed by 11.9% to reach a value of $1.13. The quarter also witnessed the company amassing a free cash flow of $3.4 billion. For the investor community, there was promising news from Comcast. The company gave back a whopping $3.2 billion, made up of $1.2 billion in dividends and $2.0 billion in stock buybacks.
Taking a closer look at the Connectivity & Platforms department, there was a noticeable 4.4% growth in Adjusted EBITDA, culminating at $8.3 billion. This increase was accompanied by a boost in the Adjusted EBITDA Margin by 170 basis points, solidifying 41.0%. A highlight from this sector was the rise in domestic broadband, where there was a 4.5% uptick in the average customer rate, leading to a 4.4% growth in its revenue.
Shifting focus to the Content & Experiences domain, a significant upward trend was evident. The division’s Adjusted EBITDA grew by 7.5% to hit $2.2 billion. A remarkable accomplishment was observed in the Studios and Theme Parks. Specifically, in Studios, the Adjusted EBITDA moved from a prior deficit to a notable $255 million this quarter. Much of this rise can be attributed to the immense success of “The Super Mario Bros. Movie,” which garnered an impressive $1.3 billion worldwide, marking its position as the second highest-grossing animated movie.
Similarly, the Theme Parks segment witnessed commendable results. The Adjusted EBITDA for this area jumped by 32%, setting an all-time high at $833 million. This remarkable performance was attributed to the upward trends seen at Universal locations in Beijing, Japan, and Hollywood compared to last year’s data. Additionally, the Peacock streaming platform shared promising statistics. The platform’s paid subscriber count saw a nearly twofold increase year-over-year, accumulating a user base of 24 million. Reflecting this subscriber growth, Peacock’s revenue skyrocketed by 85%, reaching $820 million. Additionally, the following chart underscores a marked transition in net income and revenue, signaling sustained profitability prospects for Comcast going forward.
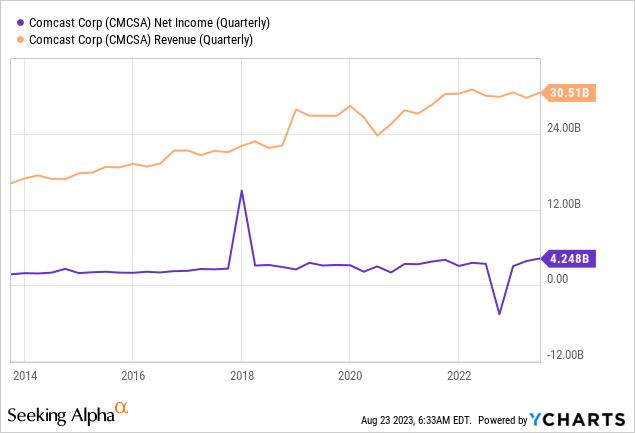
The financial data from Q2 2023 highlights Comcast’s robust presence in its diverse segments. The notable outcomes, particularly from the entertainment and theme park divisions, illustrate the company’s strategic direction and proficiency in an ever-evolving market environment.
Decoding Comcast’s Bullish Momentum
The quarterly chart below depicts a decidedly bullish long-term trajectory for Comcast. Analysis reveals that the pronounced market correction, initiated in 2021, has been completed, with projections now trending upward. Comcast’s stock has historically displayed robust price momentum over the past three decades. Notably, between 2000 and 2011, the market carved out a bullish flag, recognized as a potent market pattern. When this pattern was breached, Comcast’s stock surged dramatically, reaching record peaks at $58.61. A significant uptick in Comcast’s stock price post-2009 is attributed to various catalysts. Following the 2008 financial meltdown, numerous corporations rebounded with the U.S. economic revival in 2009. Beyond the overarching market rally, specific developments propelled Comcast ahead. In 2011, its successful acquisition of NBCUniversal diversified its portfolio, encompassing a significant network, multiple cable channels, and a prestigious film studio. This move not only augmented Comcast’s content reservoir but also magnified its ad revenue potential. Additionally, persistent investments in core cable and internet segments, infrastructure upgrades, and the rise of streaming platforms all bolstered Comcast’s stance in a dynamic media ecosystem. Its post-2009 stock ascent can also be credited to consistent fiscal performances, investor-centric initiatives, and strategies addressing subscriber attrition in traditional cable avenues.
Comcast Quarterly Chart (stockcharts.com)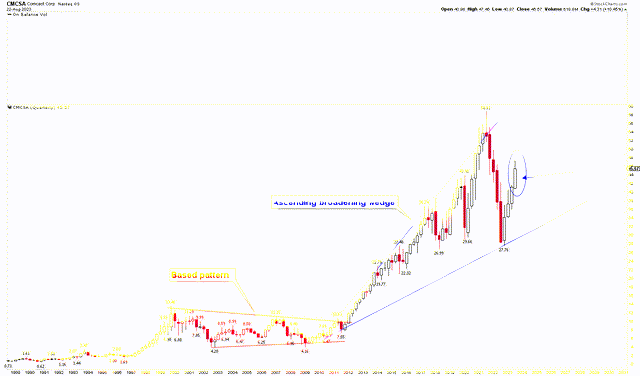
This marked surge post-2009 ushered in an ascending broadening wedge, signaling heightened market volatility. Such volatility precipitated a steep descent in Comcast’s stock price, gravitating toward the support threshold of the ascending broadening wedge. The swift rebound from the $27.76 support suggests the market’s resilience and potential for further ascension. Given that the third quarterly candle for 2023 is set to close in September, it’s plausible that this could conclude at even loftier heights. However, the prevailing market turbulence could induce fluctuations.
The monthly chart below accentuates the ascending broadening wedge from 2014 to 2023 for a more granular view of Comcast’s long-term price trajectory. Interestingly, the recent plummet to $27.76 aligns with this wedge’s support again. The RSI’s position above the 50 mid-level signals strength. Employing Fibonacci retracement analysis reveals pivotal support zones, from a 2009 low of $4.16 to record highs. The sharp 2022 dip found a cushion at the 50% Fibonacci retracement threshold. The current price transcending the 38.6% retracement mark hints at the bullish momentum and potential upside.
Comcast Monthly Chart (stockcharts.com)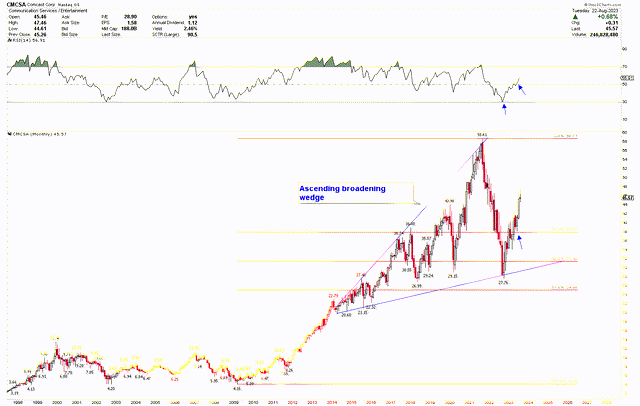
Key Action for Investors
From the analysis, the stock price has evident strong momentum, hinting at potential upward trends. Given the anticipated upward trajectory, buying Comcast at its current price might yield substantial profits for those seeking investment opportunities. Delving into shorter-term patterns, the weekly chart below delineates an inverted head and shoulder formation, with the head positioned at $27.76 and the shoulders at $36.16 and $34.13, respectively. Notably, this inverted head emerged when the RSI hit an oversold status. Such scenarios typically indicate robust market dynamics with a likely upward movement. The market is undergoing a correction from the neckline of this pattern. This correction phase can be perceived as an attractive buying window for investors. Should the stock price retreat toward $42, it could signal a compelling buy opportunity for Comcast. Investors may consider buying Comcast at its present value and expanding their holdings if the stock price declines toward $42.
Comcast Weekly Chart (stockcharts.com )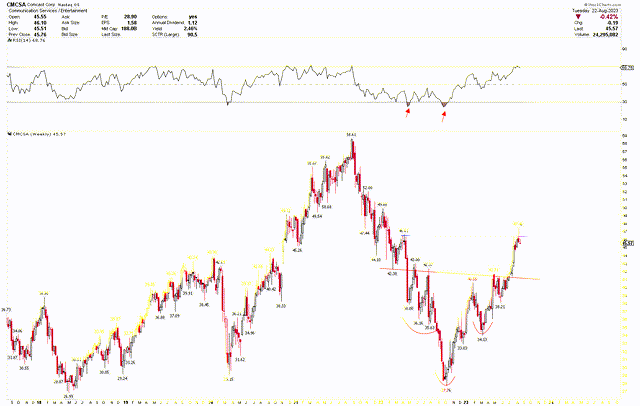
Market Risk
The recent impressive performance was predominantly driven by Comcast’s theme parks and major film studios. Depending too heavily on these sectors poses a risk, especially if they don’t maintain high growth rates in the future. While there’s been a surge in performance from theme parks and the studio sector, these results might be one-off occurrences and may not be indicative of sustained growth in the long run.
The Connectivity & Platforms department saw significant growth, especially in domestic broadband. However, as more territories approach saturation, finding new growth avenues might become challenging. The Peacock streaming platform exhibited strong growth, but the streaming market is notably competitive. Giants like Netflix, Amazon Prime, and Disney+, among others, dominate the landscape. Any strategic changes or content wins by these competitors could impact Peacock’s future growth.
Moreover, the emergence of an ascending broadening wedge in the stock’s technical analysis indicates high market volatility. Such volatility can lead to unpredictable stock price movements, presenting potential risks to investors.
Bottom Line
Comcast recently showcased an impressive surge in its quarterly net income, predominantly driven by its theme parks and Universal Studios. Successful films like “The Super Mario Bros. Movie” played instrumental roles in boosting the studio’s revenues. From a technical standpoint, there’s a robust bullish momentum evident in the stock price, which is accelerating upwards from the substantial long-term support provided by the ascending broadening wedge. The appearance of an inverted head and shoulder pattern at this long-term support bolsters the bullish outlook for Comcast. Investors might consider entering at current market levels to capitalize on this upward trend and consider increasing their positions if there’s a dip in the stock price toward $42.
Analyst’s Disclosure: I/we have no stock, option or similar derivative position in any of the companies mentioned, and no plans to initiate any such positions within the next 72 hours. I wrote this article myself, and it expresses my own opinions. I am not receiving compensation for it (other than from Seeking Alpha). I have no business relationship with any company whose stock is mentioned in this article.
Seeking Alpha’s Disclosure: Past performance is no guarantee of future results. No recommendation or advice is being given as to whether any investment is suitable for a particular investor. Any views or opinions expressed above may not reflect those of Seeking Alpha as a whole. Seeking Alpha is not a licensed securities dealer, broker or US investment adviser or investment bank. Our analysts are third party authors that include both professional investors and individual investors who may not be licensed or certified by any institute or regulatory body.
