Summary:
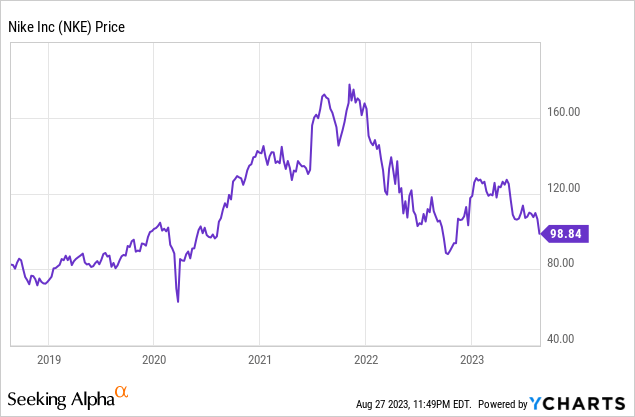
- Nike’s valuation has dropped 24.1% from its 52-week highs, making its valuation look much more reasonable at 30.8x TTM P/E.
- The company’s latest results show slowing growth, with decreased gross margins and lower net income and EPS compared to the previous year.
- Historical growth is very strong at 9.7% revenue and 9.4% EPS growth per share since 2011 helping to justify the valuation.

hapabapa
Nike (NYSE:NKE) is now moving back onto my radar for a potential investment trading at 30.8x TTM P/E and down 24.1% from 52-week highs. Since I last wrote about Nike back in December 2020 rating it a sell due to over valuation, the company has seen a total return of negative 26.1% compared to the S&P 500’s total return of 20.0%. That underperformance starts to bring its valuation back into reality.
Nike’s current valuation translates into a 3.2% earnings yield and, as this article will discuss, the company currently trades at a very similar 2.9% free cash flow yield based on a historical analysis. While these yields are not much on their own to get excited about, adding Nike’s nearly 10% annual EPS and revenue growth rate since 2011 start to add up to some decent returns, albeit risky if the historic growth does not continue to play out.
Latest Results Show Slowing Growth
Nike’s latest fiscal year (FY) and Q4 2023 results released in June for the year ended May 31, 2023, showed continued revenue growth across all brands and geographies but also pressure on the cost side and slower growth in Q4. FY revenues were $51.2 billion, up 10% compared to prior year and up 16% on a currency-neutral basis with Q4 revenues of $12.8 billion up 5% compared to the prior year and up 8% on a currency-neutral basis.
Gross margins at Nike decreased 140 basis points to 43.6% to bring the level to some of the lowest since 2011 and as far as my data goes back (lowest was 43.4% in FY 2012, primarily due to higher product input costs and elevated freight and logistics costs, higher markdowns and continued unfavorable changes in net foreign currency exchange rates. Selling and administrative expense increased 8% to $4.4 billion primarily due to operating overhead expenses increasing 10% to $3.3 billion driven by wage related expenses and NIKE Direct variable costs.
Going down to the bottom line, net income was $5.1 billion for the full year, down 16%, and diluted EPS was $3.23, down 14% compared to the prior year. For Q4, net income was $1.0 billion, down 28%, and diluted EPS was $0.66, down 27% compared to prior year. During the year, Nike paid dividends of $524 million, up 9% from prior year and completed share repurchases of $1.4 billion, reflecting 11.5 million shares retired as part of the four-year, $18 billion program approved by the board in June 2022.
A Highly Profitable and Growing Company
Nike’s global brand power has allowed the company to grow rapidly while maintaining a high level of profitability. Since 2011, the company has achieved average return on equity (ROE) and return on invested capital (ROIC) of 30.2% and 21.4% respectively. This level of profitability is well above my rule of thumb of 15% ROE and 9% ROIC, allowing me to be confident that, in my opinion, the company is able to maintain and continue to increase its intrinsic value in the future.
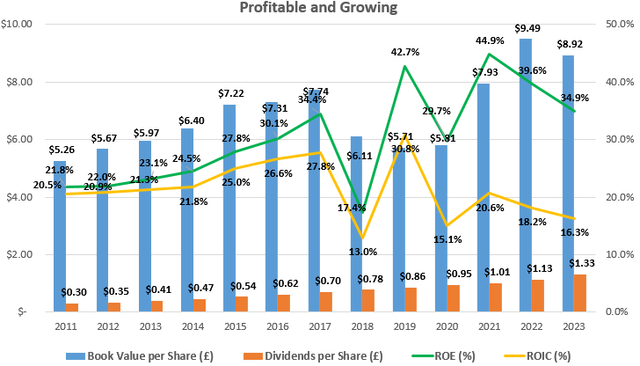
Nike Profitability and Growth Highlights (compiled by author from company financials)
Nike has a powerful global brand that is able to command steep premiums from consumers. This can be witnessed by the company’s gross margin averaging a high 44.6% since 2011 with a standard deviation of only 1.0%. As mentioned earlier, the current year’s gross margin is about the furthest away from this average gross margins that I have seen since 2011 when gross margins were 43.4%. This stability shows Nike’s ability to pass on rising costs of goods sold to the end-customer. This kind of stability signals a strong brand (which is extra important in times of inflation) and great economics as we will explore later in a cash flow analysis.
Strong Brand & Huge Excess Cash Flows
Strong businesses with wide moats such as Nike are able to generate cash beyond what is needed to fund operations. With capital expenditures taking up on average 24% of cash flow from operations over the past decade, this leaves approximately 76% to be returned to investors in the form of dividends and share repurchases. With average cash flow from operations of $5.9 billion over the past three years, this 76% would imply free cash flow to shareholders of $4.4 billion for around a 2.9% free cash flow yield at the current $152.4 billion market capitalization. While this might not seem like a high yield by itself, adding Nike’s high growth rate of 9.7% to be discussed next quickly brings this yield above my target 9% rate.
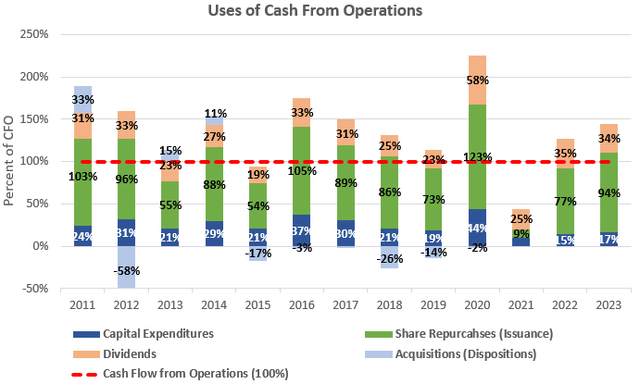
Cash Flow Analysis of Nike (compiled by author from company financials)
A Great Growth Story at a Fair Price
Nike is a great growth story and global brand. Since 2011, the company has grown revenues per share at an impressive average rate of 9.7% and EPS has grown at an average rate of 9.4% as can be seen in the graph below. Notably, dividend growth has been even higher at an average rate of 13.2% due to the company increasing the payout ratio to 41% of earnings for the 2023 fiscal year from 27% back in 2011. This dividend payout ratio shows room for potential continued growth above EPS or revenue.
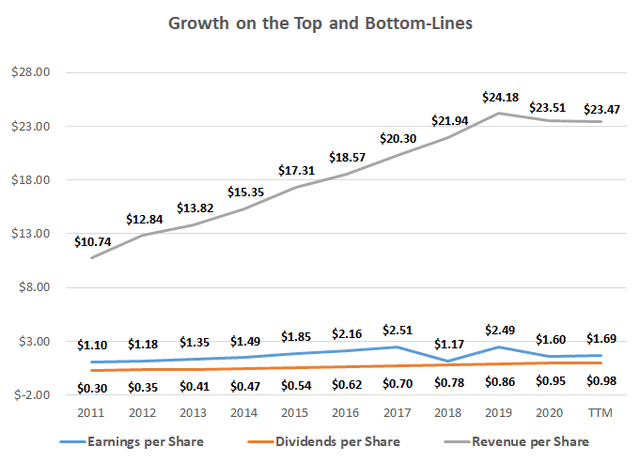
Nike’s per Share Historical Growth (compiled by author from company financials)
With these impressive growth rates, Nike is left trading at a high 30.8x TTM P/E but this start to look more reasonable in a P/E to growth ratio (PEG) of 3.2x and 3.3x based on the 9.7% revenue and 9.4% EPS growth per share since 2011. This compares very favorably to the last article I wrote on Nike back in December 2020 when the PEG ratios were 6.8x and 8.8x based on revenue and EPS growth, respectively. The current PEG ratios are still above legendary investor Peter Lynch’s rule of thumb of a non-expensive business being under 2x, but are getting much more reasonable. A PEG ratio over 2x suggests that earnings growth is already more than built into the price and a PEG ratio of 1x suggests the company is fairly valued.
Takeaway for Investors
Nike is a great company with an amazing global brand. While revenue growth is slowing based on the latest Q4 results, so is the global economy, and Nike’s valuation is starting to look appealing. The 30.8x TTM P/E represents only a 3.2% earnings yield and the company currently trades at a very similar 2.9% FCF yield based on a historical analysis. While these yields are not much on their own to get excited about, adding Nike’s nearly 10% annual EPS and revenue growth rate since 2011 start to add up to some decent returns. Nike is back on my radar for an investment if any further pullback occurs to bring the PEG ratio closer to 2x.
Analyst’s Disclosure: I/we have no stock, option or similar derivative position in any of the companies mentioned, and no plans to initiate any such positions within the next 72 hours. I wrote this article myself, and it expresses my own opinions. I am not receiving compensation for it (other than from Seeking Alpha). I have no business relationship with any company whose stock is mentioned in this article.
Disclaimer: While the information and data presented in my articles are obtained from company documents and/or sources believed to be reliable, they have not been independently verified. The material is intended only as general information for your convenience, and should not in any way be construed as investment advice. I advise readers to conduct their own independent research to build their own independent opinions and/or consult a qualified investment advisor before making any investment decisions. I explicitly disclaim any liability that may arise from investment decisions you make based on my articles.
Seeking Alpha’s Disclosure: Past performance is no guarantee of future results. No recommendation or advice is being given as to whether any investment is suitable for a particular investor. Any views or opinions expressed above may not reflect those of Seeking Alpha as a whole. Seeking Alpha is not a licensed securities dealer, broker or US investment adviser or investment bank. Our analysts are third party authors that include both professional investors and individual investors who may not be licensed or certified by any institute or regulatory body.
