Summary:
- According to the two DCF models I have created, Nvidia Corporation’s fair stock price is approximately $451.90. This suggests that it is very close to its current price of $455.72.
- Nvidia could easily surpass the $1,000 share price mark between 2030 and 2032.
- Nvidia made an early entrance into the AI chips market, securing a significant number of “loyal customers.” This strategic move is expected to contribute to securing its revenue for the future.
- I recommend a “buy” rating for Nvidia, given its potential downside of around 22%, indicating that a significant downturn is unlikely.
Justin Sullivan
Thesis
Nvidia Corporation (NASDAQ:NVDA) has seen an impressive 305% increase from its October lows. While some might perceive Nvidia as overvalued and anticipate an imminent collapse, this perception is not substantiated by its intrinsic value. Through the calculation of three discounted cash flow (“DCF”) models, we arrive at an average price of $451.90 from its current price of $455.72, suggesting that Nvidia is currently trading slightly above its fair value. Nevertheless, there remains potential upside in this investment, and even in the worst-case scenario, the downside is approximately 22%. Considering these factors, I recommend a “buy” rating for Nvidia, and I anticipate that its future price between 2030 and 2032 could potentially surpass the $1,000 mark.
Overview
Why Nvidia’s Revenue increased so much?
Nvidia’s remarkable revenue surge can be largely attributed to its data center business, while the other segments have experienced relatively minimal growth. However, this doesn’t imply that these segments won’t make meaningful contributions in the future.
Q1 2024 (Q1 2024 Filling) Q2 2024 (Q2 2024 Filling)

As illustrated in the Q1 and Q2 2024 financial extracts, Data Center revenue saw a staggering 140% increase between the first and second quarters. In contrast, Gaming, Professional Visualization, Automotive, and OEM & Other segments made comparatively modest contributions when compared to the robust performance of Data Centers. It’s worth noting that Professional Visualization revenue also saw a notable 28% increase between quarters, while Gaming experienced a solid 10% growth during the same period.
Competition
Currently, Nvidia enjoys a dominant position in the AI chips market, primarily due to its H100 chip. However, they have recently unveiled their latest offering, the GH200, set to become available in Q2 2024.
On the other hand, Advanced Micro Devices, Inc. (AMD) has also introduced its AI chip, the ML300, slated for release by the end of this year. Notably, unlike Intel Corporation (INTC) and Nvidia, AMD has not developed specialized chips tailored for the Chinese market.
So, what exactly is Nvidia’s stronghold in this market? The principal moat shared by every CPU and GPU manufacturer lies in compatibility. For instance, just as you can’t interchange an Intel CPU with an AMD CPU using the same motherboard due to differing sockets, a similar scenario unfolds in the AI chips market. Nvidia’s H100 is only compatible with the SXM5 socket, whereas AMD’s ML300 fits exclusively into the SH5 LGA socket. Furthermore, CPUs still play a vital role in managing GPUs, despite the preference for GPUs in AI tasks. Consequently, transitioning to a different AI GPU provider necessitates changing both the motherboard and CPU, incurring substantial costs. As a result, companies find themselves bound to their current setup for a considerable period until their existing chips become inadequate for their needs.
This underscores the significance of Nvidia’s early leadership in the AI chip sector, as it has already secured a loyal customer base.
Can the data center and AI spending still grow in order to make Nvidia still deliver strong revenue growth?
The Data Center Market is poised for steady revenue growth, projecting a CAGR of 4.66% from 2023 to 2027.
Data Center Market Revenue Projections (Statista)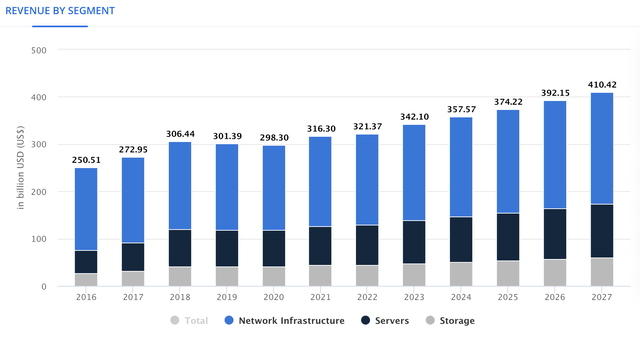
However, within this market lies a hidden gem, the “AI Market“, which has been the driving force behind Nvidia’s phenomenal growth in 2023. The AI market is set to experience robust expansion, with an anticipated CAGR of 17.30% from 2023 to 2030. It’s worth noting that by 2030, an estimated 70% of companies will incorporate AI into their operations, marking a significant 35% increase from the 35% observed in 2023. This underscores the current opportune moment to capitalize on AI investments. While AI stands as the forefront of computing innovation, the question looms regarding what will emerge as the next groundbreaking technology after AI becomes mainstream for 90% of companies.
AI Market – Worldwide (Statista)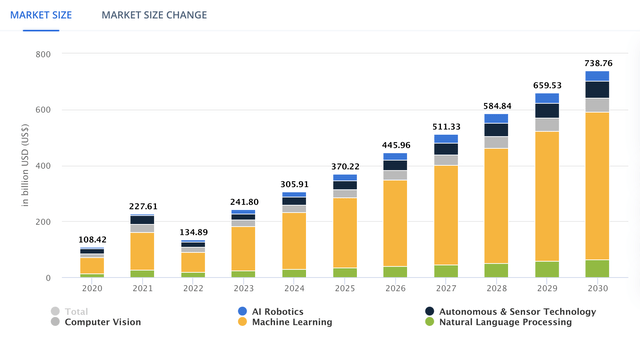
Besides the potential, there’s the matter of investment. Realizing this market’s growth requires substantial capital, and it’s forecasted that spending on AI-centric systems will surge at an impressive rate of 27% from 2023 to 2026. This increase will propel the investment from $154 billion to approximately $300 billion, nearly doubling the expenditure on this transformative technology. Insider sources indicate that banking and retail sectors are the most fervently interested in embracing AI technology.
Spending on AI Centric Systems (Author’s Calculations with base many sources)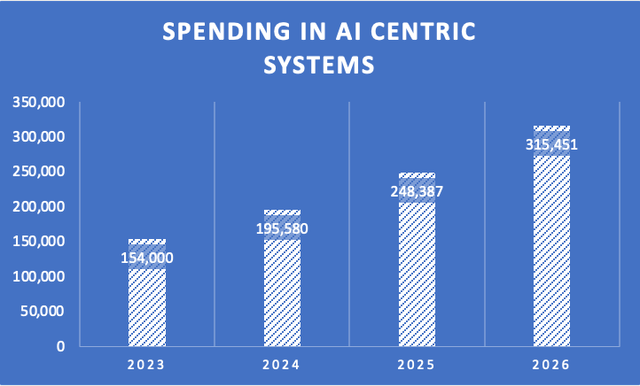
How are the other segments of Nvidia set to perform?
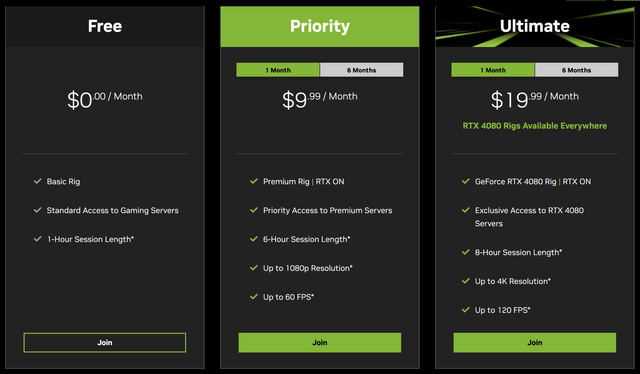
Beyond the Data Center, the gaming segment stands out as a pivotal player, and its future growth is likely to be driven primarily by the emergence of cloud gaming. Cloud gaming presents a compelling alternative to shelling out $1000 for a high-end gaming PC. Consider this: with an annual expenditure of around $200 for the ultimate GeForce Now plan, you would reach the $1,000 PC cost in just 4.6 years. This comparison becomes even more lopsided when you factor in the cost of an RTX 4080, which alone surpasses the $1,000 mark. When you add in expenses for components like the CPU, RAM, motherboard, storage, a 120Hz 4K monitor, and an efficient cooling system for an Intel Core i7 or AMD Ryzen 7 setup, the total easily exceeds $3,000.
Cloud gaming emerges as a more cost-effective alternative, and while some may argue that this will impact Nvidia’s gaming GPU sales, it’s worth noting that within 4.6 years, you not only recoup the initial $1,000 investment, but also face the need for a PC upgrade to keep up with the demands of new-generation games. This transformation effectively mitigates the seasonality factor in Nvidia’s gaming business, making revenue monitoring and projections more predictable.
Estimations suggest that GeForce NOW contributed roughly $1.4 billion to Nvidia’s earnings in FY 2023. This market is anticipated to witness a substantial growth rate of 44.09% from 2023 to 2027.
Cloud Gaming Market Revenue Projections (Author’s Calculation with base on Statista)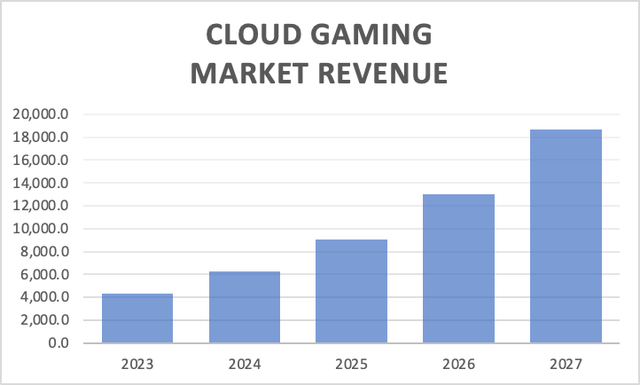
Another integral facet of Nvidia’s gaming sector is its GPUs business, which is forecasted to experience a commendable CAGR of 33.8% from 2023 to 2027.
Gaming GPU Market Projections (Author’s Calculations with base on many sources)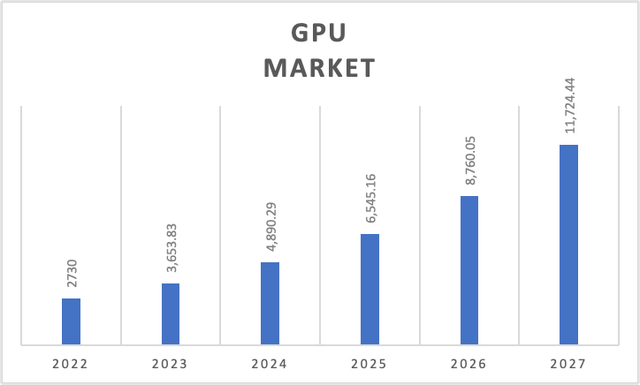
In essence, Nvidia operates in a flourishing market with the potential for robust growth, and given the relatively high barriers to entry, Nvidia is well-positioned to capitalize on this growth, potentially solidifying a duopoly with AMD in this arena.
Financials (In Millions Of USD, Unless Stated Otherwise)
Unquestionably, Nvidia boasts an exceptional financial standing. Presently, its operating margin registers at a robust 29.42%, while its net income margin stands at a commendable 27.83%. Although these figures fall short of the all-time highs recorded in FY2022 at 37.31% and 36.23%, respectively, they remain highly impressive.
Margins of Nvidia (Author’s Calculation)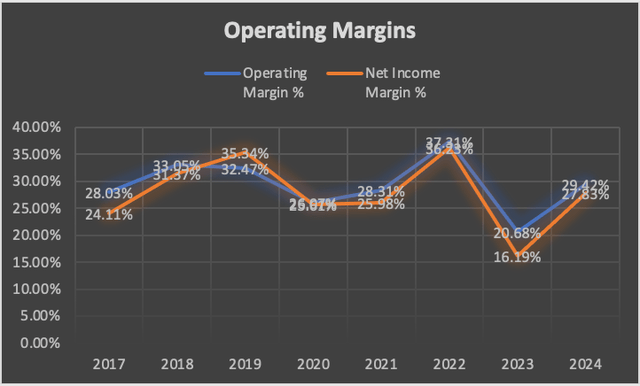
| Revenue | Operating Income | Net Income | |
| 2017 | 6,910 | 1,937 | 1,666 |
| 2018 | 9,714 | 3,210 | 3,047 |
| 2019 | 11,716 | 3,804 | 4,141 |
| 2020 | 10,918 | 2,846 | 2,796 |
| 2021 | 16,675 | 4,721 | 4,332 |
| 2022 | 26,914 | 10,041 | 9,752 |
| 2023 | 26,974 | 5,577 | 4,368 |
| 2024 | 32,681 | 10,798 |
10,326 |
Income Statement (Author’s Calculations)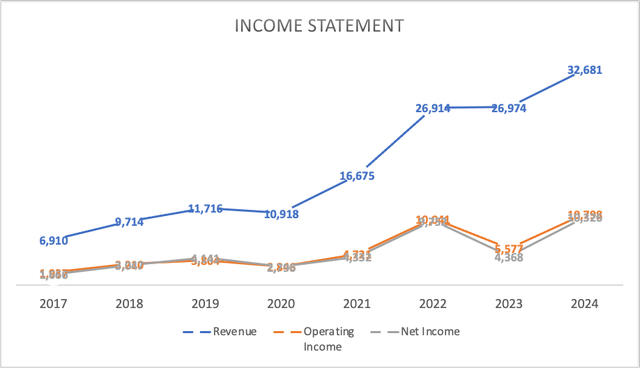
Turning our attention to the company’s debt profile, Nvidia stands out with its relatively low debt level. Currently, its total debt amounts to a modest $9.9 billion. This becomes even more evident when juxtaposed with its substantial cash balance of $16 billion.
Short & Long-Term Debt (Author’s Calculations)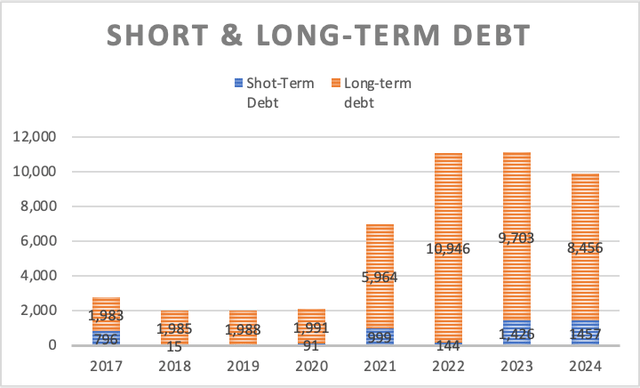
Furthermore, Nvidia consistently generates noteworthy free cash flows (“FCF”), boasting a margin of 30%. While this figure does not surpass the pinnacle reached in 2020 with a 38% FCF margin, it remains highly commendable.
Components of Free Cash Flow (Author’s Calculations) FCF Margin (Author’s Calculations)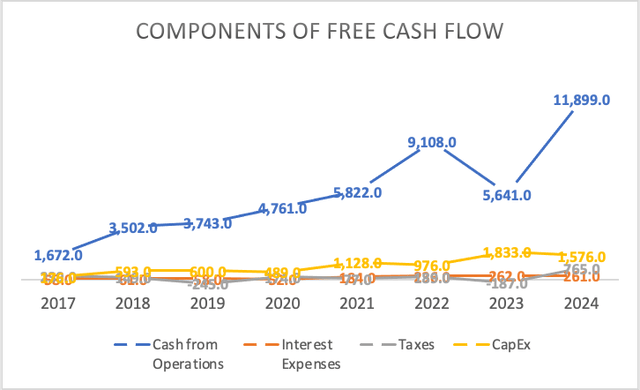
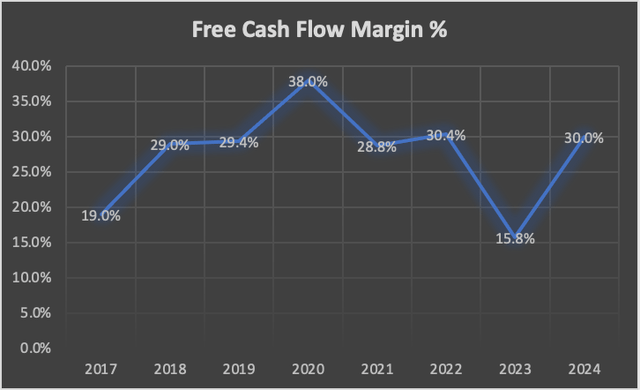
In summary, Nvidia’s financial metrics reinforce what is widely known: the company enjoys healthy margins, strong cash flows, low debt levels, and a substantial cash reserve. These factors collectively position Nvidia favorably to pursue growth opportunities without exposing itself to excessive financial leverage.
Valuation (In Millions Of USD, Unless Stated Otherwise)
We’ve witnessed Nvidia’s remarkable ascent, a staggering 305% surge from its October 2022 lows to its current position. Now, the pivotal question arises: is it wise to invest in Nvidia at this juncture? At first glance, this might seem like a questionable decision, given the near-vertical trajectory that raises concerns about a potential bubble. In light of these considerations, I’ve conducted two Discounted Cash Flow [DCF] models, one aligned with popular expectations and another grounded purely in the anticipated growth of Nvidia’s operating markets. These models yield significantly distinct valuations and future targets. Nonetheless, both models converge to the conclusion that Nvidia’s current valuation appears to be in line with its intrinsic value, signifying a state of fair valuation. It’s essential to note that the further into the future the models project, the higher the present price climbs. While many analysts project revenues from 2023 to 2032, my models span from 2023 to 2028.
Let’s delve into the first model, which hinges on market growth expectations. Essentially, this model assumes a revenue growth rate of 30%, with each final revenue figure derived through the manipulation of individual segments. It’s important to clarify that when I reference 2023, I’m referring to Nvidia’s fiscal year 2024, 2024 corresponds to fiscal year 2025, and so forth.
| Data Center | Gaming | Professional Visualization | Automotive | OEM & Other | Total | |
| 2023 | 29,517.00 | 12,275.71 | 4,079.00 | 1,094.00 | 907.00 | 47,872.71 |
| 2024 | 35,567.99 | 16,632.47 | 4,474.26 | 1,276.70 | 907.00 | 58,858.41 |
| 2025 | 42,859.42 | 22,553.34 | 4,907.81 | 1,489.91 | 907.00 | 72,717.48 |
| 2026 | 51,645.60 | 30,607.34 | 5,383.38 | 1,738.72 | 907.00 | 90,282.04 |
| 2027 | 62,232.95 | 41,573.60 | 5,905.03 | 2,029.09 | 907.00 | 112,647.67 |
| 2028 | 74,990.71 | 56,520.25 | 6,477.22 | 2,367.94 | 907.00 |
141,263.13 |
The gaming segment comprises two key components: cloud gaming and GPU sales. While some may argue that Nvidia’s GPU sales could be negatively impacted by the rise of cloud gaming due to its cost-effectiveness, it’s crucial to consider the dependence on a robust internet connection. In certain regions, people may not be inclined to pay extra for improved internet connectivity, or the infrastructure for high-speed internet, such as optical fiber, may not be widespread. Consequently, for many, the more practical choices are 1) purchasing a PC, or 2) opting for a gaming console. The latter option, in particular, appears to resonate with the majority of gamers due to its affordability. If console sales increase, Nvidia also benefits by supplying GPUs for these consoles. This scenario is particularly likely to play out in emerging market economies.
| GeForce NOW | Sale of GPUs for Gaming | |
| 2023 | 2,017.26 | 10,258.45 |
| 2024 | 2,906.67 | 13,725.80 |
| 2025 | 4,188.22 | 18,365.12 |
| 2026 | 6,034.81 | 24,572.53 |
| 2027 | 8,695.55 | 32,878.05 |
| 2028 | 12,529.42 | 43,990.83 |
| Revenue | Net Income | Plus Taxes | Plus D&A | Plus Interest | |
| 2023 | $47,872.71 | $15,122.99 | $16,161.01 | $18,524.49 | $18,859.60 |
| 2024 | $58,858.41 | $18,593.37 | $19,869.60 | $22,775.44 | $23,187.45 |
| 2025 | $72,717.48 | $22,971.45 | $24,548.19 | $28,138.25 | $28,647.27 |
| 2026 | $90,282.04 | $28,520.10 | $30,477.69 | $34,934.91 | $35,566.88 |
| 2027 | $112,647.67 | $35,585.40 | $38,027.94 | $43,589.36 | $44,377.89 |
| 2028 | $141,263.13 | $44,625.02 | $47,688.04 | $54,662.20 | $55,651.04 |
Additionally, depreciation and amortization (D&A) expenses, as well as interest expenses, are projected based on margins linked to revenue. In this case, Nvidia allocates 4.94% to depreciation and amortization and 0.70% to debt interest expenses.
| D&A Projection | Interest Projection | |
| 2023 | 2,363.475 | 335.11 |
| 2024 | 2,905.840 | 412.01 |
| 2025 | 3,590.062 | 509.02 |
| 2026 | 4,457.224 | 631.97 |
| 2027 | 5,561.415 | 788.53 |
| 2028 | 6,974.161 | 988.84 |
Finally here is the complete DCF model of this first case:
Table of Assumptions (Author’s Calculations) DCF 1 (Author’s Calculations)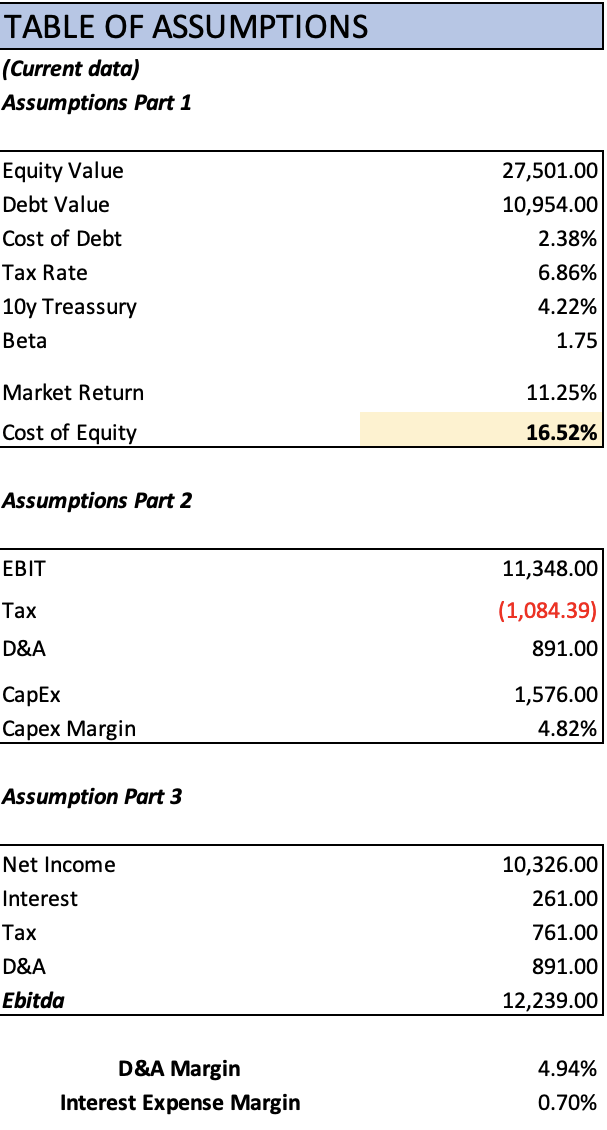
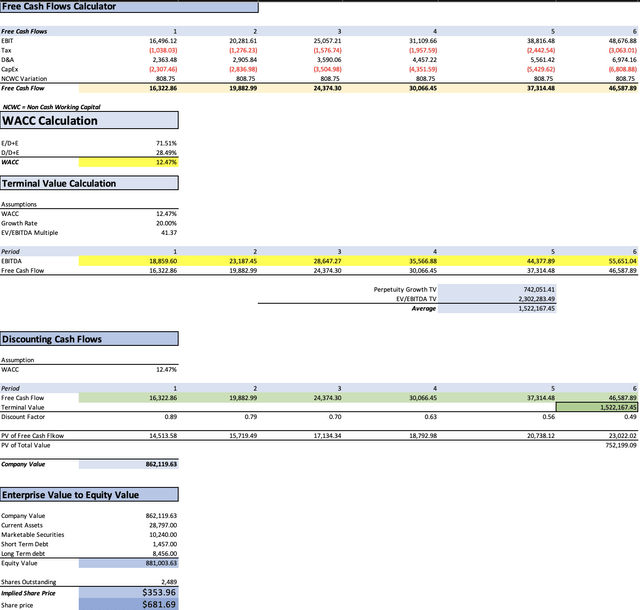
In the first scenario, which represents a “market-perform” estimate, the implied stock price stands at $353, with a future price projection of $681.69. This scenario suggests that Nvidia will grow in tandem with the broader market (Referring to the markets in which Nvidia’s segments operates), neither outpacing nor lagging behind. Notably, this projection anticipates lower revenues than what current analysts forecast for FY2024 (2023 in the model) and FY2025 (2024 in the model).
Nvidia Revenue Estimates (Seeking Alpha)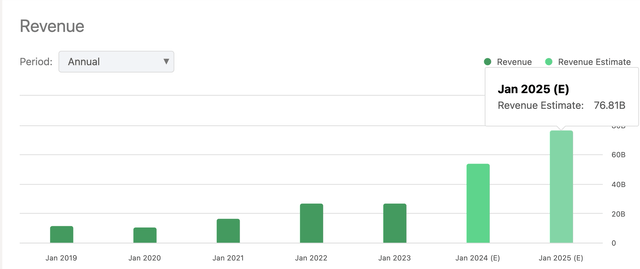
But something curious would be to project the model even further, since, as I previously said, many analysts price Nvidia on expectations that got up to 2032, which means, adding 4 more years to the valuation, and as expected, both, the present and future price increase to $548.29, and an astronomical $1,658.85 respectively.
Now, shifting our focus to the second scenario, which assumes Nvidia will grow at the rate analysts are expecting, a roughly 44% annual revenue growth rate. In this case, the DCF model suggests Nvidia is fairly valued, indicating a present price of $454.71 and a future price of $882.18. Considering the current stock price of $455.72, this implies an annual return of 18%. As with the first scenario, extending the projection timeline further only leads to higher price estimates
| Revenue | Net Income | Plus Taxes | Plus D&A | Plus Interest | |
| 2023 | $50,011.00 | $15,798.47 | $16,882.87 | $19,351.91 | $19,701.99 |
| 2024 | $67,299.80 | $21,260.01 | $22,719.27 | $26,041.86 | $26,512.96 |
| 2025 | $90,389.79 | $28,554.13 | $30,514.06 | $34,976.60 | $35,609.33 |
| 2026 | $116,947.16 | $36,943.61 | $39,479.38 | $45,253.06 | $46,071.69 |
| 2027 | $151,101.83 | $47,733.07 | $51,009.42 | $58,469.31 | $59,527.03 |
| 2028 | $183,670.53 | $58,021.52 | $62,004.06 | $71,071.87 | $72,357.56 |
| ^Final EBITA^ |
Here is the complete DCF model:
In essence, this analysis demonstrates that Nvidia’s stock is not poised for a dramatic nosedive that would present a once-in-a-lifetime buying opportunity. Rather, it appears to be fairly valued at present. In the unlikely event that the stock experiences a significant downturn, it might decline to approximately $353.96 (which is the value suggested by the first DCF without projecting it up to 2032), representing a 22% reduction in its stock price. Those who missed the opportunity to enter Nvidia in October 2022, including the author, may have arrived a bit late to the party. Nonetheless, Nvidia still offers a promising return for the future. Consequently, the current level presents an attractive entry point to invest in the stock.
Considering these factors, Nvidia receives a “buy” rating. Despite having already delivered an astounding 305% return from its October lows, it still promises a favorable future return. As demonstrated by the models, the potential downside is limited to 22%, which could occur in the event of an economic downturn. This risk-return profile makes it a compelling investment choice. While it’s challenging to pinpoint the true present stock price from among the various models, taking an average suggests a share value of approximately $451.90.
Risks to Thesis
The primary risk to this optimistic outlook is the potential for an economic downturn. In theory, such a downturn could prompt businesses to curtail their AI investments, which, as we are aware, have significantly contributed to Nvidia’s impressive earnings performance in recent quarters. Another vulnerable segment during an economic downturn would be gaming, given that a substantial portion of its customer base consists of individual consumers, who tend to be more sensitive to economic fluctuations compared to institutional clients.
As evidenced by my models, the projection of gaming generating $56 billion in revenue by 2028 might strike some as ambitious, if not audacious. However, it’s essential to note that any surplus from this growth can be redistributed to other segments like data centers and automotive, which, according to some assessments, might even be underestimated in my calculations. This approach helps temper the risk of overly optimistic revenue expectations within a single segment.
Nvidia’s business profile is relatively insulated from significant risks. As demonstrated earlier, the company maintains a modest level of debt and boasts ample cash reserves, more than enough to cover its entire debt load. Moreover, Nvidia refrains from disbursing exorbitant dividends, preventing any strain on its financial position.
Lastly, the most likely risk (I am not implying it will materialize) in the near term (1-3 months) is a potential dip in the stock price. After its impressive run, the stock may appear overvalued, prompting many traders to adopt a “sell first, ask questions later” stance. However, this doesn’t need to be a major concern, as investors can seize the opportunity to buy more shares and lower their average purchase price.
Conclusion
In summary, Nvidia has seen an impressive 305% surge in recent times, but is it still a smart investment? In the two scenarios explored: one aligned with market performance and another based on analyst expectations. Both suggest Nvidia is fairly valued.
Potential risks include the impact of an economic downturn on AI investments and the volatility of the gaming segment. However, Nvidia’s strong financial position mitigate these concerns.
With low debt, ample cash reserves, and small dividends, Nvidia stands strong. While a short-term stock price dip is possible after its rapid rise, this could be an opportunity for savvy investors to buy in.
In conclusion, Nvidia remains a promising investment. It may not be a ground-floor opportunity, but it still offers potential for future returns. With its adaptability and resilience, I confidently rate Nvidia as a “buy.”
Analyst’s Disclosure: I/we have no stock, option or similar derivative position in any of the companies mentioned, but may initiate a beneficial Long position through a purchase of the stock, or the purchase of call options or similar derivatives in NVDA over the next 72 hours. I wrote this article myself, and it expresses my own opinions. I am not receiving compensation for it (other than from Seeking Alpha). I have no business relationship with any company whose stock is mentioned in this article.
Seeking Alpha’s Disclosure: Past performance is no guarantee of future results. No recommendation or advice is being given as to whether any investment is suitable for a particular investor. Any views or opinions expressed above may not reflect those of Seeking Alpha as a whole. Seeking Alpha is not a licensed securities dealer, broker or US investment adviser or investment bank. Our analysts are third party authors that include both professional investors and individual investors who may not be licensed or certified by any institute or regulatory body.

