Summary:
- Amazon’s stock price has shown strong upward growth and is currently testing a key level, which could lead to a significant upward surge.
- The company’s diversification into AWS and strategic acquisitions showcase its drive for innovation and growth.
- Amazon’s financial performance is robust, with a high gross profit margin and a focus on efficiency and cost management under CEO Andy Jassy.
HJBC
Amazon.com, Inc. (NASDAQ:AMZN) continues to captivate the world with its unparalleled growth and innovation. Since it was founded, the company has stood as a shining example for stock market enthusiasts, consistently displaying strong upward growth. Yet, like all success stories, Amazon’s journey reveals not just the narrative of its meteoric ascent but also lessons from its continuous evolution. In the ever-evolving market landscape, Amazon embodies adaptability and vision, effortlessly merging its foundational spirit with the weight of worldwide growth. From cementing its stronghold in online retail to venturing into realms like Amazon Web Services (AWS) and the latest strategic buyouts, Amazon showcases an unending drive for innovation. This article provides a technical assessment of Amazon’s stock price to anticipate its upcoming trajectory and identify investment prospects. The stock price has established a strong base, currently testing a key level. Surpassing this key level could pave the way for a significant upward surge.
Amazon’s Uncharted Trajectory in the E-commerce Galaxy
Amazon has consistently been at the forefront of the stock market’s stellar performers and charted an incredible growth trajectory, with its stock continuing its upward march this year. Amazon’s market share of 37.8% solidifies its position as the market leader. The ubiquitous presence of e-commerce today benefits Amazon above all other players. Its Prime members are rising, showing that consumers are increasingly relying on Amazon for many of their everyday essentials. To maintain this dominance, Amazon has restructured its delivery mechanism, transitioning from a national to a regional system, ensuring faster delivery and increased customer satisfaction.
The company’s diversification into cloud computing through AWS has been a game-changer. AWS, with innovations like CodeWhisperer – an AI tool that assists developers in code generation, has witnessed a 12% sales spike in Q2 2023, outpacing Amazon’s overall 11% growth. AWS is a significant contributor to Amazon’s operating income, further highlighting its importance to the company’s revenue model. Amazon’s acquisitions of MGM Studios and One Medical, showcase its intent to strengthen its content library for Prime streaming and explore the healthcare industry’s vast potential, respectively. Furthermore, Amazon’s partnership with Shopify (SHOP), enabling Prime purchases in Shopify merchant stores, underlines the company’s willingness to innovate and collaborate.
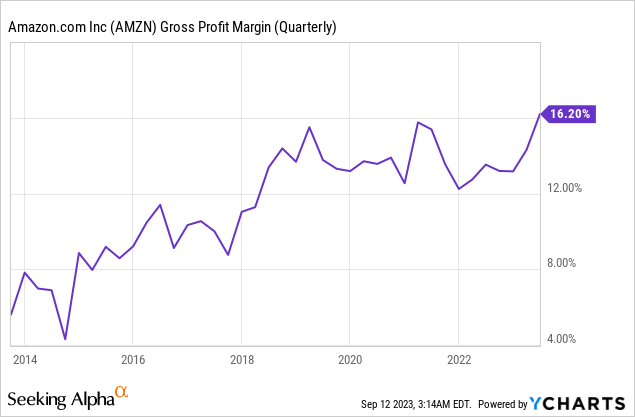
In Q2 2023, Amazon registered 16.20% of gross profit margin as shown in the chart below. Amazon’s increased gross profit margin signifies a robust financial performance and indicates that the company effectively manages its cost of goods sold relative to its revenue. This record-high margin not only showcases improved operational efficiency but also offers potentially increased profitability for the firm, strengthening its financial position in the market.
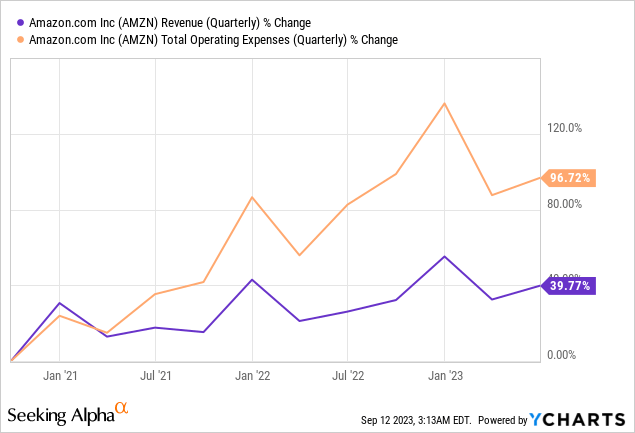
The following chart depicts the percentage change in revenue and total operating expenses for the past 3 years. Since Andy Jassy assumed the CEO role, the growth rate of operating expenses has outstripped that of revenue by over twice, with a 96.72% surge in operating expenses contrasted with a 39.77% increase in revenue. This suggests that Amazon has invested heavily in its operations, perhaps in expansion, research and development, or other strategic initiatives. However, if this trend persists over the long term, it could raise concerns about the company’s profitability and operational efficiency, as ideally, revenue growth should outpace or be in line with the growth of operating expenses.
For the third quarter of 2023, Amazon projects net sales between $138.0 billion and $143.0 billion, reflecting a 9% to 13% growth from the same period in 2022, aided by an anticipated 120 basis point boost from foreign exchange rates. Operating income is estimated to range from $5.5 billion to $8.5 billion, a significant increase from the $2.5 billion in the third quarter of 2022. These projections assume no further business acquisitions, restructurings, or legal settlements, highlighting Amazon’s confidence in its organic growth and operational efficiency.
A Deep Dive into Bullish Price Configurations
The long-term technical analysis of Amazon, as illustrated in the quarterly chart below, paints a notably bullish picture. After the Great Recession, Amazon’s stock price soared in a parabolic trajectory. This significant uptrend post-recession is attributed to numerous factors. Beyond its initial focus on e-commerce, Amazon soon began to dominate not only in online shopping but also in sectors like cloud computing through AWS – a major revenue generator. Introducing pioneering products like Kindle and Amazon Prime has entrenched customer loyalty and diversified its revenue. Acquisitions of entities such as Whole Foods and Twitch have further enriched its business portfolio. The worldwide migration to online shopping, particularly intensified by occurrences like the COVID-19 outbreak, bolstered Amazon’s standing as a primary shopping platform, pushing its stock value to unparalleled peaks.
Amazon’s stock price reached its high of $188.21 in 2021 before undergoing a correction. Due to the inherently volatile nature of the parabolic trend, significant corrections are given. The price dip found support at $81.43 before rallying again. The quarterly chart reveals that the Q1 2023 candlestick signaled a vital reversal, indicating robust price dynamics and an influx of long-term positions. The subsequent quarter mirrored this positive trajectory, showcasing another bullish candle. Based on these trends, it’s anticipated that Q3 2023 will also hover at these elevated levels. Additionally, with the RSI ascending from the mid-50s, price hikes are anticipated.
Amazon Quarterly Chart (stockcharts.com)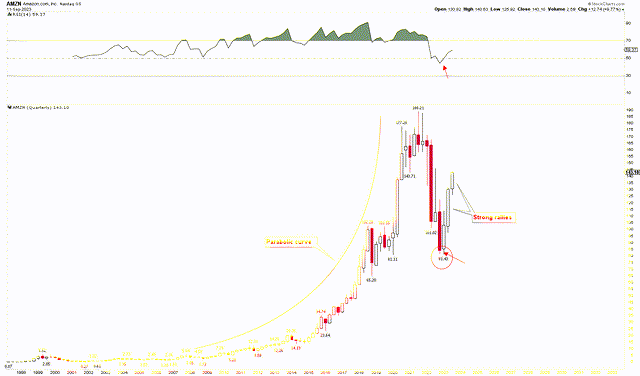
Examining the monthly chart provides further evidence of Amazon’s upward trajectory. The critical reversal during Q1 2023 in the quarterly chart was echoed by the monthly candles, indicating a dominant bullish trend. For seven consecutive months, the stock price has risen steadily. However, a critical juncture is on the horizon. Should the stock surpass the $146 threshold and sustain a monthly closure above it, a technical upswing might begin. The solid monthly momentum, combined with the bullish candle patterns, indicates a probable breakout. Nonetheless, the continuous seven-month rise may suggest an impending correction. Should this occur, it might present an ideal buying window. With the RSI on a monthly chart exceeding 50 and continuing its upward journey, the case for bullish momentum in Amazon strengthens.
Amazon Monthly Chart (stockcharts.com)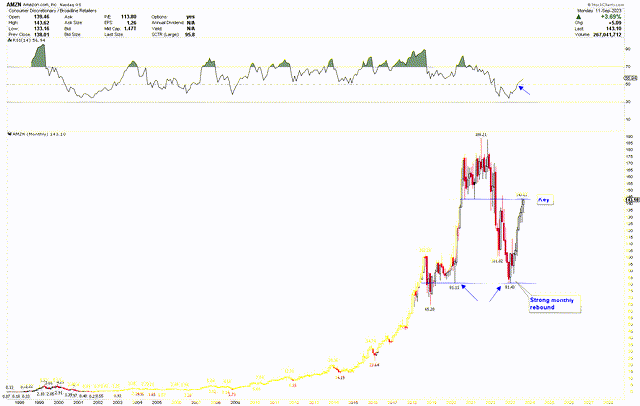
Key Action for Investors
From the above discussion, it’s evident that Amazon’s trajectory, both long-term and short-term, is strongly bullish. However, the stock price is approaching a critical level, which could trigger a market correction. The subsequent short-term weekly chart illustrates this pattern further. It reveals that a pivotal reversal evident in the quarterly chart is mirrored by an inverted head and shoulders pattern in the weekly chart. This robust price formation underscores the foundational pattern and implies that the market has identified its low point, positioning itself for an upward surge. There’s also been a breakout from this inverted head and shoulder pattern’s neckline, leading to a major resistance point at $146. Interestingly, the candle from the previous week formed an inside bar, hinting at price consolidation instead of a correction – a favorable sign. Moreover, this inside bar has been overtaken, and the stock is advancing towards a significant resistance level at $146, poised to break through to the upside potentially.
Amazon Weekly Chart (stockcharts.com)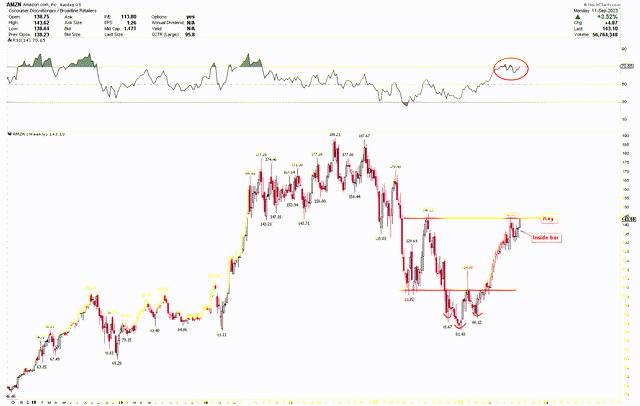
Given the solid bottoming patterns observed across quarterly, monthly, and weekly charts and the emergence of an inside bar at the resistance following this bottoming pattern, there’s a strong indication of potential breakouts and increased stock prices. Investors might consider buying Amazon at its current level since the inside bar has been breached. If any price drop ensues due to the significant resistance, this could be an opportunity for investors to accumulate more positions, anticipating a future rally.
Market Risk
Amazon’s impressive historical performance doesn’t necessarily predict future success, and investors should approach past data with caution. Amazon’s transformation from a primary e-commerce platform to a multi-faceted ecosystem, including AWS and advertising, links its success to the health of various sectors. Any disruptions or downturns in these segments could adversely affect its overall performance.
On a global scale, Amazon is vulnerable to economic slumps in crucial markets, geopolitical conflicts, and potential trade barriers that might hinder its supply chain and market accessibility. The growth in Prime members has become a critical revenue pillar for Amazon, and challenges in retaining or growing this segment could significantly impact its financial health. From a technical perspective, Amazon’s stock exhibits potential volatility, especially given its parabolic trend after the Great Recession. Stocks with such rapid growth are prone to notable corrections. The recent rally reaching a resistance of $146 further suggests that if prices don’t break this level, market corrections might ensue.
Bottom Line
Amazon stands as an embodiment of innovation and adaptability in the world of e-commerce and beyond. Its historical achievements underscore its capacity for resilience, adaptability, and growth, as witnessed in its ventures spanning from its core e-commerce operations to domains like AWS and recent acquisitions. The company’s dominant market position, expanding Prime membership, and forays into fresh industries underscore its commanding presence and relentless drive for growth. However, the market dynamics and competition from rival platforms present genuine challenges, reminding investors of the complexities intrinsic to large-scale operations.
From a technical perspective, the stock charts project a bullish stance for Amazon in both the short-term and long-term. While recent data suggests potential growth and upward trends, the presence of market resistance and inherent volatility also indicate possible corrections. The stock price is nearing the crucial $146 mark, surpassing this threshold could trigger a significant upward rally. Yet, given the seven-month continuous price surge without any correction, a minor pullback is possible. This could serve as an optimal entry point for those looking for long-term investments. According to long-term and short-term chart patterns, the lowest point appears established, and a price hike seems probable. Investors may consider buying Amazon at its current value and increasing their holdings if the stock price dips to $100.
Analyst’s Disclosure: I/we have no stock, option or similar derivative position in any of the companies mentioned, and no plans to initiate any such positions within the next 72 hours. I wrote this article myself, and it expresses my own opinions. I am not receiving compensation for it (other than from Seeking Alpha). I have no business relationship with any company whose stock is mentioned in this article.
Seeking Alpha’s Disclosure: Past performance is no guarantee of future results. No recommendation or advice is being given as to whether any investment is suitable for a particular investor. Any views or opinions expressed above may not reflect those of Seeking Alpha as a whole. Seeking Alpha is not a licensed securities dealer, broker or US investment adviser or investment bank. Our analysts are third party authors that include both professional investors and individual investors who may not be licensed or certified by any institute or regulatory body.
