Summary:
- Carnival Corporation, the world’s largest cruise company, presents a complex financial landscape with significant debt and pandemic-related challenges.
- Despite recent financial hurdles, Carnival holds promise for investors, with a fair value estimate of $22.07, indicating a 46% potential upside from the current stock price.
- In a scenario of 50% dilution, the stock offers an attractive 22.9% annual return, providing a substantial margin of safety.
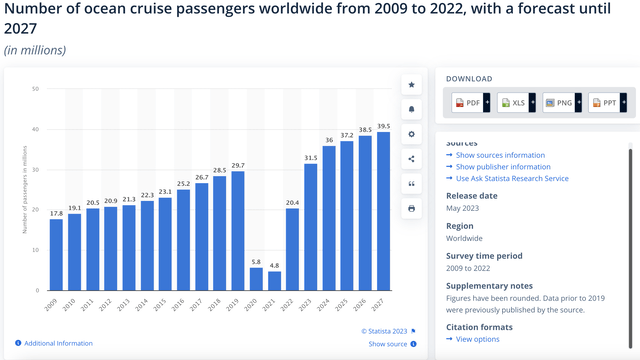
- Historical data, such as the resilience of cruise passenger numbers during the 2009 financial crisis, suggests the cruise industry’s underlying strength.
SeregaSibTravel/iStock Editorial via Getty Images
Thesis
In my previous article about Carnival Corporation (NYSE:CCL), I estimated Carnival’s fair value to be $10.77 based on revenue projections for its lower berths up to 2025. However, I failed to realize that stock dilution wouldn’t have as catastrophic an impact as I initially thought. Subsequent to that article, the stock rapidly rose but later experienced a decline, resulting in a 3% loss since the publication of my initial piece on the stock.
In this article, I will elucidate why I am giving Carnival a “strong buy” rating and establishing a stock price target of $22.07. In summary, this recommendation is based on the fact that, even with dilution considered, the stock still has the potential to yield a 22% annual return.
Overview
Carnival, the world’s largest cruise company, has historically leveraged its size advantage during price wars. However, at the onset of the pandemic, this extensive fleet became a liability due to the substantial maintenance costs it entailed.
In a previous article on Carnival, I issued a “sell” rating based on its long-term outlook. However, I failed to examine the potential price trajectory if Carnival were to significantly dilute its stocks. I have now conducted that analysis, and even in the event of such dilution, Carnival could still offer a respectable 22% annual return, though notably lower than the returns it could achieve without dilution.
| Revenue | Net Income | Plus D&A | Plus Interest | |
| 2023 | 21,340,000,000 | 2,134,000,000 | 5,011,336,220 | 6,500,461,220 |
| 2024 | 21,976,068,855 | 2,197,606,886 | 5,160,706,177 | 6,716,841,802 |
| 2025 | 22,329,424,038 | 2,232,942,404 | 5,243,685,635 | 6,869,847,363 |
| 2026 | 22,976,977,335 | 2,297,697,734 | 5,395,752,519 | 7,095,091,524 |
| 2027 | 23,643,309,678 | 2,364,330,968 | 5,552,229,342 | 7,328,038,603 |
| 2028 | 24,328,965,658 | 2,432,896,566 | 5,713,243,992 | 7,568,964,670 |
| ^Final EBITA^ |
It’s worth noting that my earlier projections are more conservative compared to those of industry analysts, primarily because they rely on Carnival’s lower berths growth projections.
Carnival’s Lower berths Projections (2022 Annual Report)
| Lower Berths Projections | Revenue projections | Full Year | |
| Q1 2023 | 223000 | 4,432,000,000.00 | |
| Q2 2023 | 223,000 | 4,431,999,999.58 | |
| Q3 2023 | 223,260 | 4,437,167,353.84 | |
| Q4 2023 | 223,260 | 4,437,167,353.84 | 17,738,334,707.26 |
| Q1 2024 | 238,150 | 4,733,097,757.40 | |
| Q2 2024 | 241,150 | 4,792,721,075.78 | |
| Q3 2024 | 241,150 | 4,792,721,075.78 | |
| Q4 2024 | 241,150 | 4,792,721,075.78 | 19,111,260,984.74 |
| Q1 2025 | 241,150 | 4,792,721,075.78 | |
| Q2 2025 | 241,150 | 4,792,721,075.78 | |
| Q3 2025 | 245,470 | 4,878,578,654.25 | |
| Q4 2025 | 245,470 | 4,878,578,654.25 | 19,342,599,460.05 |
Financials
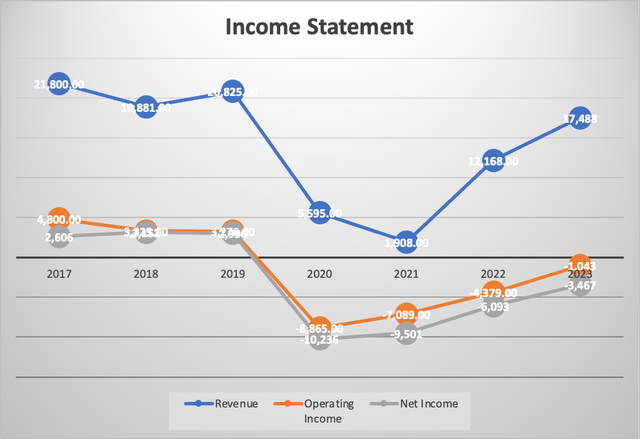
When we delve into Carnival’s income statement, specifically from 2017 onwards, a noticeable trend emerges. Overall, the company’s revenue has remained stagnant, with projections for 2023 indicating that it is poised to remain nearly on par with the figures from 2017.
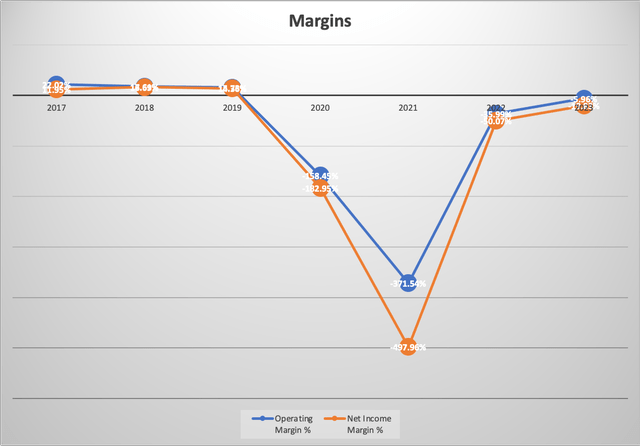
Another aspect of stability within Carnival lies in its profit margins, at least prior to the pandemic. However, it’s crucial to acknowledge that these margins are unlikely to rebound to their previous levels in the medium term. This is primarily due to the need to repay a substantial amount of debt. To put this into perspective, if we consider the interest expenses incurred during the 2017-2019 period, which mirror the current level of $1.9 billion, Carnival would have been operating with a net income margin of 4.78%.
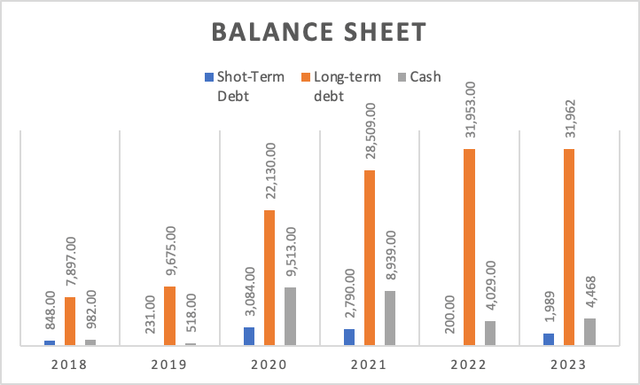
It goes without saying that Carnival’s balance sheet is in disarray, characterized by high levels of long and short-term debt. While the company may seem to have a substantial $4 billion cash reserve, it’s important to note that this increase is largely attributed to the capital raised and cruise credits. If we look at the figures from 2018 and 2019, Carnival’s cash reserves did not exceed $1 billion, with the exception of 2015.
Finally, we come to Carnival’s free cash flow, which takes a negative turn at the onset of the pandemic when cash from operations plummeted. It’s worth noting that even in the 2017-2019 period, Carnival’s free cash flow was on a downward trajectory. Examining the components graph reveals that increased capital expenditures were a major factor contributing to this decline. During that period, Carnival maintained free cash flow margins of 11.5%, 10.3%, and 4.2%.
Author’s Calculations Author’s Calculations Author’s Calculations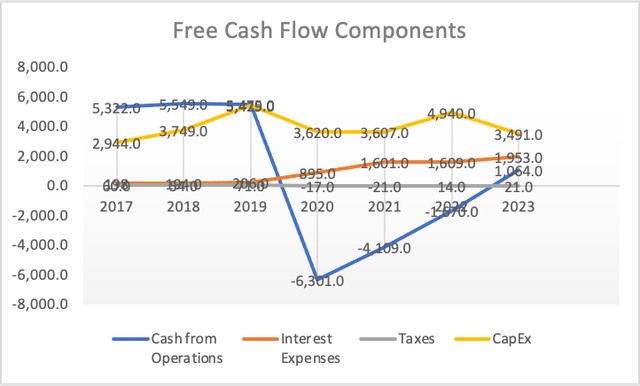
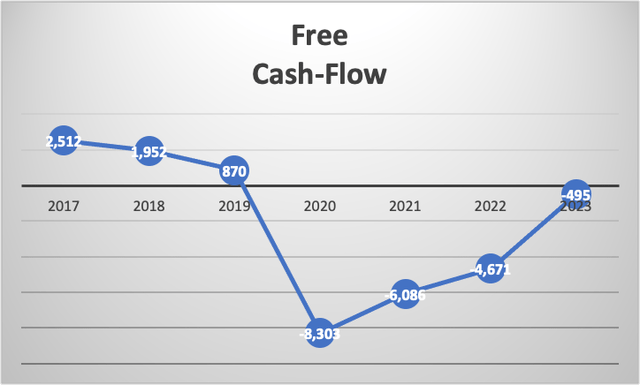
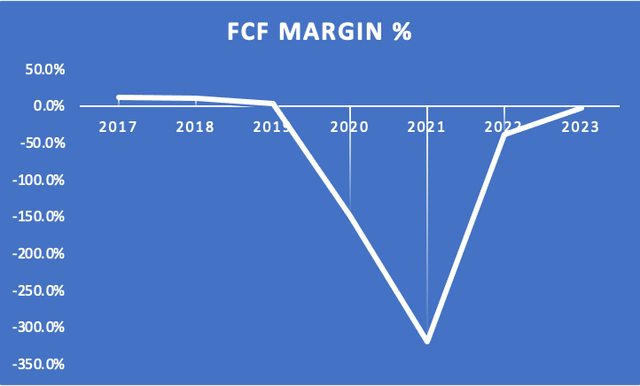
In summary, Carnival’s financial position is undeniably weak, but there are signs of improvement on the horizon. It’s plausible that over the course of the next five years, Carnival could make significant strides in addressing its debt concerns.
Valuation
To initiate this valuation, the first step is projecting potential revenues, with the subsequent critical focus on net income. As mentioned earlier, net income has consistently been negative due to two primary factors: historically high interest expenses and elevated cost of revenues. At the outset of the cruise industry’s reactivation, Carnival embarked on a strategy of offering discounted trips, which partially contributed to the increased cost of revenues. However, they have since reversed this policy and are now prioritizing service quality.
| Revenue | Net Income | Plus Taxes | Plus D&A | Plus Interest | |
| 2023 | 21,340.00 | -$130.00 | -$130.79 | $2,709.56 | $5,091.11 |
| 2024 | 23,820.00 | $1,000.00 | $993.91 | $4,164.35 | $6,822.66 |
| 2025 | 25,725.60 | $1,229.68 | $1,222.19 | $4,646.27 | $7,517.24 |
| 2026 | 27,783.65 | $1,328.06 | $1,319.97 | $5,017.97 | $8,118.62 |
| 2027 | 30,006.34 | $1,434.30 | $1,425.56 | $5,419.41 | $8,768.11 |
| 2028 | 32,406.85 | $1,549.05 | $1,539.61 | $5,852.96 | $9,469.56 |
| ^Final EBITA^ |
The revenue and net income figures for 2023 and 2024 are directly sourced from the stock’s summary page on Seeking Alpha. Beyond 2024, net income is calculated using the pre-pandemic net income margin and factoring in current debt repayments, which stand at 4.78%. Depreciation and amortization (D&A) as well as interest expenses are derived from margins tied to revenue, specifically 13.31% and 11.16%, respectively.
| D&A Projection | Interest Projection | |
| 2023 | 2,840.354 | 2,381.54 |
| 2024 | 3,170.442 | 2,658.31 |
| 2025 | 3,424.077 | 2,870.98 |
| 2026 | 3,698.004 | 3,100.66 |
| 2027 | 3,993.844 | 3,348.71 |
| 2028 | 4,313.351 | 3,616.60 |
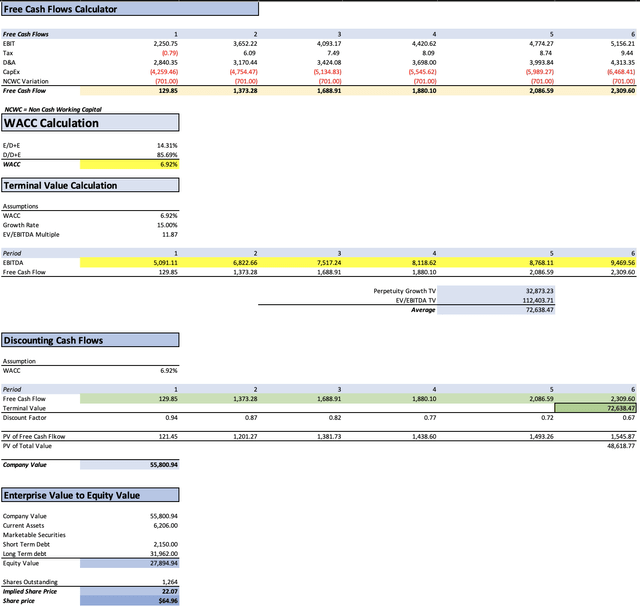
Here is a table summarizing the assumptions and the DCF (Discounted Cash Flow) model. The table of assumptions is populated with the latest available data on the company.
| TABLE OF ASSUMPTIONS | |
| (Current data) | |
| Assumptions Part 1 | |
| Equity Value | 5,865.00 |
| Debt Value | 35,120.00 |
| Cost of Debt | 5.56% |
| Tax Rate | 0.61% |
| 10y Treasury | 4.22% |
| Beta | 1.95 |
| Market Return | 10.50% |
| Cost of Equity | 16.47% |
| Assumptions Part 2 | |
| EBIT | -1,493.00 |
| Tax | 0.79 |
| D&A | 2,328.00 |
| CapEx | 3,491.00 |
| Capex Margin | 19.96% |
| Assumption Part 3 | |
| Net Income | (3,467.00) |
| Interest | 1,953.00 |
| Tax | 21.00 |
| D&A | 2,328.00 |
| Ebitda | 835.00 |
| D&A Margin | 13.31% |
| Interest Expense Margin | 11.16% |
As demonstrated, the estimated fair value based on these expectations stands at $22.07, representing a 46% upside from the current stock price of $15.11. Additionally, there’s a future price projection of $64.96, marking a substantial 329.9% upside, translating to a 65% return over a 5-year period. While this opportunity appears significant, it’s important to acknowledge that the stock is presently depressed due to its debt burden and the potential for dilution.
Now, let’s consider an imaginary scenario: if Carnival were to reduce 50% of its debt, decreasing it from $33.9 billion to $16.9 billion, the future stock price would be $32.48. This still offers a robust 22.9% annual return from the current stock price of $15.11. Essentially, at the current stock price, there is a sufficient margin of safety to allow for substantial debt reduction by Carnival, potentially enabling them to shift from servicing non-operating cruises during the pandemic to expanding cruise ships or enhancing onboard amenities to drive higher onboard spending. This strategic move could effectively transform toxic debt into productive debt, which, in my estimation, would help compensate for the potential reduction in projected annual returns resulting from a significant dilution.
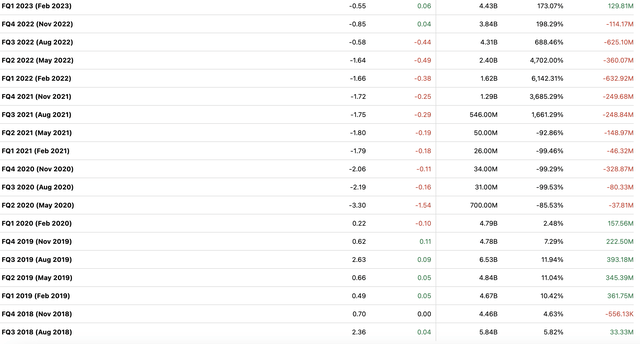
Going back to 2018, it’s evident that Carnival consistently outperformed expectations in almost every quarter until 2020 arrived. Subsequently, 2021 and 2022 followed, bringing with them EPS misses. However, as we enter 2023, we observe that this trend has finally come to an end. The continuous setbacks during the pandemic era could possibly be attributed to the fact that no one truly knew how the situation would unfold. It marked the first time in history that cruises and planes remained grounded and inactive for such an extended period. Consequently, it’s uncertain whether the recent streak of quarterly successes will persist.
In any case, I wouldn’t make any decisions based solely on this data. While it’s tempting to predict that the company will continue to perform well, it’s important to acknowledge that it’s nearly impossible to forecast the stock’s performance in the short term. For instance, it might underperform in Q1 but then make a comeback in Q2, compensating for the earlier loss. The stock market is highly unpredictable. However, it’s comparatively easier to project where it might stand in 5 or 10 years.
Considering the substantial upside potential and the ability to maintain a respectable return even in the event of a significant dilution, I rate Carnival as a “Strong Buy” and set a near-term target stock price of $22.07. Looking ahead, if no dilution occurs, I anticipate that the stock could reach $64.96.
Risks
The primary risk in this analysis lies within the realm of macroeconomics, as Carnival’s ability to meet its debt obligations hinges on the overall health of the cruise industry. Currently, the demand for cruises is robust, and passengers are spending considerably more while on board than they were in 2019. However, if this demand were to be adversely impacted by external factors, such as a recession, it could usher in a period of significant uncertainty for both the stock and the company’s future. Nonetheless, there is currently no concrete evidence to suggest a sharp decline in cruise passengers due to an economic downturn.
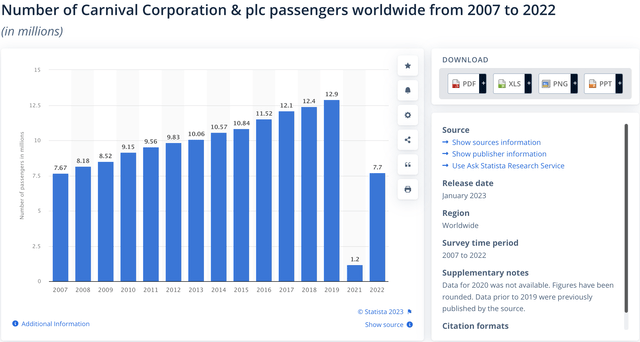
In fact, historical data provides an interesting perspective. During the 2009 financial crisis, cruise passenger numbers remained resilient. When examining Carnival’s specific figures, it becomes apparent that despite the challenging economic backdrop of the great recession, passenger volume continued to grow, experiencing an 11% increase from 2007 to 2009. Essentially, the substantial drop in the stock price during that period could be attributed more to the knee-jerk reaction of “sell first, ask questions later” rather than a reflection of the underlying resilience of the cruise industry.
Conclusion
In conclusion, Carnival Corporation, as the world’s largest cruise company, navigates a complex financial landscape that requires careful evaluation. While recent financial performance may appear lackluster due to significant debt and pandemic-related challenges, a closer examination reveals promising indicators. Projections suggest that Carnival has the potential to offer investors substantial returns, with a fair value estimate of $22.07, signifying a 46% upside from the current stock price. Even under the hypothetical scenario of substantial dilution and debt reduction, the stock still offers an attractive 22.9% annual return. This demonstrates a robust margin of safety for investors, allowing for strategic debt management and the potential transformation of toxic debt into productive assets.
It’s essential to consider potential macroeconomic risks, as Carnival’s ability to service its debt is closely tied to the overall health of the cruise industry. However, historical data, particularly during the 2009 financial crisis, offers an encouraging precedent. Despite the economic turmoil, cruise passenger numbers remained resilient, showcasing an 11% growth from 2007 to 2009. This historical context suggests that while the stock may experience periods of uncertainty and sell-offs in response to broader economic downturns, the cruise industry’s underlying strength and resilience should not be underestimated.
In light of the substantial upside potential and the stock’s ability to offer a decent return even in challenging scenarios, I rate Carnival as a “Strong Buy.” With a near-term target stock price of $22.07 and the possibility of reaching $64.96 if no dilution occurs, Carnival presents an enticing investment opportunity for those willing to weather short-term uncertainties in exchange for long-term gains. As always, investors should conduct their due diligence and monitor industry trends to make informed investment decisions in the ever-evolving world of finance.
Analyst’s Disclosure: I/we have no stock, option or similar derivative position in any of the companies mentioned, but may initiate a beneficial Long position through a purchase of the stock, or the purchase of call options or similar derivatives in CCL over the next 72 hours. I wrote this article myself, and it expresses my own opinions. I am not receiving compensation for it (other than from Seeking Alpha). I have no business relationship with any company whose stock is mentioned in this article.
Seeking Alpha’s Disclosure: Past performance is no guarantee of future results. No recommendation or advice is being given as to whether any investment is suitable for a particular investor. Any views or opinions expressed above may not reflect those of Seeking Alpha as a whole. Seeking Alpha is not a licensed securities dealer, broker or US investment adviser or investment bank. Our analysts are third party authors that include both professional investors and individual investors who may not be licensed or certified by any institute or regulatory body.

