Summary:
- REITs are down 26% while the S&P is only 4.3% off its record highs, indicating potential buying opportunities.
- American Tower Corporation is one of Brad’s Top 5 REIT opportunities. It’s also the most undervalued at a 35% historical discount.
- American Tower’s yield is at record highs. From the perspective of income investors, it’s the best time ever to buy American Tower.
- American Tower’s growth outlook remains its historical 13%, and combined with the exceptional ultra-value discount, creates the opportunity for Buffett-like 21% annual returns.
- If you are comfortable with the risk profile, this world-beater fast-growing REIT is an Ultra Value buy. If you don’t buy American Tower now, you just don’t want to own it.
Viktor_Gladkov
This article was coproduced with Dividend Sensei.
During bear markets, bargains drop like raindrops in a monsoon.
Many people don’t realize that the 2022 bear market never ended.
Like Morgan Stanley predicted, the market came close to new record highs, creating a sense of complacency.
But now, the realities of 5.25% of rate hikes are starting to work through the economy.
We’re not just here to warn you when your brother’s index fund will likely take a tumble.
We’re here to point out that it’s always and forever a market of stocks, not a stock market.
The S&P is down 4.3% off its record highs. Yet did you know that real estate investment trusts, or REITs, are down 26%? Or that American Tower Corporation (NYSE:AMT) is down 37%?
When you discover that a world-beater dividend blue-chip is down this much, it means two things. It’s either a great buying opportunity that comes along once every few years or it’s a sign the wheels have fallen off the bus.
Brad Thomas considers American Tower one of his top five REIT picks right now.
Let me show you why.
Why REITS Are Suffering, And Wall Street Is Wrong
The market likes to focus on one metric at a time and pretend that metric is all that matters. Interest rates have been that metric for over a decade.
Realty Income Corporation (O) is an excellent example of how interest rates are irrelevant to the profitability of a REIT.
Even when interest rates were as high as 7% in the 1990s, Realty could generate consistent and healthy investment spreads.
This is how all REITs work. Management borrows and sells shares to buy properties that it will rent out.
-
cap rate (cash yield) on property – cost of capital (borrowing cost, equity, and retained cash flow) = investment spread.
If you must obsess over one metric for REITs, it’s the investment spread.
Want proof that this is the metric that matters and interest rates are 100% irrelevant?
In the Volker era, 10-year yields hit 16%.
REITs were created in 1960 by Congress, and Realty Income was founded in 1969.
Realty was around and growing when rates were 16%. Its borrowing costs at the time were close to the 20% Fed funds rate.
Or how about Federal Realty Investment Trust (FRT)? That is the only dividend king in REITdom and was founded in 1962.
This Happened Despite 20% Borrowing Costs In 1981!
If interest rates are 0% and REITs like O and FRT are paying 5% cap rates (20X FFO) or interest rates are 20% and O and FRT are paying 25% cap rates and 4X FFO, the profitability of their businesses are the same.
That is what REIT investors often forget. Just like new income investors might forget that debt is 100% irrelevant.
-
rating agencies never worry about debt
-
debt/EBITDA, and interest coverage, and cash flow stability are what matter most.
Ratios are what matters, not individual metrics.
OK, so REITs are being unfairly punished…or the wheels might have come off AMT.
Let’s look under AMT’s hood to see if there are any signs that the thesis is broken. If not, it’s clear sailing to a substantial buy and potentially Buffett-like returns from a blue-chip bargain hiding in plain sight.
Did American Tower Make An Expensive Mistake Buying CoreSite?
At the end of 2021, AMT closed on the $10.1 billion acquisition of CoreSite, a leader in edge cloud computing.
Few people question that CoreSite is a great business; the question is, what valuation did AMT pay?
-
$343 million in annualized EBITDA at the time of closing
-
29.4X EBITDA.
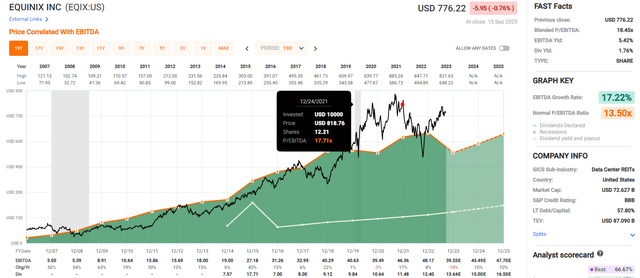
OK, so that seems like a high multiple. To check, let’s compare EQIX and DLR, the industry leaders.
FAST Graphs, FactSet
As you can see, at the end of 2021, data center REITs were the new hotness and trading at absurd valuations.
AMT appears to have bought the top of the bubble.
-
EQIX was trading at 18X EBITDA at the time
-
DLR was trading at 22X EBITDA
-
29.4X EBITDA was an absurd valuation.
OK, so AMT has overpaid and sold many bonds to do it and absorbed CoreSite’s debt.
Does that mean AMT put its balance sheet at risk?
AMT now has $39 billion in debt, which sounds like a lot. But debt on its own tells you nothing about balance sheet safety.
AMT is expected to have a debt/EBITDA ratio of 5.9 this year, and in 2024, that’s expected to fall to 5.6.
Rating agencies consider 6X or less leverage safe in the REIT sector, where cash flow is stable. Similarly, 2+ interest coverage is secure.
-
2.5X for AMT in the most recent quarter.
So no, AMT didn’t blow up its balance sheet, though paying almost 30X EBITDA for CoreSite is likely to prove poor timing.
Okay, but what about the entire balance sheet? Doesn’t S&P have a 1,000-metric risk management model that is fed into credit ratings? Yes, it does.
“Our ‘BBB-‘ issuer credit rating and stable outlook on American Tower are unchanged because the refinancing transaction is essentially leverage neutral and will help reduce its exposure to floating-rate debt. We expect the company to increase its U.S. organic tower billings by about 5% in 2023 on solid tower leasing activity and lower churn levels from Sprint tower site decommissions.
We also expect it will expand its organic tenant billings in the international segment by about 6.5%, slightly above our previous expectation of 5%, although its performance by the market will vary. We expect healthy 8% growth in Europe, bolstered by solid leasing trends and CPI-based escalators.
However, the Indian market continues to be challenging, and the company is reserving about $75 million in 2023 because of payment shortfalls from Vodafone Idea Ltd. and is currently looking to sell a stake in its India operations.
We also assume capital expenditures for its data center expansion, coupled with its high dividend payout as a REIT, will result in low levels of discretionary cash flow and keep its S&P Global Ratings-adjusted debt to EBITDA relatively flat, in the mid-to high-5x area but comfortably below our 6.5x downgrade threshold.” – S&P September 13th (emphasis added).
S&P last looked at American Tower during its latest bond issuance about one week ago.
It affirms the BBB- stable credit rating.
-
Moody’s BBB- equivalent stable
-
Fitch BBB+ negative outlook.
S&P and Moody’s estimate an 11% chance that AMT defaults on its debt, goes bankrupt, and its stock to zero.
Fitch estimates the risk at 5%.
So, there is no sign in the balance sheet that AMT is a value trap.
Rating agencies looked at AMT after its recent big deal and said the thesis is intact.
CoreSite was expensive, though it’s not likely a permanent mistake.
It’s a great, fast-growing business and could eventually make up a significant portion of AMT’s cash flow (currently about 5%).
OK, so AMT didn’t buy something stupid (though the price was likely stupid), and its balance sheet is still safe. What about a growth outlook? Could that have fallen off a cliff?
Long-Term Growth Outlook Is Just Fine
Currently, 21 analysts have a median long-term growth outlook of 13.3% annually.
-
6% to 14.3% range.
Despite its name, American Tower is a globally diversified telecom tower REIT.
It owns almost 2X as many towers in India as in the U.S.
Brazil alone has 23,000 towers and owns almost the same number of buildings in Latin America as in the U.S.
In total, it owns 226,00 towers, 81% outside the U.S.
And since the developing world is about ten years behind the U.S. on telecom infrastructure (at least), this gives AMT a firm and long growth runway
Let’s not forget how AMT makes its money. First, it builds or buys a tower, then leases up the buildings with a second, third, or even sometimes fourth tenant.
The return on investment for a single tower tenant is 3%. But once you get three tenants, it soars to 24%. That’s a 7X increase in profitability for something that stands there, has very little maintenance, and just mints cash at a gross margin of 83%.
The number of new connected devices in the U.S. is growing 7% annually through 2028 thanks to the Internet of Things.
Thanks to the insatiable hunger for video data per device, it grows 12.5% annually.
That’s 20% annual growth in data just in the U.S. through 2028.
And that’s just the U.S.
While the growth rates of most countries are similar to the U.S. (Mexico and Brazil data growth is 24%) those are growth rates that can be sustained for much longer, potentially for decades.
Okay, so the bottom end of that range might be a bit concerning…except AMT’s yield of 3.5% means that a 9.5% to 17.8% long-term total return range is on offer.
That’s very good for the REIT sector.
And as for AMT’s yield?
AMT’s yield is now at a record high of 3.5%. In the Pandemic, it only hit 2%.
If you don’t want to buy AMT today, you likely don’t want to own this business.
Fundamental Summary
-
Yield: 3.5%
-
Safety rating: 90% (1.5% risk of dividend cut)
-
Quality rating: 90% 13/13 low-risk Ultra SWAN
-
Growth consensus: 13.3%
-
LT total return potential: 16.6%
-
Fair value: $276.83
-
Current price: $180.46
-
Discount: 35%
-
DK Rating: Ultra Value Buy – Buffett-style “Fat Pitch”)
-
10-year valuation boost: 4.4% per year
-
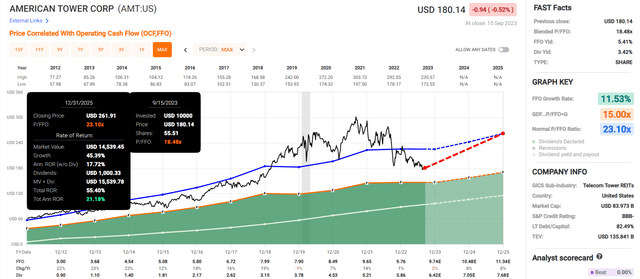
10-year consensus total return potential: 21.0% CAGR – Buffett-like returns for ten years = 573% vs 130% S&P.
FAST Graphs, FactSet
Even if AMT’s growth rate never surpasses the 8% expected in 2023 and 2024, AMT is still so undervalued at 18X funds from operations, or FFO, that it has Buffett-like 21% annual return potential through 2025.
-
6% for the S&P.
|
Rating |
Margin Of Safety For Low-Risk 13/13 Ultra SWAN Quality |
2023 Fair Value Price |
2024 Fair Value Price |
12-Month Forward Fair Value |
|
Potentially Reasonable Buy |
0% |
$268.80 |
$279.79 |
$276.83 |
|
Potentially Good Buy |
5% |
$255.36 |
$265.80 |
$262.99 |
|
Potentially Strong Buy |
15% |
$228.48 |
$237.82 |
$235.30 |
|
Potentially Very Strong Buy |
25% |
$191.52 |
$209.84 |
$207.62 |
|
Potentially Ultra-Value Buy |
35% |
$174.72 |
$181.86 |
$179.94 |
|
Currently |
$180.46 |
32.86% |
35.50% |
34.81% |
|
Upside To Fair Value (Including Dividends) |
52.43% |
58.52% |
56.88% |
AMT is pennies above its Ultra Value price.
As long as you’re comfortable with the risk profile, AMT is a fantastic buy.
Risk Profile: Why American Tower Isn’t Right For Everyone
There are no risk-free companies, and no company is suitable for everyone. You have to be comfortable with the fundamental risk profile.
Risk Summary
Our Morningstar Uncertainty Rating for American Tower is Medium. We are confident towers will be integral to telecommunications throughout our forecast, and American Tower will thrive, but the stock’s value is dependent on carriers needing to continue investing heavily in their macro towers. If there is ever an alternative to macro towers or the ability for carriers to rely on them less than they have historically, American Tower’s growth will suffer.
Greater use of small cells by carriers, which will be more prevalent with 5G, could affect tower demand, as could other technological advances that require less tower density for carriers. We believe towers will continue to be carriers’ most cost-effective option, especially in the ex-urban areas where American Tower more commonly resides, so we don’t think the risk is high. However, maturing 5G networks and less wireless spectrum for carriers to deploy should make high sales growth less reliable.
– Morningstar (emphasis added).
American Tower’s Risk Profile Includes
-
Disruption risk from changing technology standards
-
de-worsification/empire-building risk: Buying CoreSite at a hefty premium, possibly at the worst possible time
-
risk profile now includes the risk profile of data centers (disruption risk, cyber risk, weather risk, etc.)
How do we quantify, monitor, and track such a complex risk profile? By doing what big institutions do.
Long-Term Risk Management Analysis: How Large Institutions Measure Total Risk Management
DK uses S&P Global’s global long-term risk-management ratings for our risk rating.
-
S&P has spent over 20 years perfecting its risk model
-
which is based on over 30 major risk categories, over 130 subcategories, and 1,000 individual metrics
-
50% of metrics are industry-specific
-
this risk rating has been included in every credit rating for decades.
The DK risk rating is based on the global percentile of a company’s risk management compared to 8,000 S&P-rated companies covering 90% of the world’s market cap.
American Tower Scores 71st Percentile On Global Long-Term Risk Management
S&P’s risk management scores factor in things like:
-
supply chain management
-
crisis management
-
cyber-security
-
privacy protection
-
efficiency
-
R&D efficiency
-
innovation management
-
labor relations
-
talent retention
-
worker training/skills improvement
-
customer relationship management
-
climate strategy adaptation
-
corporate governance
-
brand management.
American Tower’s Long-Term Risk Management Is The 206th Best In The Master List (59th Percentile In The Master List)
|
Classification |
S&P LT Risk-Management Global Percentile |
Risk-Management Interpretation |
Risk-Management Rating |
|
BTI, ILMN, SIEGY, SPGI, WM, CI, CSCO, WMB, SAP, CL |
100 |
Exceptional (Top 80 companies in the world) |
Very Low Risk |
|
Strong ESG Stocks |
86 |
Very Good |
Very Low Risk |
|
Foreign Dividend Stocks |
77 |
Good, Bordering On Very Good |
Low Risk |
|
Ultra SWANs |
74 |
Good |
Low Risk |
|
American Tower |
71 |
Good |
Low Risk |
|
Dividend Aristocrats |
67 |
Above-Average (Bordering On Good) |
Low Risk |
|
Low Volatility Stocks |
65 |
Above-Average |
Low Risk |
|
Master List average |
61 |
Above-Average |
Low Risk |
|
Dividend Kings |
60 |
Above-Average |
Low Risk |
|
Hyper-Growth stocks |
59 |
Average, Bordering On Above-Average |
Medium Risk |
|
Dividend Champions |
55 |
Average |
Medium Risk |
|
Monthly Dividend Stocks |
41 |
Average |
Medium Risk |
(Source: DK Research Terminal.)
Realty Income’s risk-management consensus is in the top 46% of the world’s highest quality companies and similar to that of such other blue-chips as
-
Hormel Foods (HRL): Ultra SWAN dividend king
-
Enterprise Products Partners (EPD) (uses K-1 tax form): Ultra SWAN dividend champion
-
Procter & Gamble (PG): Ultra SWAN dividend king
-
Parker-Hannifin (PH): Ultra SWAN dividend king
-
NIKE (NKE): Ultra SWAN.
The bottom line is that all companies have risks, and MPLX is average at managing theirs, according to S&P.
How We Monitor American Tower’s Risk Profile
-
21 analysts
-
two credit rating agencies
-
23 experts who collectively know this business better than anyone other than management
“When the facts change, I change my mind. What do you do, sir?”
– John Maynard Keynes.
There are no sacred cows. Wherever the fundamentals lead, we always follow. That’s the essence of disciplined financial science, the math behind retiring rich and staying rich in retirement.
Bottom Line: Buy American Tower Today For A Rich Retirement Tomorrow
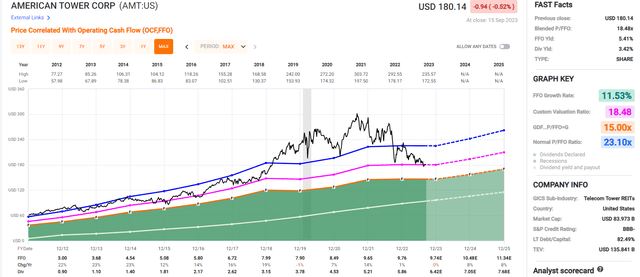
FAST Graphs, FactSet
In the last decade, American Tower has never failed to bottom close to the current FFO.
There is a 90% statistical probability that this is very close to the bottom. That doesn’t necessarily mean the price will skyrocket higher immediately, but it does mean that the chances of AMT achieving a yield of 4%, 4.5%, or 5% are very small.
Few REITs have such an obvious path towards decades of strong growth as American Tower.
Its global reach, access to $8.3 billion in liquidity, and adaptable management team, with its proven risk management record, are all reasons this Ultra SWAN, at a 35% historical discount, is a Buffett-style, table-pounding “fat pitch.”
One that is currently offering the highest yield in its history. That’s why it’s the best time ever to buy American Tower today for a rich retirement tomorrow.
Analyst’s Disclosure: I/we have a beneficial long position in the shares of AMT either through stock ownership, options, or other derivatives. I wrote this article myself, and it expresses my own opinions. I am not receiving compensation for it (other than from Seeking Alpha). I have no business relationship with any company whose stock is mentioned in this article.
Note: Brad Thomas is a Wall Street writer, which means he's not always right with his predictions or recommendations. Since that also applies to his grammar, please excuse any typos you may find. Also, this article is free: Written and distributed only to assist in research while providing a forum for second-level thinking.
Seeking Alpha’s Disclosure: Past performance is no guarantee of future results. No recommendation or advice is being given as to whether any investment is suitable for a particular investor. Any views or opinions expressed above may not reflect those of Seeking Alpha as a whole. Seeking Alpha is not a licensed securities dealer, broker or US investment adviser or investment bank. Our analysts are third party authors that include both professional investors and individual investors who may not be licensed or certified by any institute or regulatory body.
Sign Up For A FREE 2-Week Trial
Join iREIT on Alpha today to get the most in-depth research that includes REITs, mREIT, Preferreds, BDCs, MLPs, ETFs, Builders, Asset Managers, and we added Prop Tech SPACs to the lineup.
We recently added an all-new Ratings Tracker called iREIT Buy Zone to help members screen for value. Nothing to lose with our FREE 2-week trial.
And this offer includes a 2-Week FREE TRIAL plus my FREE book.

