Summary:
- With the tightening capital market and dilutive/debt-laden nature of REITs in general, it is unsurprising that AMT has similarly lost -43% of its value since the August 2021 top.
- For example, AMT still reports elevated long-term debts of $35.58B, with the expanding weighted average interest rate contributing to the increase in its annualized interest expenses to $1.39B.
- Then again, the management has moderately raised its FY2023 property revenue guidance to $10.88B (+3.9% YoY), adj EBITDA to $6.99B (+6.5% YoY), and AFFO per share to $9.70 (inline YoY).
- AMT’s FWD AFFO Payout Ratio of 65.42% and interest coverage of 2.72x remains well below the sector median of 74.77% and 1.83x, respectively.
- Based on the stock’s lower highs and lower lows, we recommend an entry point at its previous support levels of $150s for an improved margin of safety.

z1b
The REIT Investment Thesis Remains Speculative, As Interest Rates Are Still Elevated
We previously discussed American Tower (NYSE:AMT) in November 2022, discussing the stock’s overly aggressive rally then, attributed to the growing demand for data center capacity and the segment’s high growth cadence.
We believed that the Fed’s sustained rate hike might eventually hurt the REIT’s profitability, due to the growing debt levels and elevated interest rate environment. We had also anticipated a drastic correction from those lofty levels, resulting in our Hold (Neutral) rating then.
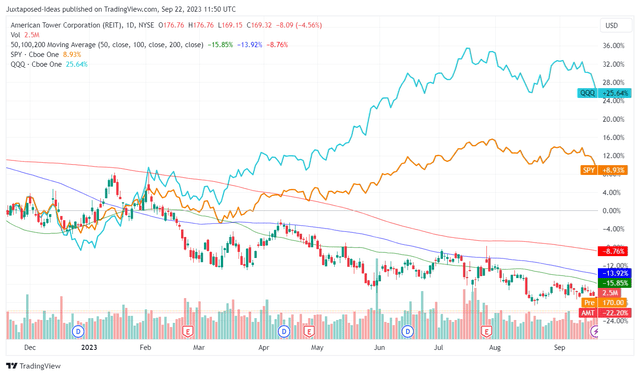
AMT 1Y Stock Returns

Trading View
Since then, the AMT stock has unfortunately retraced by -22.20%, naturally underperforming against the wider market, the SPY at +8.93% and the tech sector, the QQQ at +25.64%.
Unsurprisingly, part of the pessimism is attributed to the Fed’s sustained rate hike since March 2022, with the Federal Fund rate currently between 5.25% and 5.50%.
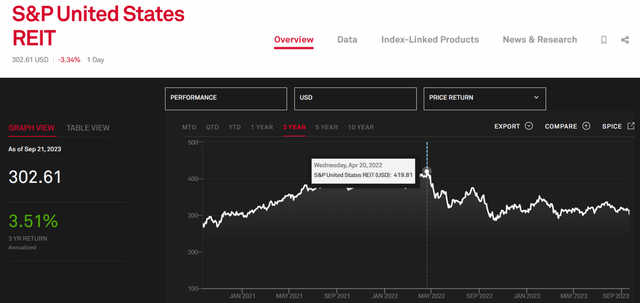
S&P US REIT

S&P US REIT
With the tightening capital market and the dilutive/debt-laden nature of REITs in general, it is unsurprising that most REIT stocks have also been impacted, with the S&P US REITs similarly moderating by -27.9% since April 2022.
For example, AMT still reports elevated long-term debts of $35.58B (+2.5% QoQ/ -4.4% YoY) by the latest quarter, with the expanding weighted average interest rate (unspecified) contributing to the increase in its annualized interest expenses to $1.39B (+2.3% QoQ/ +25.8% YoY).
Based on the REIT’s disclosure in the recent 10K, a hypothetical increase of interest rates by +10% may trigger an increase in its annualized interest expense increase by $33.8M.
Therefore, while the AMT management has attempted to reduce its exposure to variable debts to $6B, or the equivalent of 14.6% of its overall debts by the latest quarter (-6 points QoQ), it is unsurprising that market analysts are increasingly bearish on its future prospects.
This is especially since the Fed now expects a prolonged path towards a normalized inflation rate of 2% by early 2026, implying at least ten more quarters of profit headwinds.
Thanks To The Raised Guidance & Dividend Payout, AMT’s Profit Prospects Appear Decent For Now
Then again, we have already seen AMT record an impressive FQ2’23 double beat, with property revenues of $2.72B (+0.5% QoQ/ +2% YoY) and AFFO of $2.46 (-3.1% QoQ/ -1.9% YoY).
Investors may want to note that the profitability headwind is naturally attributed to the growing interest expenses, as discussed above, and the increased share count to 466.98M (+0.17M QoQ/ +7.16M YoY).
In addition, AMT has moderately raised its FY2023 property revenue guidance to $10.88B (+3.9% YoY), adj EBITDA to $6.99B (+6.5% YoY), and AFFO per share to $9.70 (inline YoY).
These suggest the strength of telecom and data center demand, especially with the raised FY2023 organic tenant billings growth of >5.5% globally, compared to the previous outlook of >5% and 2022 levels of >3%.
It is also important to note that while data center only comprise $204.9M or the equivalent of 7.3% of AMT’s overall revenues, the segment reports an excellent growth cadence of +1% on a QoQ basis and +7.2% on a YoY basis.
This is compared to the REIT’s telecom segment revenues of $2.56B at inline QoQ and +3.2% YoY.
Combined with the +9% YoY growth in the Data Center’s operating profit in H1’23, we can understand why the management has intensified the segment’s capex to $360M (+20% YoY) in FY2023, with the” robust generative AI demand outstripping supply.”
AMT’s Dividend Safety

Seeking Alpha
While the Seeking Alpha Quant may rate AMT’s overall dividend safety as C, we are not overly concerned, since its FWD AFFO Payout Ratio of 65.42% remains well below the sector median of 74.77%.
Most importantly, the management has just raised the quarterly dividends by +3.2% to $1.62 as well, well exceeding the previous hike by +0.6%. This suggests the management’s confidence of sustaining the dividend payouts, while generating a robust interest coverage of 2.72x compared to the sector median of 1.83x.
So, Is AMT Stock A Buy, Sell, or Hold?
AMT Valuations

Seeking Alpha
Based on the AMT management’s FY2023 AFFO per share guidance and its FWD Price/ AFFO valuation, we are looking at a fair value of $167.90, nearing its current stock prices.
Based on the consensus FY2025 AFFO estimates of $11.51, it appears that there is still a decent upside potential of +17.6% from our long-term price target of $199.23.
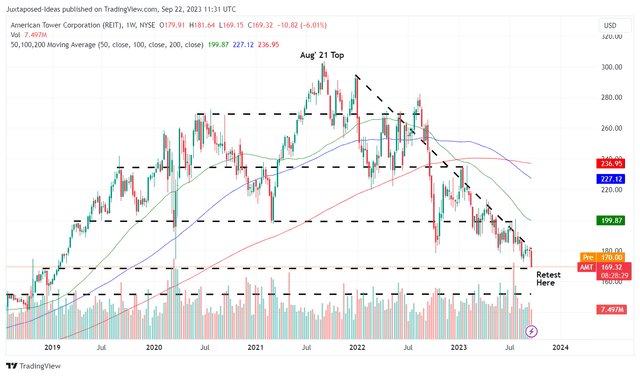
AMT 5Y Stock Price

Trading View
Then again, the AMT stock has also returned much of its hyper-pandemic gains to retest the 2019 support levels of $160s, drastically losing -43% of its value since the August 2021 top of $298.39.
Based on the stock’s lower highs and lower lows since then, we may see these levels breached in the near term, potentially retesting its next support levels of $150, implying a downside of -11.2%.
Those levels may also unlock an expanded forward dividend yield of 4.32%, based on the annualized payout per share of $6.48 in October 2023. This is compared to the 4Y average yield of 2.13%, nearer to the sector median of 5.13%.
As a result of the attractive risk/ reward ratio, we are cautiously rating the AMT stock as a Buy, with a recommended entry point of $150s, depending on an individual investor’s dollar cost average and risk tolerance.
Analyst’s Disclosure: I/we have no stock, option or similar derivative position in any of the companies mentioned, and no plans to initiate any such positions within the next 72 hours. I wrote this article myself, and it expresses my own opinions. I am not receiving compensation for it (other than from Seeking Alpha). I have no business relationship with any company whose stock is mentioned in this article.
The analysis is provided exclusively for informational purposes and should not be considered professional investment advice. Before investing, please conduct personal in-depth research and utmost due diligence, as there are many risks associated with the trade, including capital loss.
Seeking Alpha’s Disclosure: Past performance is no guarantee of future results. No recommendation or advice is being given as to whether any investment is suitable for a particular investor. Any views or opinions expressed above may not reflect those of Seeking Alpha as a whole. Seeking Alpha is not a licensed securities dealer, broker or US investment adviser or investment bank. Our analysts are third party authors that include both professional investors and individual investors who may not be licensed or certified by any institute or regulatory body.
