Summary:
- WMT’s investment thesis remains robust, attributed to its market leading dollar share of 30.3% as of August 2023, easily eclipsing its competitors.
- Its comparable sales continue to outperform expectations, well-exceeding the hyper-pandemic/pre-pandemic trends, despite the rising inflation and elevated interest rate environment.
- Its well-diversified offerings across retail/e-commerce and advertising segments have also demonstrated a high YoY growth cadence as of FQ2’24.
- WMT has been a shareholder-friendly stock as well, offering a robust mix of capital appreciation and dividend income, thanks to the growing FCF generation.
- While the stock appears to be retesting its previous resistance, investors may still add accordingly.
Yurii Kifor
The WMT Investment Thesis Remains Robust
Walmart (NYSE:WMT) is a stock that requires no introductions, due to its growing eCommerce presence, large retail footprint with over 4K outlets in the US, and over 10.5K outlets globally.
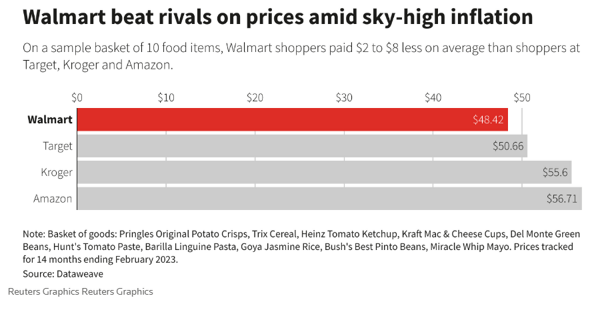
WMT Beats Rivals On Prices
Reuters
Most importantly, thanks to its improved affordability and competitively priced offerings, it is unsurprising that WMT has reported excellent growth in groceries sales.
The retailer’s FQ2’24 performance has highlighted a similar uptrend for the US net sales in the grocery category at $66.24B (+4.4% QoQ/ +7.7% YoY), comprising the lion’s share of its overall sales at 59.7% (-1.3 points QoQ/ +1.3 YoY).
For context, we have also compiled the grocery (perishables/ consumables) share of other retailers, with Target (TGT) at 22.1%, Costco (COST) at 54.1%, Kroger (KR) unspecified, Albertsons (ACI) at 82.9%, and Dollar Tree (DLTR) at 48.5%.
While these numbers suggest that grocery products are commonly offered in many other retailers, it is apparent that WMT is the preferred choice for many value-driven consumers.
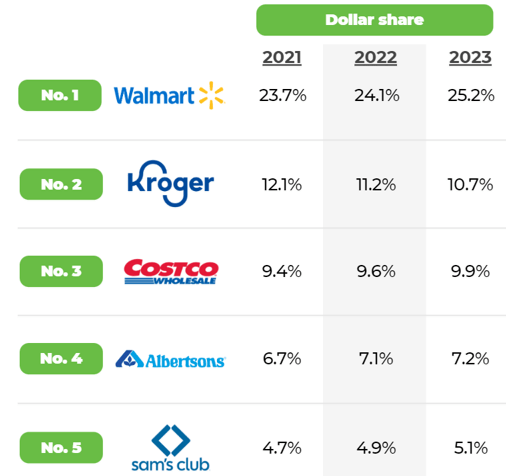
WMT’s Growing Dollar Share
Winsight Grocery Business
These factors have led to WMT’s growing dollar share in the Food Retailer segment at 25.2% (+1.1 points YoY) as of August 2023, or at 30.3% (+1.3 points YoY) if we are to include Sam’s Club, based on the Winsight Grocery Business data.
This is on top of WMT’s market leading share of 42% in the US brick and mortar retailers.
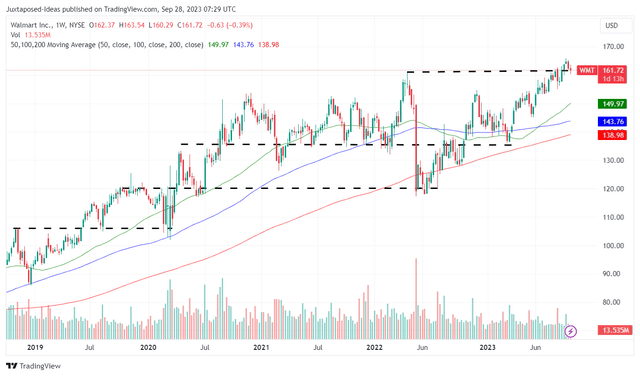
WMT 1Y/ 5Y Stock Performance
With the retailer’s dollar share well-eclipsing its competitors, implying its outperformance compared to its grocery/ retailer peers, it is natural that the WMT stock has recorded an impressive performance over the past year and five years.
This trend is especially notable since the start of 2023, with Mr. Market likely concerned about the effect of the moderating inflation and the restart of the federal student loan repayment from October 2023 onwards.
These headwinds are major concerns indeed, since many retailers, including WMT, have been able to hike prices to match the rising labor costs/ energy prices, naturally contributing to its impressive top and bottom line performance.
However, the industry-wide disinflation may trigger a notable shift in consumer spending toward general merchandise, on top of the potentially lowered prices across its offerings, similarly highlighted by WMT in the Goldman Sachs 30th Annual Global Retailing Conference:
The more disinflation happens in categories like dry grocery and consumables, the more discretionary income they have to buy general merchandise, so we may see mix shifts… So we’re looking for the opportunity to drive rollbacks, but when that all plays out we end-up with about the same price gap and about the same margin structure on the income statement side. (Seeking Alpha)
Then again, WMT continues to report excellent growth in comparable sales at +6.4% in FQ2’24, despite the uncertain macroeconomic outlook.
This number suggests a high growth cadence compared to
+7.4% in FY2023 (CY2022), +1.4% in FY2022 (CY2021), and +7.8% in FY2021 (CY2020), and a normalized level of +2.7% in FY2020 (CY2019).
In addition, WMT has recorded a double beat on the top and bottom line in the latest quarter, with revenues of $161.63B (+6.1% QoQ/ +5.7% YoY) and adj EPS of $1.84 (+25.1% QoQ/ +3.9% YoY).
The latter is likely attributed to the retailer’s emphasis on profitable gross margins of 24.6% (+0.3 points QoQ/ +0.4 YoY), remaining stable over the past three years, inline with FY2019 levels of 24.7% (-0.4 points YoY).
These numbers indicate that WMT has yet to embark on aggressive price actions, despite the elevated inventory levels of $56.72B (inline QoQ/ -5.3% YoY), compared to FY2019 levels of $44.43B (inline YoY).
The same unfortunately can not be said about its peers, such as TGT, which has had to drastically cut prices over the past few quarters, moderating its gross profits to ~22% compared to the hyper-pandemic/ pre-pandemic averages of ~30%.
For now, despite the unsold inventories, WMT’s net cash levels remain excellent at -$24.98B (+16% QoQ/ -40.4% YoY) by the latest quarter, compared to FY2019 levels of -$34.95B (+3.5% YoY), implying its more than healthy balance sheet.
While the student loan repayment may temporarily tighten discretionary spending, we are not overly concerned, since food and household products are staples no matter the cyclical economic condition.
This is further demonstrated by the strength of WMT’s omnichannel offerings, including US e-commerce at +24% YoY, with the management likely to further grow its global advertising business from the +35% YoY reported in FQ2’24.
Investors may also want to note the retailer’s profitable growth cadence in the international segment, with revenues of $27.59B (+3.7% QoQ/ +13.3% YoY) and operating income of $1.19B (+2.5% QoQ/ +14.4% YoY).
As a result of its well-diversified global offerings likely to counter the temporal headwinds, we believe the optimism embedded in WMT’s stock prices is warranted, mirroring its financial outperformance compared to its peers.
This is significantly aided by the excellent FY2024 guidance offered by the WMT management, with a revenue growth of +4.25% YoY and adj EPS of +1.9% YoY at the midpoint, compared to FY2022 growth cadence of +6.7% and -2.6%, respectively.
So, Is WMT Stock A Buy, Sell, or Hold?
WMT Valuations
And it is for these reasons that the WMT stock continues to command premium valuations compared to the sector medians, continuing the same cadence as it has over the past five years.
Based on its FWD P/E of 25.08x and the consensus FY2026 adj EPS estimates of $7.86, we believe that there is still an excellent upside potential of +21.8% to our long-term price target of $197.12.
WMT 5Y Stock Price
While past performance may not be indicative of future results, the WMT stock has also generated an excellent return of +69.45% over the past five years, compared to the SPY at +46.55%.
While it may offer a minimal forward dividend yield of 1.40% and 5Y dividend growth CAGR of +1.86%, comparatively lower than the sector median of 2.71% and +5.48%, respectively, the stock has offered impressive 5Y total returns of +84.45% as well, compared to the wider market at +59.31%.
We also believe that WMT has been a shareholder friendly stock thus far, thanks to the robust Free Cash Flow of $19.22B over the last twelve months (+254.6% sequentially).
The excellent profitability has allowed the management to return $47.34B to its long-term shareholders since the start of the pandemic, while retiring 152M of shares.
As a result of the great balance between capital returns and dividend income, we are rating the WMT stock as a Buy, as a great addition to most discerning investors’ well-diversified portfolios.
Naturally, we must also offer a note of warning to prospective investors, since the stock is currently retesting its previous April 2022 resistance level of $160s, potentially triggering further volatility in the near term
As a result, investors may want to wait for a moderate retracement before adding, preferably at the previous support levels of $140s for an improved margin of safety.
Analyst’s Disclosure: I/we have a beneficial long position in the shares of COST either through stock ownership, options, or other derivatives. I wrote this article myself, and it expresses my own opinions. I am not receiving compensation for it (other than from Seeking Alpha). I have no business relationship with any company whose stock is mentioned in this article.
The analysis is provided exclusively for informational purposes and should not be considered professional investment advice. Before investing, please conduct personal in-depth research and utmost due diligence, as there are many risks associated with the trade, including capital loss.
Seeking Alpha’s Disclosure: Past performance is no guarantee of future results. No recommendation or advice is being given as to whether any investment is suitable for a particular investor. Any views or opinions expressed above may not reflect those of Seeking Alpha as a whole. Seeking Alpha is not a licensed securities dealer, broker or US investment adviser or investment bank. Our analysts are third party authors that include both professional investors and individual investors who may not be licensed or certified by any institute or regulatory body.


