
Summary:
- Netflix has seen a remarkable 109% surge since its 2022 lows, driven by factors such as the resolution of subscriber declines in early 2022.
- Three Discounted Cash Flow models indicate that Netflix could unlock substantial value if it achieves a 62% adoption of ad-enabled plans, potentially resulting in a high annual return of.
- The possibility of Disney relicensing its content could further boost Netflix’s growth, ensuring a broad and appealing content library.
- While subscriber growth remains a key risk, even with a 50% overestimation of estimates, Netflix continues to be a “strong buy” with a decent annual return of around 24.4%.

PM Images
Thesis
Netflix, Inc. (NASDAQ:NFLX) has experienced a remarkable 109% surge following a substantial 73% decline that began in November 2021. This shift can be attributed primarily to its high valuation and a decline in subscriber growth. In this article, I will elucidate the potential worth of Netflix if they can successfully encourage people to embrace ad-enabled subscriptions.
Two valuations are presented here, the first assuming a revenue growth rate of 8.75%, which aligns with analysts’ consensus, and the second based on a revenue growth rate of 12.66%, reflecting the forecasted streaming market revenue growth. These valuations highlight that Netflix’s current value aligns closely with normal expectations.
In my perspective, Netflix is a strong buy, as it represents a compelling opportunity if they can generate significant revenue from advertisements, which would contribute almost entirely to their profit margins. Even if you were to halve my estimates, the stock still has the potential to yield a robust annual return of 24.4%.
Overview
Streaming Market Forecasts
It’s well-established that Pay-TV is losing its foothold to streaming services. People are spending less and less time watching traditional television, this is a trend you can see in the US, Europe, Latin America, in almost all the world.
In my view, this trend can be attributed to several factors, most of which revolve around the aspect of time. Why tune in to watch the news at a scheduled time when you can access it almost in real-time through the CNBC app? Why rely on TV channels for movies when streaming platforms like Netflix offer a vast library of content? Furthermore, why subscribe to a TV service that often incurs a higher cost than popular streaming options like Netflix or Disney+?
It’s worth noting that the global streaming market is projected to experience a robust Compound Annual Growth Rate [CAGR] of 12.66% from 2023 to 2027. This substantial growth rate also leaves room for Netflix to sustain its current pace, given that its forward revenue growth rate stands at approximately 8.75%.
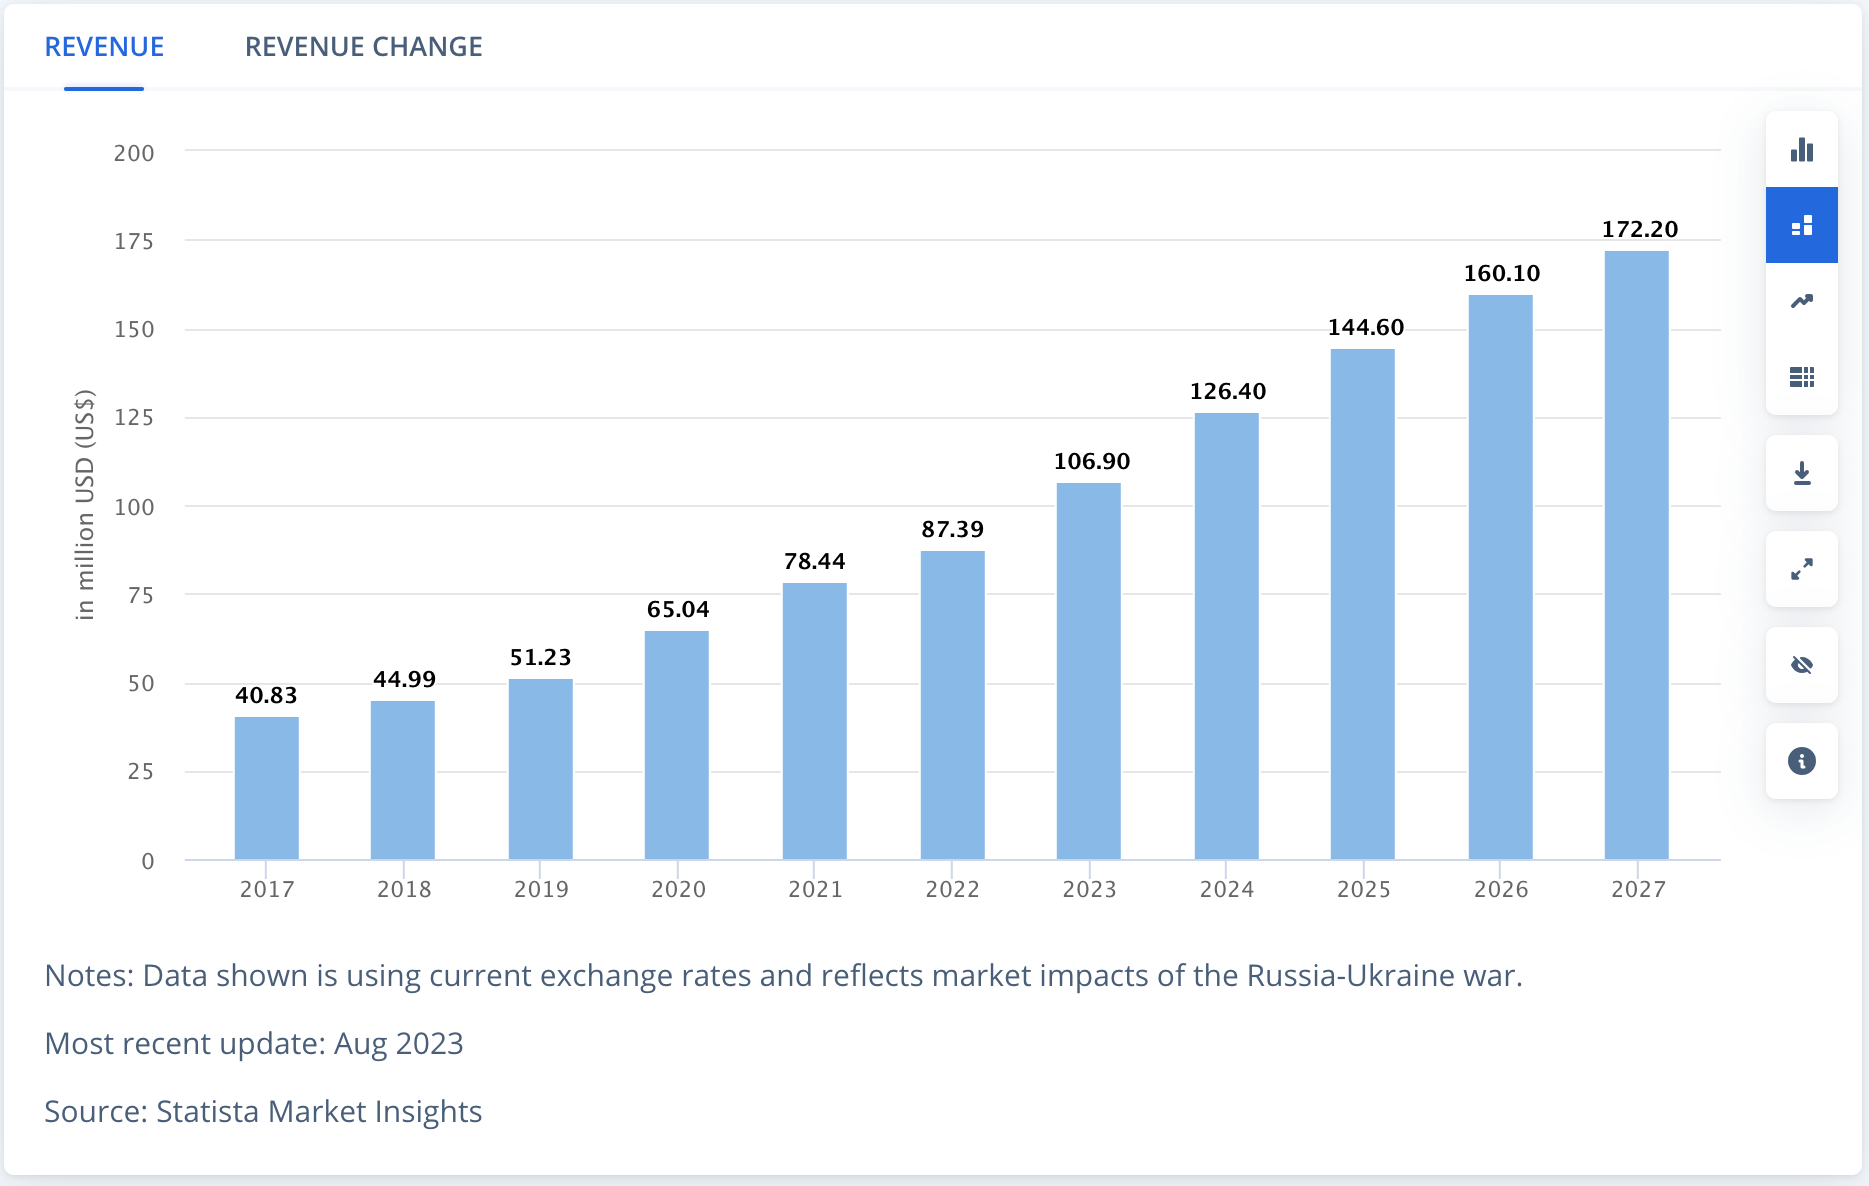
Worldwide streaming market revenue forecasts (Statista)
Password-Sharing Crackdown
It is estimated that password sharing impacts a staggering 100 million passwords. This figure is notably significant because it suggests a vast number of individuals who share their login credentials. It’s important to recognize that password sharing doesn’t solely involve two individuals; it often extends to multiple family members, encompassing 3, 4, or even 5 people sharing a single account.
To put this in monetary terms, let’s assume that each of these 100 million passwords is shared with just one non-household member. This scenario results in 100 million non-paying users. If Netflix were to charge $7.99 for creating an additional slot for each non-household member, the potential revenue generated could amount to $799 million. However, it’s essential to note that this figure represents only approximately 2% of Netflix’s total revenue, making it a relatively modest contribution.
Financials
Netflix stands as a pioneering force in the world of streaming, being one of the first companies to adopt this model. Its legendary takedown of Blockbuster is well-documented, and this success narrative contributed to the remarkable annual revenue growth Netflix witnessed. As the table below illustrates, from 2017 to 2021, Netflix enjoyed a consistent 30% growth rate. However, the landscape of this industry has evolved as it consolidated, with new entrants like Amazon, Inc. (AMZN), The Walt Disney Company (DIS), and Paramount Global (PARA) intensifying the competition. This has sparked price wars and content battles, exemplified when Disney+ was announced. The implication was clear: Disney’s content, including Marvel, Star Wars, and Disney movies, would no longer be available on Netflix. Disney holds a substantial advantage in this regard, while Netflix must continue to develop its own content and gauge its market acceptance, however as Disney gets desperate for more money, they have, Bob Iger has said that “hoarding our content was not so valuable“.
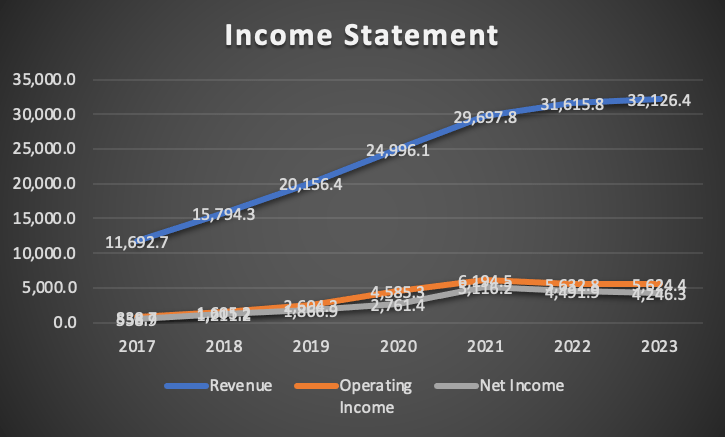
Author’s Calculations
Nonetheless, this does not equate to poor margins. Netflix maintains healthy margins, with both operating and net income margins exceeding 12%. Although these figures have dipped from their peak, they remain notably strong.
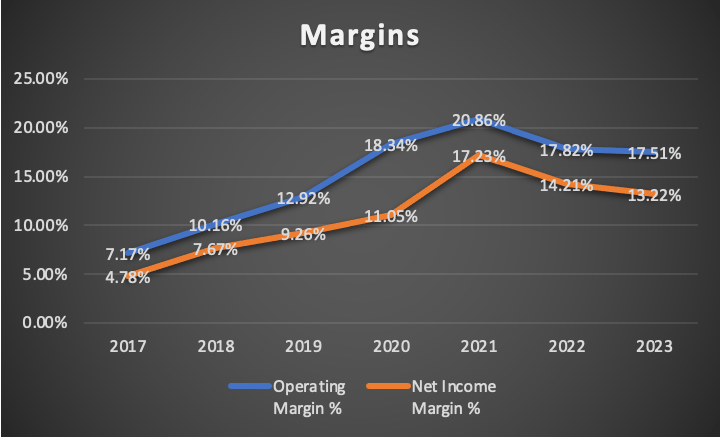
Author’s Calculations
Netflix’s financial position is reasonably sound. Long-term debt has been steadily decreasing, while short-term debt has remained relatively stable. The company boasts substantial cash reserves, enough to cover approximately 50% of its long-term debt obligations.
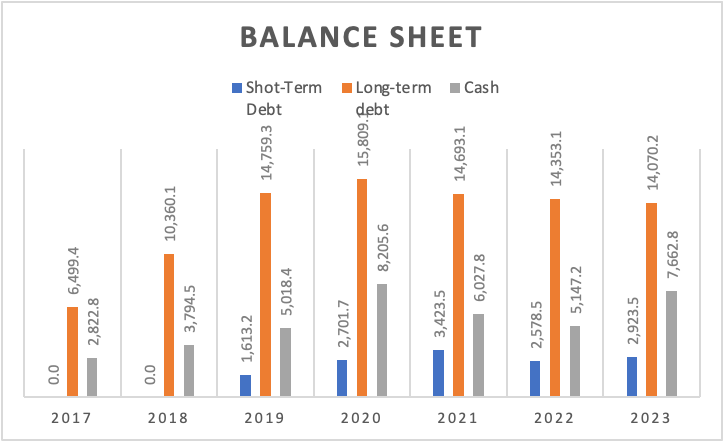
Author’s Calculations
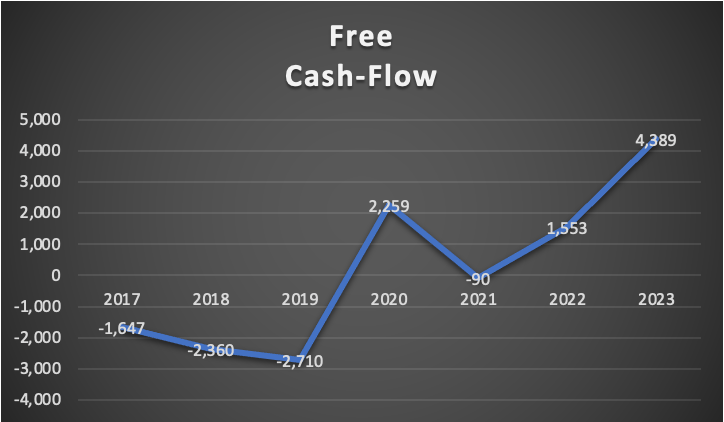
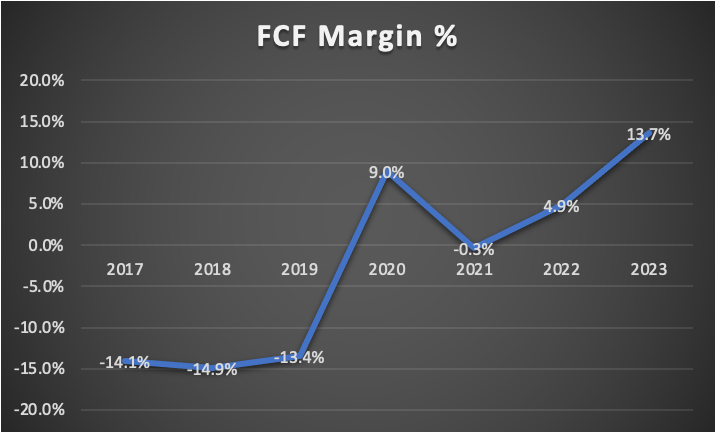
The standout consideration is free cash flow. Before 2020, Netflix experienced negative free cash flow, and in 2021, a minor deficit of $90 million was recorded. Currently, free cash flow stands at a robust $4.3 billion, with a corresponding FCF margin of 13.7%, a substantial improvement from the 4.9% seen in 2022.
Author’s Calculations
Author’s Calculations
Valuation
To conduct this valuation, I’ll employ three discounted cash flow [DCF] models. The first model will utilize Netflix’s expected forward revenue growth rate, as found on Seeking Alpha, which stands at 8.75%. The second model will be based on a revenue growth rate of 12.66%, reflecting the expected growth rate for the worldwide streaming market. Finally, the third model will be based on my own expectations on how much money could Netflix earn from advertisements and password-sharing crackdown.
To initiate this analysis, I’ve gathered all the current financial data for Netflix on a trailing twelve-month [TTM] basis. This dataset will aid in the calculation of the Weighted Average Cost of Capital [WACC]. Notably, I have endeavored to project Depreciation and Amortization [D&A] as well as Interest expenses, with their margins intricately linked to revenues.
The use of these three distinct models should provide a comprehensive perspective on Netflix’s valuation, considering different growth scenarios and potential revenue streams.
| TABLE OF ASSUMPTIONS | |
| (Current data) | |
| Assumptions Part 1 | |
| Equity Value | 22,832.20 |
| Debt Value | 16,993.70 |
| Cost of Debt | 4.07% |
| Tax Rate | 11.71% |
| 10y Treasury | 4.80% |
| Beta | 1.1 |
| Market Return | 10.50% |
| Cost of Equity | 11.07% |
| Assumptions Part 2 | |
| EBIT | |
| Tax | 563.10 |
| D&A | 358.30 |
| CapEx | 359.50 |
| Capex Margin | 1.12% |
| Assumption Part 3 | |
| Net Income | 4,246.30 |
| Interest | 692.00 |
| Tax | 563.10 |
| D&A | 358.30 |
| Ebitda | 5,859.70 |
| D&A Margin | 1.12% |
| Interest Expense Margin | 2.15% |
| Revenue | 32,126.4 |
Base scenario 8.75% Revenue Growth Rate
This serves as the baseline scenario, where the projection is constructed based on Netflix’s anticipated revenue growth rate and the expected EPS growth rate of 22.68%.
| Revenue | Net Income | Plus Taxes | Plus D&A | Plus Interest | |
| 2023 | $33,730.0 | $3,730.09 | $4,166.82 | $4,543.00 | $5,269.55 |
| 2024 | $38,170.0 | $4,576.07 | $5,111.85 | $5,488.04 | $6,214.58 |
| 2025 | $41,509.9 | $5,613.93 | $6,271.22 | $6,734.17 | $7,628.29 |
| 2026 | $45,142.0 | $6,887.16 | $7,693.54 | $8,197.00 | $9,169.35 |
| 2027 | $49,091.9 | $8,449.17 | $9,438.43 | $9,985.94 | $11,043.38 |
| 2028 | $53,387.5 | $10,365.45 | $11,579.07 | $12,174.49 | $13,324.45 |
| ^Final EBITA^ |
| D&A Projection | Interest Projection | |
| 2023 | 376.185 | 726.54 |
| 2024 | 376.185 | 726.54 |
| 2025 | 462.952 | 894.12 |
| 2026 | 503.461 | 972.35 |
| 2027 | 547.513 | 1,057.44 |
| 2028 | 595.421 | 1,149.96 |
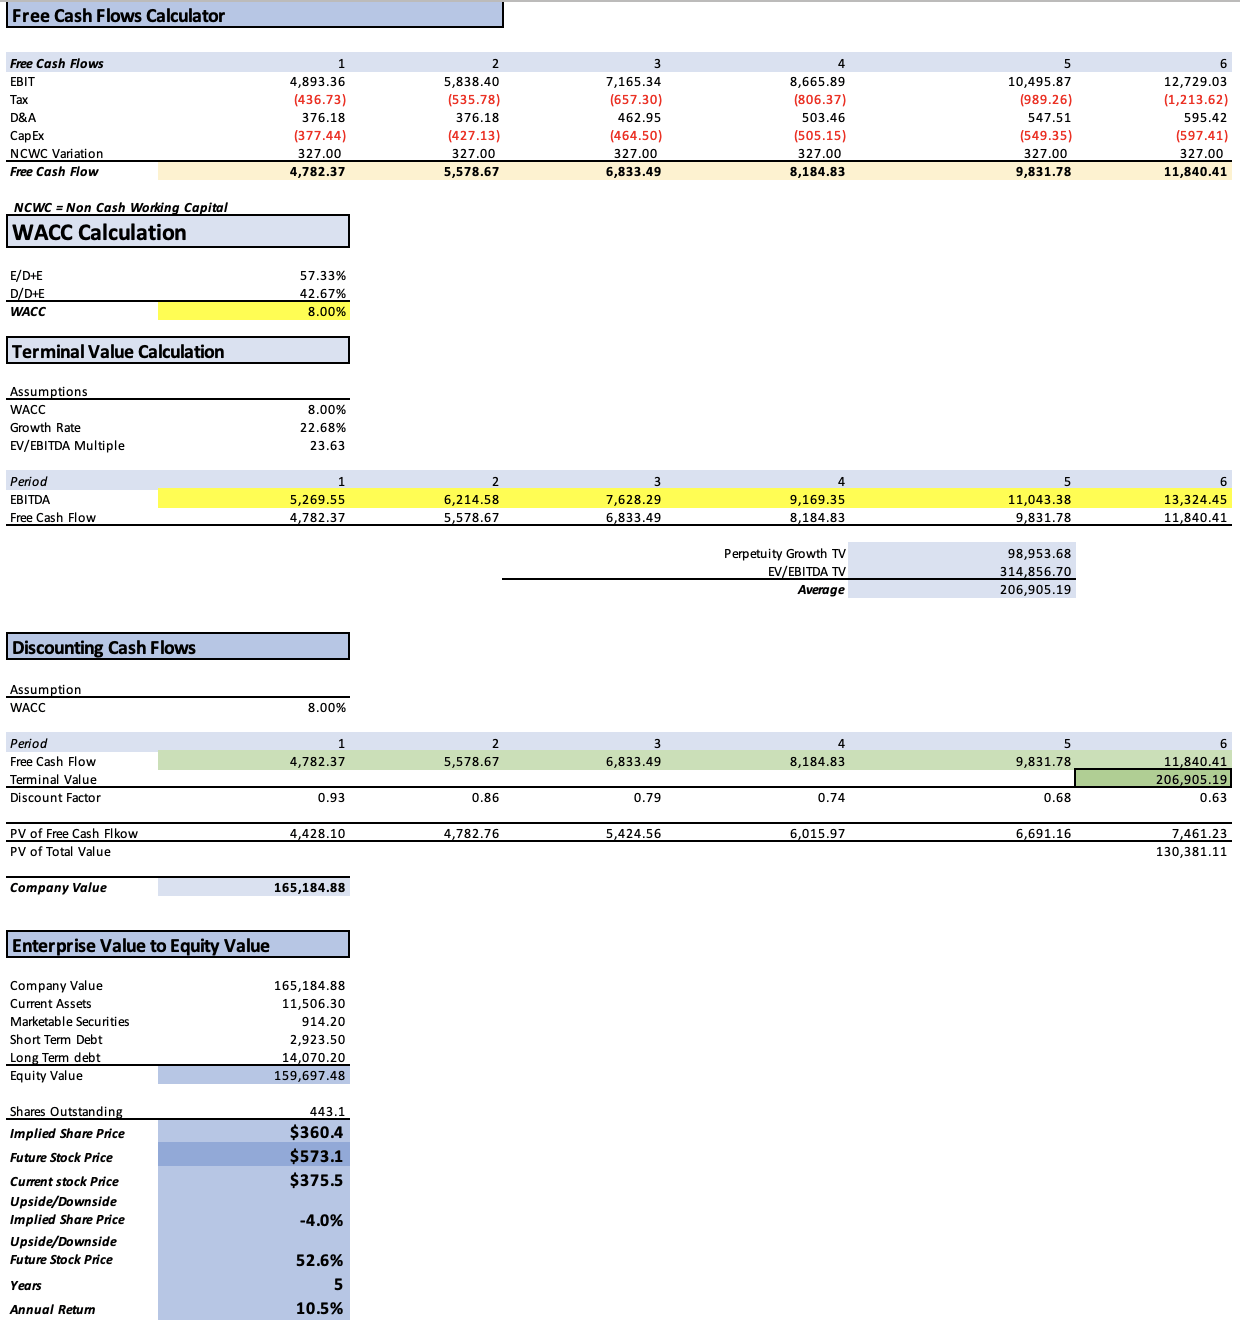
DCF 1 (Author’s Calculations)
In this initial scenario, the fair value of Netflix is estimated at $360.4, reflecting a 4% decrease from the current stock price of $375.5. The projected future stock price of $573.1 implies an annual return of 10.5%, which, in context, appears relatively low. This prompts consideration regarding the viability of opening a position in Netflix, given the relatively modest expected return.
12.66% Revenue Growth Scenario
In this scenario, titled as such, we explore the possibility of Netflix achieving revenue growth at a rate of 12.66%. Net income will correspondingly increase in line with the net income margins from the previous valuation model.
| Revenue | Net Income | Plus Taxes | Plus D&A | Plus Interest | |
| 2023 | $33,730.0 | $3,730.09 | $4,166.82 | $4,543.00 | $5,269.55 |
| 2024 | $38,170.0 | $4,576.07 | $5,111.85 | $5,488.04 | $6,214.58 |
| 2025 | $43,002.3 | $5,815.77 | $6,496.70 | $6,976.30 | $7,902.56 |
| 2026 | $48,446.4 | $7,134.79 | $7,970.15 | $8,510.46 | $9,554.00 |
| 2027 | $54,579.7 | $9,393.68 | $10,493.52 | $11,102.24 | $12,277.88 |
| 2028 | $61,489.5 | $13,404.72 | $14,974.18 | $15,659.97 | $16,984.45 |
| ^Final EBITA^ |
| D&A Projection | Interest Projection | |
| 2023 | 376.185 | 726.54 |
| 2024 | 376.185 | 726.54 |
| 2025 | 479.597 | 926.27 |
| 2026 | 540.314 | 1,043.53 |
| 2027 | 608.718 | 1,175.64 |
| 2028 | 685.782 | 1,324.48 |
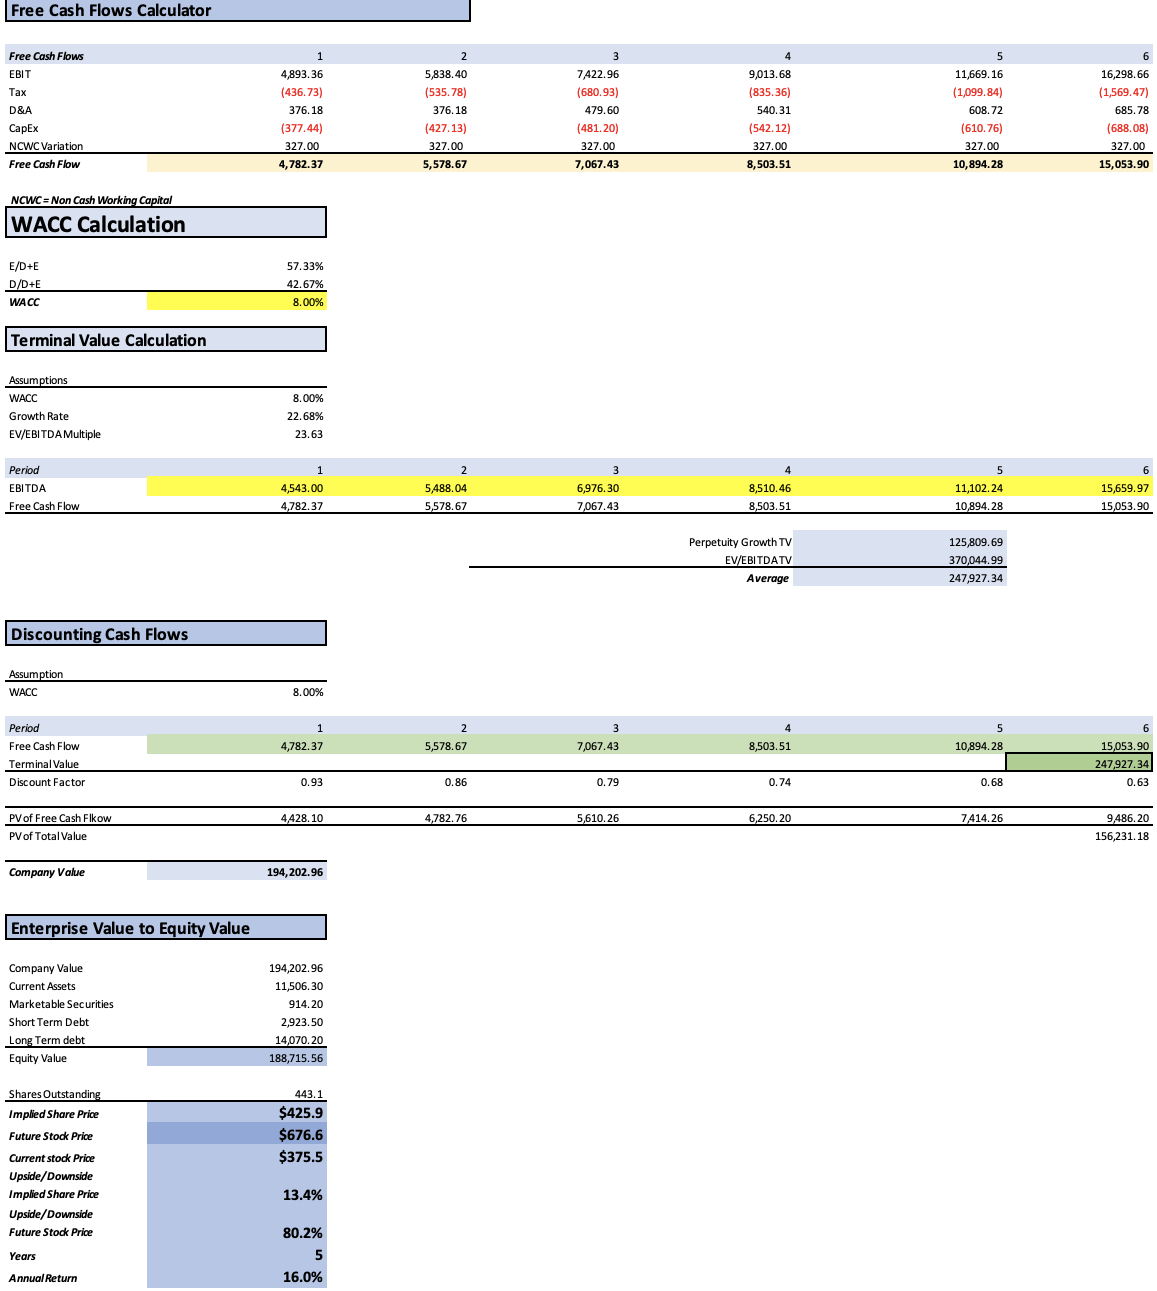
DCF 2 (Author’s Calculations)
Under this second scenario, the DCF model suggests that Netflix is a little undervalued. The estimated fair price of $425.9 is marginally higher, by 13.4%, than the current stock price of $375.5. The projected future stock price of $676.6 implies an annual return of 16%. However, this annual return is still relatively low, raising the question of whether better investment opportunities might be available elsewhere.
It’s evident that Netflix’s potential upside based on the available estimates are somewhat modest, particularly as more competitors enter the streaming market. A noteworthy example of how susceptible Netflix is to subscriber growth concerns occurred in June 2022 when the stock hit its lows at $179.95 due to a sudden subscriber slump, causing it to become significantly undervalued. Subsequently, when Netflix posted a surprise surge in subscribers, the stock quickly rebounded by around 109% to its current level.
Then where is the value?
As previously discussed, the impact of password cracking on Netflix’s revenue would, at most, result in a one-time increase of 3-4% in its revenue. This increase is relatively inconsequential in the context of Netflix’s overall valuation. However, the real value lies in advertising.
To project Netflix’s potential earnings from advertisements, I will use Hulu as a benchmark. Hulu has approximately 30 million subscribers from its base of 48 million, and these subscribers are enrolled in the ad-enabled plan, which is priced similarly to Netflix’s subscription. This 30 million represents about 62.5% of Hulu’s subscriber base. Applying the same proportion to Netflix’s 238 million subscribers, we can theoretically estimate that Netflix could have around 148.75 million subscribers with ad-enabled plans. Then I will assume that Netflix will add 24.76 million people to these plans which could either, come from already existing plans, or new subscribers. Then I multiply that by $103 which is what Hulu may be earning per subscriber when you divide their 2022 $3.1 billion ad revenue for 2022 by the 30 million subscribers enrolled for Hulu’s ad-supported plan. However, are people willing to use a Netflix’s ad-supported plan? Well, according to many surveys, the percentage of people willing to do so is over 30%.
Herein lies the critical point: these endeavors are essentially capital-free. Activities such as cracking down on password sharing and reducing subscription prices to incorporate advertisements entail minimal operating expenses, resulting in nearly pure profit.
| Advertisements | Password Cracking | |
| 2023 | 2,550.3 | 1088.4 |
| 2024 | 5,103.7 | 1088.4 |
| 2025 | 7,657.0 | 1088.4 |
| 2026 | 10,210.4 | 1088.4 |
| 2027 | 12,763.8 | 1088.4 |
| 2028 | 15,321.3 | 1088.4 |
| Revenue | Net Income | Upgraded NetIncome | Plus Taxes | Plus D&A | Plus Interest | |
| 2023 | $37,368.7 | $4,132.48 | 7,771.2 | $8,681.03 | $9,097.80 | $9,902.71 |
| 2024 | $44,362.1 | $5,069.72 | 11,261.8 | $12,580.34 | $12,997.11 | $13,802.02 |
| 2025 | $56,989.1 | $6,219.54 | 14,965.0 | $16,717.10 | $17,352.69 | $18,580.23 |
| 2026 | $73,274.5 | $7,630.13 | 18,928.9 | $21,145.18 | $21,962.39 | $23,540.72 |
| 2027 | $93,538.2 | $9,360.64 | 23,212.8 | $25,930.63 | $26,973.85 | $28,988.65 |
| 2028 | $118,132.4 | $11,483.64 | 27,893.3 | $31,159.12 | $32,476.63 | $35,021.19 |
| ^Final EBITA^ |
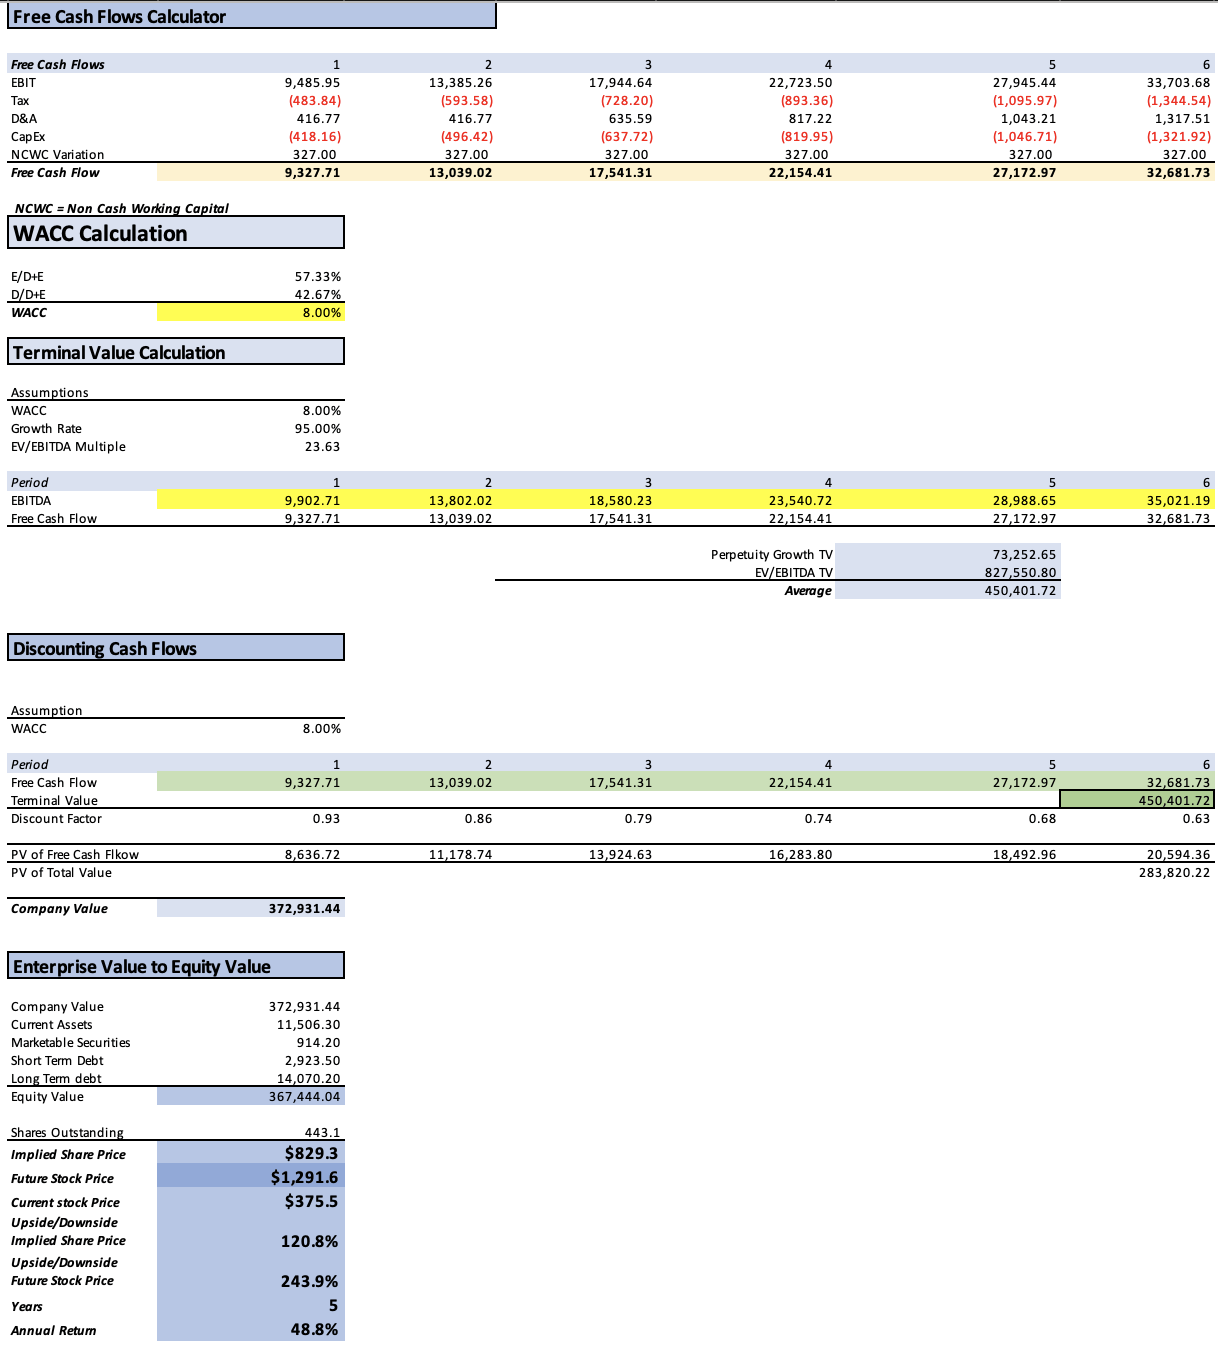
DCF 3 (Author’s Calculations)
Under this third scenario, the Discounted Cash Flow [DCF] model suggests that Netflix is significantly undervalued. The estimated fair price of $829.3 is substantially higher, at 120.8%, than the current stock price of $375.5. The projected future stock price of $1,291.6 implies an annual return of 48.8%.
It is important to clarify that I, too, view these results as very optimistic, possibly more so than reality. However, consider this analysis: even if half of these estimates prove to be inaccurate, resulting in a halved annual return, a 24.4% return remains quite attractive. Therefore, I believe that Netflix deserves serious consideration, and for this reason, I rate it as a “strong buy.”
Risks to Thesis
The only risk I see with Netflix is that, the market is starting to get saturated, currently, around 85% of US households have a streaming service. In the table below, what you will see is how the subscriber growth from Q4 2020 until today shows a clear slowdown, in this period, the growth was of around 14.8%, which means a growth of around 4.9% each year.
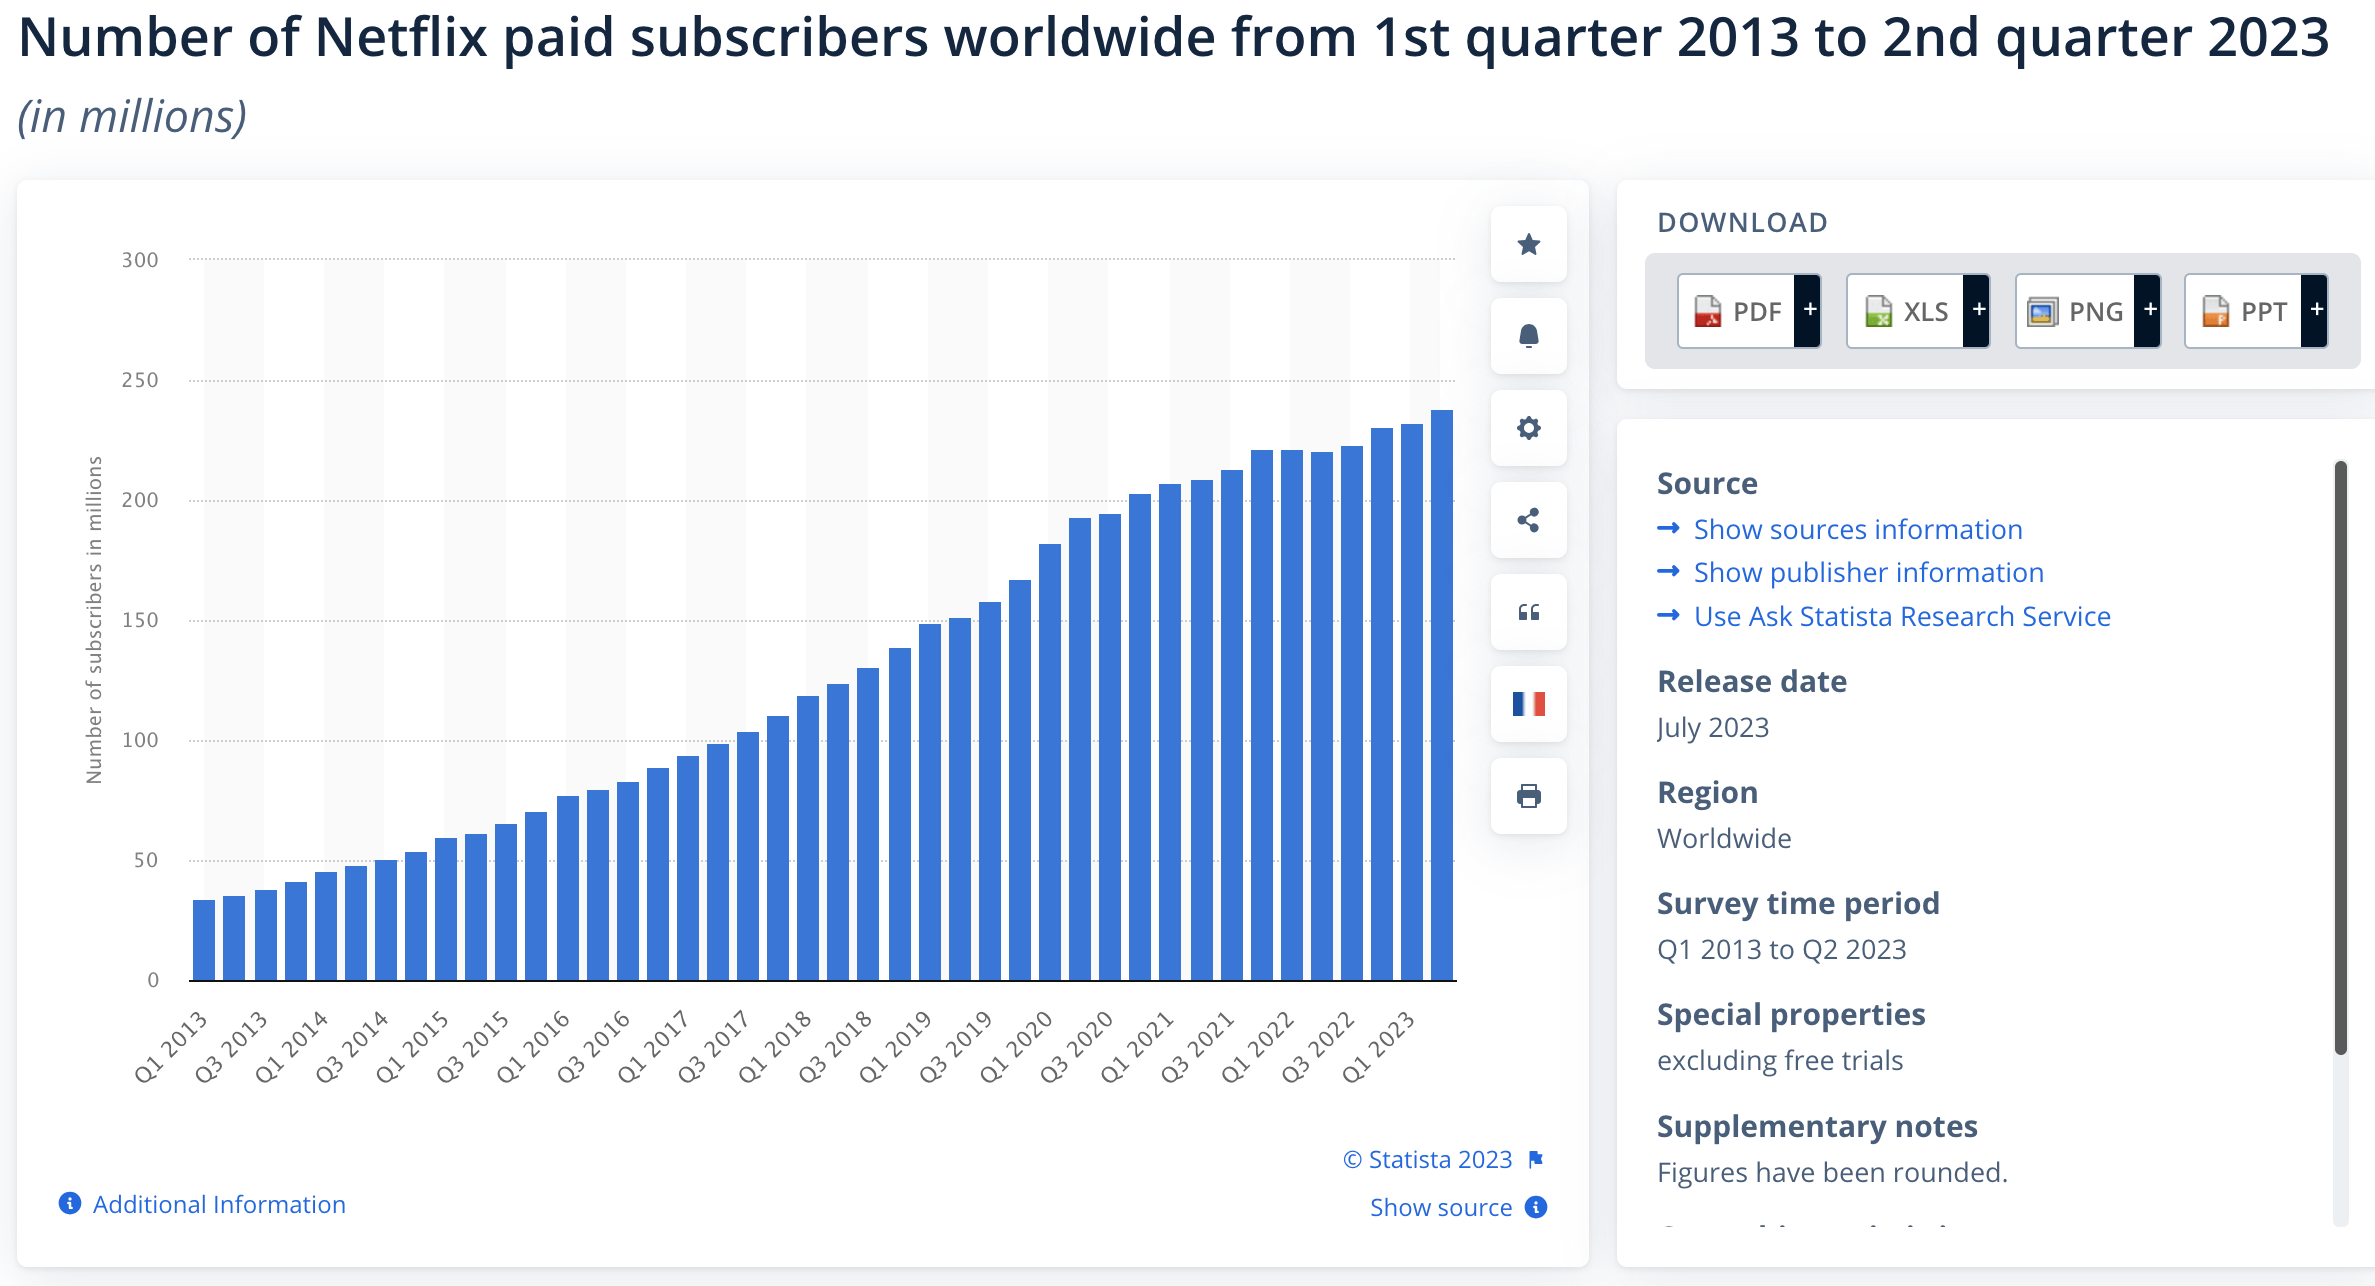
Netflix’s Subscriber Base Evolution (Statista)
However, as previously said, a recent development worth noting is Disney’s CEO, Bob Iger, stating that “it wasn’t too valuable to hoard our content for Disney+.” This implies that Disney might resume licensing its content. In contrast, Netflix has no such plans, potentially opening the door for Netflix to acquire licensing rights from Disney. This move could include adding iconic franchises like Marvel, Star Wars, Pixar, and more to its library, elevating Netflix to a whole new level, making it a compelling and indispensable streaming service.
Conclusion
Netflix has experienced a remarkable 109% surge from its 2022 lows, driven by various factors, including the resolution of the abrupt subscriber declines of 200K and 1M witnessed in Q1 and Q2 of 2022, respectively. I have assessed Netflix’s value using three Discounted Cash Flow [DCF] models: the first two represent market consensus, while the third reflects my own perspective on the stock’s potential growth, primarily driven by advertising earnings and to a lesser extent, the crackdown on password-sharing. The outcome suggests that Netflix could unlock significant value if they can achieve 62% of their subscriber base adopting the ad-enabled plan, potentially resulting in an annual return as high as 48.8%.
Moreover, Disney’s inclination to relicense its content could further bolster Netflix’s growth. This move would ensure a comprehensive content library, catering to audiences of all ages, from children to adults. However, it’s important to acknowledge that one of the most significant risks remains subscriber growth. If there is a substantial downturn, say, a 20% decline, Netflix may struggle to achieve the positive scenario I’ve discussed.
Nevertheless, Netflix continues to be a “strong buy.” Even if my estimates are overestimated by 50%, this would still translate to a respectable annual return of approximately 24.4%.
Analyst’s Disclosure: I/we have no stock, option or similar derivative position in any of the companies mentioned, but may initiate a beneficial Long position through a purchase of the stock, or the purchase of call options or similar derivatives in NFLX over the next 72 hours. I wrote this article myself, and it expresses my own opinions. I am not receiving compensation for it (other than from Seeking Alpha). I have no business relationship with any company whose stock is mentioned in this article.
Seeking Alpha’s Disclosure: Past performance is no guarantee of future results. No recommendation or advice is being given as to whether any investment is suitable for a particular investor. Any views or opinions expressed above may not reflect those of Seeking Alpha as a whole. Seeking Alpha is not a licensed securities dealer, broker or US investment adviser or investment bank. Our analysts are third party authors that include both professional investors and individual investors who may not be licensed or certified by any institute or regulatory body.