Summary:
- AbbVie is a leading pharmaceutical company with a strong history and a diverse portfolio of products.
- The company’s flagship product, Humira, has generated significant revenue and it has a pipeline of promising treatments for various diseases.
- AbbVie’s financials show consistent growth and its valuation suggests potential for future value growth.
- We believe ABBV is currently a buy.
vzphotos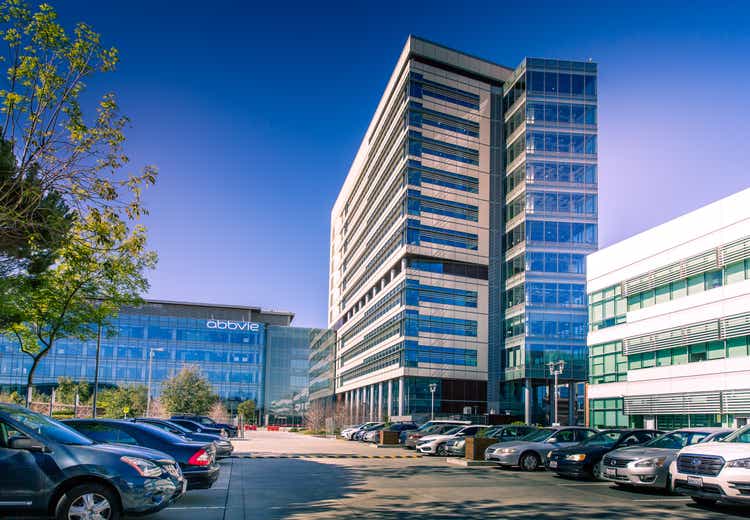
Strong History With Plenty Of Potential
AbbVie (NYSE:ABBV) is an international pharmaceutical titan, which has been at the forefront of life-changing treatments since its inception in 2013. It was formed after Abbott Laboratories (ABT) spun it off and listed it on the New York Stock Exchange under the ABBV ticker.
AbbVie has become one of the most recognizable names in the medical industry with a broad line of products.
AbbVie’s portfolio is diverse and impactful, with over 30 products and more than 50 drugs in development. Its flagship product, Humira, has been a beacon of hope for patients suffering from various autoimmune diseases, generating a staggering $21.2 billion in revenue in 2022 alone.
Other noteworthy products include Skyrizi, Imbruvica, Rinvoq, and Venclexta, each playing a crucial role in combating ailments ranging from arthritis to cancer.
Despite the success of these products, AbbVie is not resting on its achievements so far. The company is actively developing treatments for other diseases, including cancer, neurological disorders, eye care conditions, and cystic fibrosis.
With a promising drug for Parkinson’s disease on the horizon and a potential blockbuster blood cancer therapy awaiting FDA approval, AbbVie continues to push the boundaries of what’s possible in pharmaceuticals.
As a result, ABBV’s stock price has risen by almost 100% in the past five years. The stock reached an all-time high of $175 on April 08, 2022, and is now trading close to $150.
In this article, we will discuss what AbbVie has in its pipeline, its second-quarter earnings, and what we want to see in its third quarter. In addition, we will also look at how we see ABBV’s valuation in different scenarios, look at their 5-year chart, and suggest an option strategy that would be beneficial to implement for a low IV stock.
The Future Is Bright
AbbVie’s growth potential emerges as a compelling narrative for bulls, primarily driven by a shift from their blockbuster drug, Humira, and innovative drugs that exhibit significant market potential.
The insights from the Q2 earnings call paint an optimistic picture, with promising therapies beyond expectations, encouraging clinical trial results, and successful regulatory approvals.
The avenues for revenue growth for AbbVie extend to several markets, including gastroenterology, immunology, and aesthetics, with Allergan, the producer of Botox, under the AbbVie umbrella. It’s worth noting that these therapeutic domains primarily deal with non-communicable diseases, such as rheumatoid arthritis and atopic dermatitis, which are often linked to contemporary lifestyles.
Consequently, the potential for growth remains significant, with an increasingly longer life expectancy and an extended need for medication. In addition, the aesthetics market, particularly in China, offers a promising landscape for AbbVie’s expansion, as they intend to introduce a range of new products in the coming years.
AbbVie highlighted that both the therapeutic and aesthetic business segments had remarkable YoY growth for Skyrizi and Rinvoq, with a 50% increase in net revenues. The U.S. market share for psoriasis treatment with Skyrizi has doubled that of its closest biologic therapy competitor.
Skyrizi has shown promising clinical trial results for conditions like vitiligo and ulcerative colitis, offering patients a more convenient treatment option. Furthermore, the FDA has approved Rinvoq, expanding its use to adults with Crohn’s disease, and therapeutic Botox is poised to enter the European market for migraine treatments.
Furthermore, AbbVie’s successful developments, such as Epkinly, promise further expansion in Europe and Japan. The FDA’s approval of SkinVive, the first hyaluronic acid filler in the U.S. for enhanced skin smoothness, and the introduction of the Volux filler for jawline looks to solidify AbbVie as a leader in the U.S. filler market.
Although some portfolio segments experienced decreased revenues, these were offset by growth in other areas. Bolstered by positive prospects, AbbVie has raised its full-year adjusted earnings per share guidance, anticipating adjusted earnings per share between $10.90 and $11.10.
Total net revenues are expected to reach approximately $53.4 billion, reflecting an increase of $1 billion. The long-term growth outlook until 2030 anticipates high-single-digit growth, propelled by the factors above and ongoing strategic initiatives.
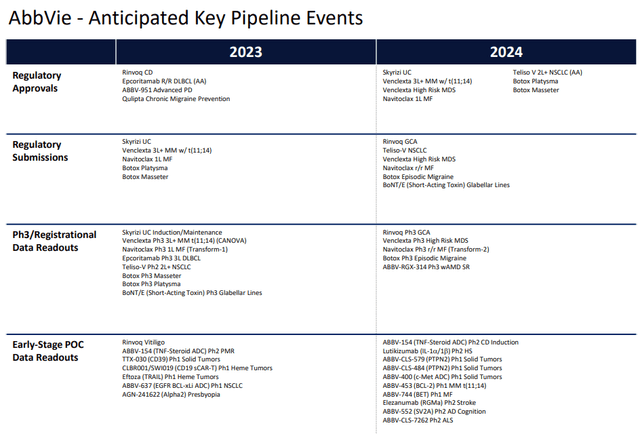
Since looking into ABBV’s pipeline of upcoming products, we have compiled a short but comprehensive list of products in different testing phases. We have included a picture from their most recent presentation on their product pipeline.
ABBV focuses primarily on the immunology market, which is also the most significant contributor to their revenues, as we will see later. In addition, many of the most anticipated 2024 products fall within the aesthetics segment. ABBV is likely positioning itself in a market anticipated to grow in the coming years.
Financials and Q3: What To Expect?
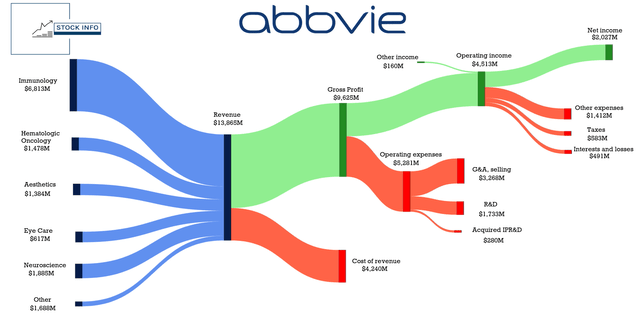
If we look at AbbVie’s second-quarter earnings, it’s pretty clear that the company generates substantial income from its operations. With a total revenue of about $13.9B and a net income of $2B, their second-quarter net income margin came in at 14.6%, which is very impressive.
In addition, their cost of revenues accounts for less than one-third of their revenues; however, their operating expenses may be just a tad high compared to their gross profit. This is where things may get somewhat disappointing – a net income margin of 14.6% is pretty low for ABBV, as we will see later in this section.
The figure below gives a good overview of which segments of ABBV’s business generate the most revenue and where their expenses lie in the second quarter.
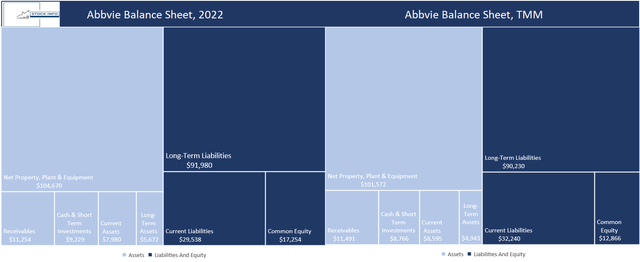
We see some slightly undesirable changes if we move onto ABBV’s balance sheet between 2022 and the TTM. First, in their 2022 earnings, ABBV held about $9.2B in cash and short-term investments, which has shrunk about 5% to $8.8B in the TTM period.
In the same period, their current liabilities have grown about 8%, and thus, the divergence in cash growth and liability growth is not exactly what you want to see as an investor. However, these changes are relatively small, and their third-quarter earnings can change this picture substantially.
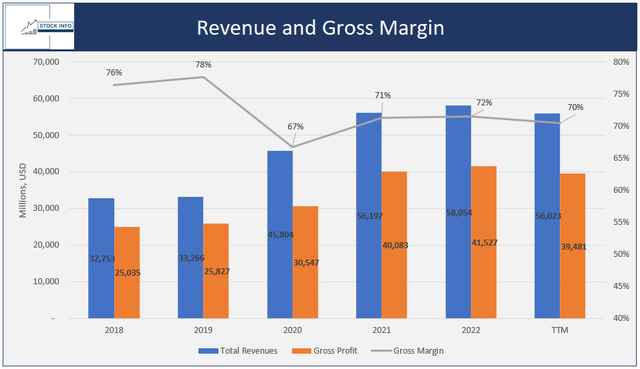
Moving onto ABBV’s historical revenue over five years, Total Revenues have shown consistent growth, starting at $32,753 million in 2018 and reaching $56,197 million in 2021, with a subsequent increase to $58,054 million in 2022.
However, the most recent TTM data indicates a slight dip to $56,023 million. The pattern suggests that ABBV experienced notable expansion, with the recent decrease possibly reflecting variations in business cycles and an overall challenging financial climate with high interest rates. Abbive’s gross profit shows a very similar trend.
ABBV’s Gross Margin shows somewhat significant fluctuations over the five years. It started at 76% in 2018, demonstrating promise, and improved to 78% in 2019, indicating enhanced profitability. However, in 2020, the Gross Margin saw a notable dip to 67%, as COVID-19 has much of the world at a standstill.
Subsequently, in 2021 and 2022, the company regained ground, reaching stability at around 70% but still somewhat far below their 2019 highs.
Stock Info
Looking at their operating margin, we see a similar pattern. While their operating margin is still below the highs in 2019, they significantly improved this margin from 2020-2022. Although it has taken a dip in TTM, Q3 could change this significantly. The story is very much the same with their net income margin.
In addition to the margin analyses, ABBV’s 5-year Revenue CAGR of 11.3% signifies a healthy expansion of their top-line revenues. Their 5-year Operating Income CAGR of 11.4% also shows that they efficiently manage operational costs and sustained profitability growth, which is a promising sign for investors.
Their FCF Yield (TTM) of 10.1% further highlights ABBV’s ability to generate substantial cash flow relative to its market value, making it an appealing investment option, especially for income-focused investors.
Let us summarize what we just learned: ABBV’s fluctuating margins suggest they have faced some challenges since 2020. However, the CAGR revenue and operating income figures underline a healthy growth trajectory.
The FCF Yield of 10.1% emphasizes ABBV’s capacity to generate strong cash flow, rendering it an attractive choice for income-oriented investors seeking consistent returns. These metrics collectively offer a comprehensive view of ABBV’s financial health and performance.
Speaking of FCF yield, we have provided a table below that shows the evolution of ABBV’s FCF, along with ROIC and EPS growth YoY.
Over the last five years, ABBV has demonstrated significant trends in the included metrics. ABBV’s FCF exhibited consistent growth, starting at $12.97B in 2018. It steadily increased yearly, reaching $24.80B in the most recent TTM data.
This positive trajectory suggests that ABBV has been progressively efficient in generating cash from its core operations, indicating financial stability and potential opportunities for reinvestment, debt reduction, or shareholder value returns.
ROIC, a measure of profitability and capital efficiency, had an exciting trajectory for ABBV. In 2018 and 2019, ABBV posted robust ROIC figures of 18.07% and 19.22%, respectively, reflecting vital capital utilization.
However, 2020 marked a substantial drop in ROIC to 6.22%, indicating a period of less efficient capital utilization.
The following years, 2021 and 2022, witnessed an upward trend, with ROIC improving to 13.35% and 14.97%, respectively. While this suggests that ABBV has taken measures to enhance its capital efficiency, it has not fully returned to the levels seen in earlier years.
EPS Growth, a key indicator of profitability, exhibited varying trends for ABBV. In 2018 and 2019, the company experienced favorable EPS growth rates of 10.88% and 44.41%, respectively, indicating substantial profit growth.
However, in 2020, EPS growth dropped significantly to -48.49%, primarily due to the consequences of COVID-19. Subsequently, in 2021 and 2022, ABBV showed a strong rebound, with EPS growth rates of 137.36% and 2.62%, respectively.
Notably, the TTM data reveals a negative growth rate of -26.62 %, suggesting a potential area of concern heading into their Q3 earnings.
You might wonder what we want to see in their third-quarter earnings. To put it bluntly, we primarily want to see their EPS grow, as it has declined quite a bit since Q3 2022. This should give investors a boost of confidence in ABBV’s ability to continue being a profitable company.
In addition, we want to see ABBV’s margins continue to improve back to the 2019 levels, which could grab the market’s attention. If we look at trends after 2020, it suggests that this is the way ABBV is headed.
Furthermore, and importantly, ABBV must continue to expand on their FCF and improve their ROIC, as these are two metrics that prove to investors that they have a profitable business.
According to Tradingview.com, the market expects ABBV to bring in around $13.7B in revenues and around $2.88 per share in earnings. ABBV has a history of beating estimates very frequently, so perhaps that will also be the chase this time.
We also want to see them at least keep their full-year guidance or, in the best case, raise them further as they did in Q2.
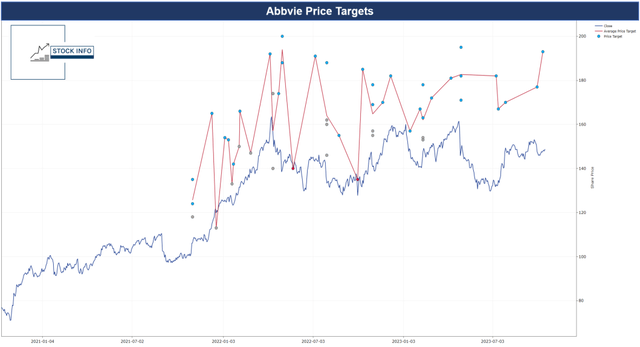
According to OpenBB, after their Q2 earnings, ABBV is trading well below most price targets, as shown below.
The average target price lies around $190, suggesting an almost 30% upside to the current price. As we will see in the next section, our models suggest that a decent amount of value remains for ABBV.
Valuation
If we try and do a valuation using our P/FCF models, we get an idea of what a fair value of ABBV would be in different scenarios. In our first model, we have chosen a base case of P/FCF of 10, the current multiple ABBV trades closely to.
Furthermore, we have chosen a multiple of 7.5 in the bear case and the bull case a P/FCF of 15. These choices are because a P/FCF of 7 has historically been one of the lowest measures the stock has reached. In addition, a P/FCF of 15 is what ABBV traded at during its 2018 highs.
Furthermore, we have assumed that ABBV can hold an approximate 5% growth rate yearly; looking at their historical financials is plausible. We have also assumed a stock price of $150, which is the price ABBV is currently trading close to. The result of the model is shown below.
ABBV trades close to what our model rates as a fair value in the base case 2024. However, suppose ABBV manages to post impressive results in Q3 and showcase they can take even more market share in the immunology segment.
In that case, it is possible this could slingshot the stock into a bull case. In this case, our model suggests ABBV trades at an approximate 50% discount to its 2024 value.
On the other hand, in the bear case, we do see a significant downside. The stock could potentially slide to around $109.52 by 2024 if their future earnings fail to meet expectations and we see the stock slump. This could also happen if their products in the testing phases are rejected.
Many investors also like ABBV due to their generous dividends. In the base case, we modeled their dividends using a 2% growth rate per share.
Historically, their dividends have grown much more, but ABBV has lowered their dividend hikes in the past year. Our bear case assumes a 1% increase, and the bull case assumes a 4% increase. Once again, we assume the stock price is $150.
We believe that ABBV generates plenty of income to keep dividends growing. However, the question is, how much will they hike it by? As mentioned earlier, ABBV has so many promising products in their pipeline, which looks to have the demand backing it, so a base or bull case seems the most plausible as it stands right now.
Peer Comparison
ABBV’s valuation metrics indicate a reasonably attractive investment opportunity, with a P/E ratio based on non-GAAP earnings for the next fiscal year at 13.36, suggesting a moderate valuation.
However, when considering stricter GAAP standards, the P/E ratio increases to 26.32, reflecting a higher valuation. The EV/EBITDA ratios for the forward-looking period (12.15) and the trailing twelve months (10.75) show reasonable valuations.
Additionally, the Price-to-Cash Flow ratio for the twelve-month trailing is 10.22, indicating a moderately attractive valuation. In terms of growth, ABBV is expected to experience a slight decline in revenue growth for the forward-looking period at -1.88%.
Still, its historical three-year CAGR for revenue (15.64%) and EBITDA (22.33%) highlights robust growth.
Furthermore, ABBV exhibits strong profitability with a 15.76% Return on Total Capital and a substantial $25.54 billion generated from operations, underscoring efficient financial performance and stability.
Stock Info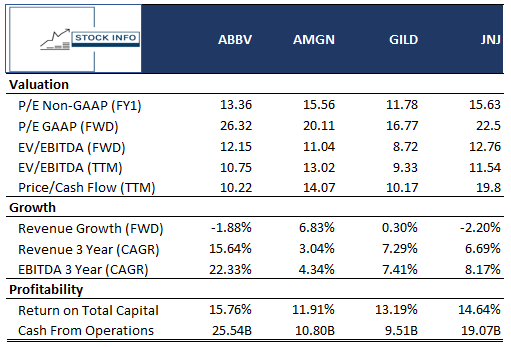
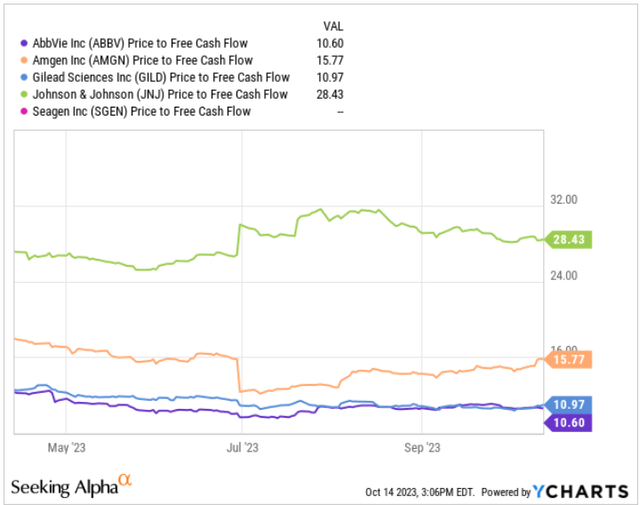
We like to compare companies on P/FCF, as we firmly believe in the power of free cash flow. Therefore, we have included a graph showcasing these companies’ P/FCF evolution through the last six months below.
We want to highlight that ABBV currently trades with the lowest multiple of all included companies. ABBV has had the lowest multiple since May, with only GILD coming close to or getting lower in the past few months.
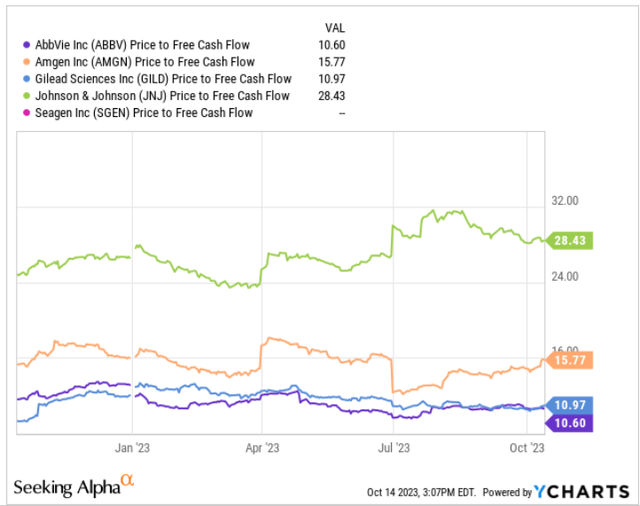
The story is mostly the same if we zoom out and look at the last 12 months, where we see that ABBV has been trading at the lowest discount compared to its peers for most of 2023 and continues to do so despite its significant rise recently.
Risks:
The pharmaceutical industry is known for its rigorous regulatory framework, and legal or regulatory issues can have far-reaching implications. AbbVie was entangled in various legal disputes, including patent battles and investigations related to its marketing and pricing practices. These challenges incurred substantial costs and created uncertainty about the company’s future prospects.
A primary factor determining AbbVie’s future was the success of drugs in its development pipeline. Like many pharmaceutical companies, the company’s performance depended on its ability to bring new drugs to market. The approval of these drugs by regulatory authorities was pivotal to its success. Failures in drug development or delays in gaining regulatory approval could lead to revenue shortfalls. As we discussed, a prominent attractive factor about AbbVie is its exciting pipeline, and too many setbacks would be detrimental to the company.
As we previously discussed, a specific risk factor for AbbVie is the evolution of debt on its balance sheet. Although it is not in an immediate area of danger, it is still worth keeping a close eye on how their debt evolves in the future. This could affect AbbVie’s financial stability and ability to invest in future growth opportunities.
AbbVie’s country risk is also a factor to consider. Although the company has a presence all across the world, which insulates it from the risk of operating in a single economy, a lot of its revenue is US-centered. Even though medicine is relatively persistent through more significant economic downturns, it is still worth noting that their revenues could take a hit in demand in the US.
Lastly, AbbVie’s declining profitability margins over the past five years pose a risk to its financial health.
Technical Analysis
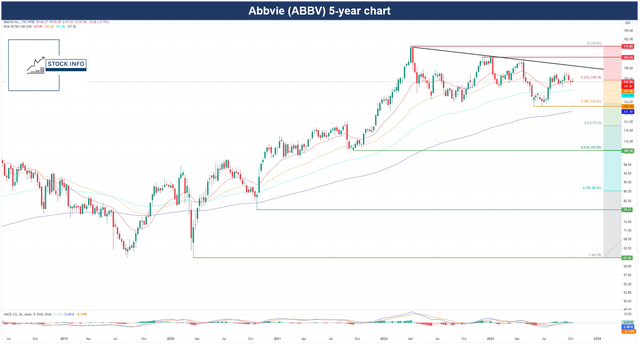
Now, let’s take a look at ABBV’s technicals over a 5-year timeframe, we see that the stock has been on a slight downtrend since the beginning of 2022.
Nevertheless, the stock finds itself at an exciting point with the 20 EMA and 50 EMA sitting very close to each other, but with the stock price sitting above the two. It should also be noted that the 0.236 Fib is $149.16 and could act as resistance.
However, it is probably not a particularly strong one. If we also turn our eyes to the MACD, we see the potential for the fast EMA to cross the slow EMA, suggesting a change in momentum to the downside for ABBV.
With that being said, however, ABBV still trades above all included EMAs and, therefore, has plenty of support to help it stay afloat in the foreseeable future.
As we see it, ABBV has the potential to continue up towards the trendline in black, which would be around $155. Conversely, if the stock loses the 20 and 50 EMA, the 100 EMA would come into play, providing support around $142. Thus, the near-term upside/downside for ABBV is relatively close.
This can be an ideal place to implement a short strangle options strategy, which we will explain in the next paragraph.
Maximize Your Returns While Holding Your Shares
If you do not know, the short strangle is an options trading strategy where investors simultaneously sell both a call option and a put option with the same expiration date but different strike prices.
The short-strangle strategy is a smart choice if you’re looking to make the most of your stocks trading within a specific range over a set time. We’re using this approach to help us generate more income while still holding onto our shares.
The first leg of the short strangle strategy is writing a put option. You have to decide at what price you would not mind buying ABBV at. You may want to buy 100 shares at $140 by December 15th, 2023, the contract you write would give you $2.43 per share. This amounts to $243, since the underlying asset of your contract is 100 shares.
The second leg is writing a covered call. The idea is very similar to the cash-secured put but the opposite. Here, you want to consider at what price you would not mind selling 100 shares of ABBV. Perhaps $160 is a level you would not mind selling your shares. In that case, writing the covered call will give you $1.56 per share if we consider the same expiration date as the cash-secured put. If we combine the two legs of the strategy, we will collect $3.99 per share or $399 in total.
You can tailor this strategy around any number of shares you own. Maybe you do not own any shares of ABBV just yet, in which case you may want to start off with a cash-secured put.
In case you already own more than 100 shares, for instance, 400, you could decide to only write covered calls. As you can see, you can tweak this to your liking!
You can also tinker with the expiration date to your own liking. Maybe you want to pick an expiration date six months out in time so that you also get to collect dividends from your holdings. It really is up to you and what best suits your overall strategy.
Optionsplaybook.com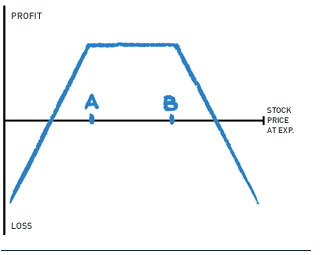
In addition, you can leverage this strategy more heavily to either side of the price range. Maybe you think the stock is about to go on a run to the upside; then you may want to write more cash-secured puts. Conversely, if you feel like ABBV is getting too expensive, you can protect your holdings by writing more covered calls, thereby generating more income as the stock decreases in price.
Most importantly, you must be aware of the timing of when to roll your options so that you don’t let go of shares you may not want to or buy at a time you may not want to. We like to manage our positions when they get in the 25% – 50% return range while still being around 3-5 weeks from expiration. Then, we roll our positions, collecting the premium we have gathered from writing the contracts and starting over again at a later expiration date.
Keep in mind that writing puts and writing calls put you at the risk of being assigned, once they become ITM. As such, this short-strangle strategy definitely requires active management in your portfolio.
Conclusion
AbbVie’s growth prospects appear promising, driven by a transition from its blockbuster drug, Humira, and the successful development of innovative therapies in various therapeutic areas, including gastroenterology, immunology, and aesthetics. The Q2 earnings call painted an optimistic picture, showcasing strong YoY growth for key products like Skyrizi and Rinvoq and a positive outlook for their expanding portfolio.
While some financial metrics have fluctuated since 2020, AbbVie’s long-term growth outlook until 2030 remains robust, propelled by strategic initiatives and its diverse product pipeline. The company’s ability to generate substantial cash flow, a healthy revenue growth trajectory, and appealing dividends make it an attractive choice for investors.
In the upcoming Q3 earnings report, investors are eager to see continued EPS growth, improving margins, and an indication of further market share gains in the immunology segment, all factors that could influence the stock’s trajectory. With the stock currently trading at a discount, there is considerable potential for future value growth, provided the company continues to meet or exceed expectations and execute its strategic plans effectively.
Additionally, for investors seeking options strategies, a short strangle within a specified price range may offer an opportunity to capitalize on time decay and limited price movement, especially in a low implied volatility environment.
This approach provides flexibility to profit from AbbVie’s potential stability in the near term while managing risk effectively. ABBV is a solid business, and its track record shows plenty of room to grow. Furthermore, with its cheap valuation, we believe we can rate it as a buy.
Editor’s Note: This article was submitted as part of Seeking Alpha’s Best Value Idea investment competition, which runs through October 25. With cash prizes, this competition — open to all contributors — is one you don’t want to miss. If you are interested in becoming a contributor and taking part in the competition, click here to find out more and submit your article today!
Analyst’s Disclosure: I/we have no stock, option or similar derivative position in any of the companies mentioned, and no plans to initiate any such positions within the next 72 hours. I wrote this article myself, and it expresses my own opinions. I am not receiving compensation for it (other than from Seeking Alpha). I have no business relationship with any company whose stock is mentioned in this article.
Seeking Alpha’s Disclosure: Past performance is no guarantee of future results. No recommendation or advice is being given as to whether any investment is suitable for a particular investor. Any views or opinions expressed above may not reflect those of Seeking Alpha as a whole. Seeking Alpha is not a licensed securities dealer, broker or US investment adviser or investment bank. Our analysts are third party authors that include both professional investors and individual investors who may not be licensed or certified by any institute or regulatory body.


