Summary:
- Through structural and strategic cost-reductions, Exxon Mobil has been able to greatly expand margins and returns on capital versus peers and its own prior decade benchmark.
- Targeted growth strategy focusing on high-return and low-cost assets in the Permian and Guyana, estimated to bring down breakeven to $30/bbl by FY27 and generate $60bn of CFO at $60/bbl.
- Largest and most profitable downstream segment provides the company with unique capabilities to maneuver difficult price environments.
- Net debt at historic lows to further free up cash, with management recently announcing $50bn of buybacks through FY24 at 8% of total current outstanding stock.
- With oil supplies and refining capacity expected to remain tight in the near-term, I see the current risk-reward profile skewed to the upside and initiate XOM at Buy with a price target of $149.
curraheeshutter
[Please note that this article has been drafted before the announcement of the Pioneer acquisition and thus will not include deal and pro-forma considerations in the financials and forecasts. I am planning on writing a separate note outlining my thoughts on the deal in the coming weeks as I estimate management will provide some more information to investors as part of the Q3 earnings call on October 27.]
Key Investment Thesis
High-Quality Assets and Structural Improvements to further drive Industry-Leading Capital Efficiency and Margins
Looking at Exxon Mobil’s financials and operations, the company is undeniably in a better spot than it was 10 years ago. Following the decline in oil prices due to US shale overproduction and especially since the onset of the Covid-19 pandemic and subsequent crash and recovery in oil prices, management has shifted its strategic focus away from an expansion-at-all-costs mode, to a more disciplined capital allocation approach focused on growth in specific key production areas and rewarding shareholders.
XOM Capex as % of CFO (Company Filings)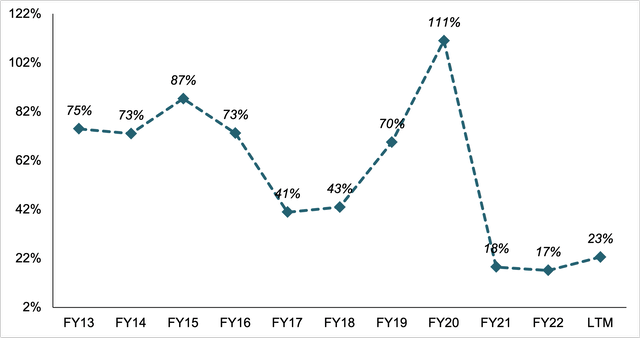
This shift becomes evident when looking at the proportion of CAPEX to total cash generated by operating activities (CFO). Especially the years 2013 and 2014 saw a CAPEX to CFO ratio more than 3x that of 2022 and 2023 in a comparable oil price environment. Another key point to highlight is the spike during the Covid-19 pandemic in 2020 which is part of management’s countercyclical spending approach as despite the sharp decline in cash flow, it did not cut CAPEX to the extent that peers did. This spending was to a large degree concentrated in the Permian Basin in West Texas and New Mexico as capital spending was redirected from supporting producing assets due to low oil prices and redirected to the buildup of new assets as countless new idle wells were drilled. While presenting a risk to the company’s debt position in the short run, this strategy reaped huge benefits for the Exxon Mobil as those wells could be quickly setup for full operations during the subsequent recovery and spike in oil prices with CFO growing more than more than 4x from FY20 to FY22 opposed to peer’s average of 2.3x.
Alongside the Permian Basin, XOM currently focuses its capital and exploration expenditures on developing its operations in the Starbroek Block off the coast of Guyana which, together with the company’s assets in the Permian, yielded a combined production of c.0.9 Mboed or 24% of total as of FY22. These key strategic growth projects, which also include Exxon’s LNG and Brazilian operations account for c.70% of total CAPEX and are initiated at 10% and 15% respective IRR hurdle rates at $35/bbl Brent while capital spending on other, legacy assets is largely comprised of maintenance to keep production stable with targeted divestments of high-cost projects. As part of its Q2 23 earnings call, management stated that the company’s wells in the Permian and Guyana deliver 2x of unit earnings compared to divested ones, highlighting the effect this decision will have on Exxon’s productions costs per barrel in the long run.
With management’s production targets of c.1.2 Mboed in Guyana, c.1 Mboed in the Permian and around 405 kboed of Liquefied Natural Gas (LNG) (author estimated growth at 3% p.a.) as well as an assumed decline in non-strategic asset’s production of c.5% CAGR over the period, I estimate Exxon’s total output to grow at 4.3% CAGR to c.4.6 Mboed by FY27. Management has also included Brazil’s Bacalhau field in their strategic growth projects, estimating it to add c.220 kboed, however, as Exxon has recently announced a failure to find oil there I have excluded it from my forecasts. This shift towards higher-return and lower-cost assets which I estimate to comprise more than 50% of total production by FY27 is the first pillar of management’s business plan to bring down breakeven costs to an industry-leading $30/bbl from $37/bbl as forecasted for FY23.
XOM Production Forecast (Company Filings and Author’s Projections)
In my opinion this will not only benefit Exxon in terms of pure costs, but also make the company more agile and flexible to react to changes in oil demand and price. Especially in the Permian, the production of these “short-cycle-barrels” can be brought up quickly in a favorable price environment and equally quickly be shut down in an unfavorable environment. Management estimates that by FY27 28% of the company’s total production base will be comprised of such assets which I view as a key advantage in times where oil cycles seem to get shorter and shorter with oil trading as low as $20/bbl to as high as >$120/bbl in the span of less than 3 years.
As second pillar of its plan to produce oil at $30/bbl by FY27, management has also undertaken several internal initiatives to streamline the company’s operations and help reduce overhead and corporate costs beginning in 2019. Exxon is fully on track to deliver the targeted $9bn of structural and sustainable savings in operating expenses as compared to FY19 baseline with around $8.3bn realized as of Q2 2023, the majority of which achieved through operational efficiencies in production and marketing as well as reductions in workforce with total FTE down from 74,900 to 62,000.
The combination of a lower-cost asset base and structural cost savings has resulted in recent margin levels being almost 50% higher than in oil price comparable years 2013 and 2014 with most of the expansion happening post FY20 after the company had initiated its new savings strategy. With the increasing ramp-up of low-cost production in Guyana and the Permian and further reductions in headcount and operational inefficiencies due to continuing technology adoption across the value chain, I estimate this margin expansion to continue and allow Exxon a significant degree of operating flexibility throughout the oil price cycle going forward.
XOM Margin Development (Company Filings)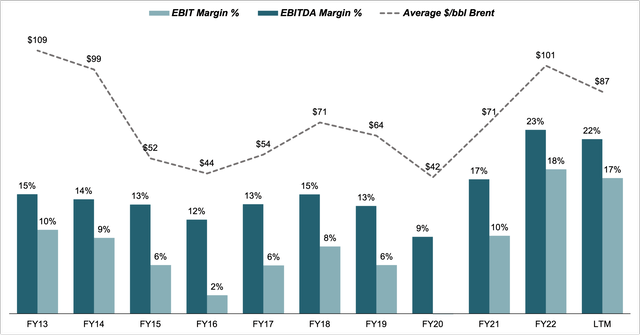
Another metric that highlights the much stronger position that Exxon Mobil is currently in when compared to prior high oil price environments, is the increase in return on capital employed (ROCE) which measures earnings as an output relative to the company’s asset base less financial debt as an input. This is where both aforementioned key points come together with earnings growing at a higher pace than capital employed through an expansion in margins while capital spending remains disciplined. Plotting XOM’s achieved returns on capital against the annual average $/bbl Brent for FY13 to FY22 and estimating a regression between the two variables for a benchmark FY13-19 period, it becomes evident how much Exxon has been able to improve its capital efficiency when operating at similar oil price levels. While FY21 has largely performed in line with the benchmark prediction, FY22 and the LTM period generated 1.58x and 1.67x that of benchmark estimated ROCE levels respectively, highlighting the stellar operational improvements the company has achieved in recent times, irrespective of underlying oil prices.
XOM Return on Capital Employed (ROCE) (Company Filings)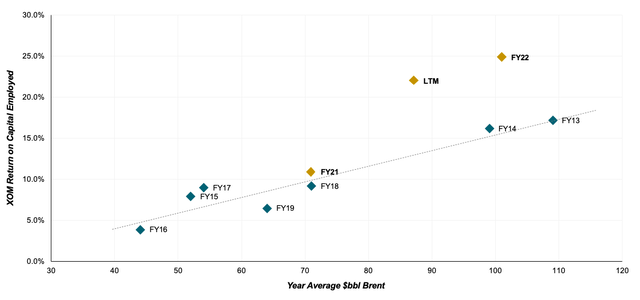
This trajectory has also placed the company well ahead of European oil majors and closest US competitor Chevron with XOM generating 1.3x of peer average ROCE over the LTM period further supporting the company’s strong investment case ahead of peers.
XOM ROCE vs Peers (Company Filings and Author’s Calculations)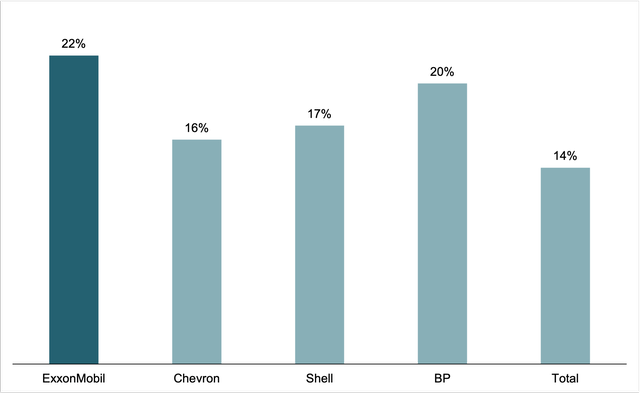
Largest and Most Profitable Downstream Business as Key Competitive Advantage vs Peers
I view Exxon Mobil’s downstream business which is the largest among peers at c.38% of total earnings as of FY22 (vs peer average of 20%) as a key competitive advantage due to the diversification it provides the company with, with refining and chemical production as a partial hedge against cyclicality in crude oil prices. When compared to peers, Exxon has shown a lower correlation in YoY% EBITDA to YoY% oil prices over the period from FY14 to FY20 (for FY21 and FY22 the correlation would take into account Exxon’s much faster recovery as shown earlier) which in my view highlights the (at least partial) downside hedge a large downstream business can provide for an integrated oil company as refining and chemical production margins benefit from lower crude oil input prices all else equal.
XOM YoY% EBITDA/Brent Oil Price Correlation vs Peers (Company Filings)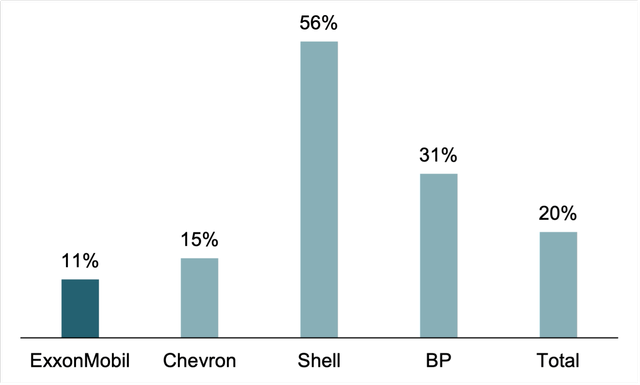
As part of its business plan to improve efficiency in the segment and grow earnings 3x by FY27 to FY19 baseline, XOM has divested a set of underperforming and older refineries in recent years, focusing human and physical capital on high return complexes with large scale and tight knit integration of refining and chemical production. This should allow the company high flexibility in adjusting production output and mix to a changing energy landscape. On the other hand, Exxon is actively growing the business with expansions at the Baytown, TX and China facilities, the second of which scheduled to start operations in FY24 and produce an estimated 1.7mt of polyethylene per year. With the majority the company’s refining capacity located on the US Gulf Coast in Texas and Louisiana, I estimate the increasing share of production coming from the Permian to offer additional upside to margins.
The second pillar of management’s strategy is a shift in production mix in the chemicals segment towards higher value-add performance products which offer higher margins and growth with sales of performance chemicals having grown at 2x the rate of commodity chemicals. With those key projects on the ground and the aforementioned company-wide structural cost reduction programs, I estimate Exxon to further lead its peer group in downstream, in both scale and operating efficiency with earnings margin already around 1.5x that of peer average (5.9% vs 4.1%).
XOM Downstream vs Peers (Company Filings)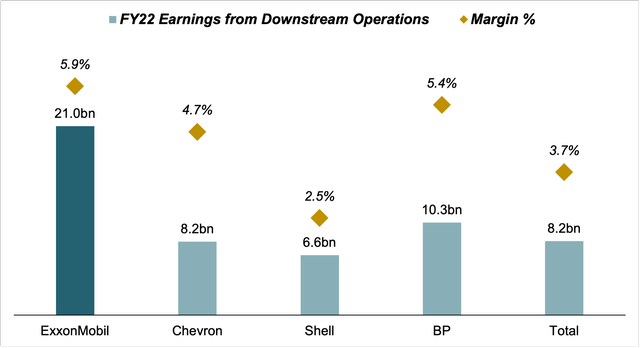
This segment is also one of the key factors in Exxon’s preparations for an eventual post-oil period, rapidly building up its capacities in biofuels with management estimating them to add $700MM in annual earnings by FY27. Next to carbon capture technology, biofuels have become XOM’s strategic focus in the renewable energy space as the company seeks to draw from its strengths in molecules and refining instead of diverging operations into adjacent fields such as power and electricity production, as some of the European oil majors have done in recent years. Management has also clearly communicated its commitment to keep renewable and fossil energy products competing for capital with IRR hurdle rates around 10% applied across the entirety of the company’s operations. This is a direct differentiator to the strategy employed by European competitors which invested, and continue to invest heavily in power generation through wind or solar which from an IRR perspective, significantly dilutes profitability and capital efficiency with i.e. Shell aiming for IRRs of 6-8% in this field.
Fortress Balance Sheet and absolute Commitment to Shareholders by Management
As of Q2 23, Exxon has around $41.5bn of debt and $29.5bn of cash on its books, equating to a net debt position of $12bn. Since a peak of 21% net debt to total assets in FY20 as crashing oil prices forced to company to take on debt to fund management’s counter cyclical spending and dividend payout (Exxon did not cut its dividend during the pandemic), the company had gradually delevered to a current net debt ratio of 3%, a 10-year record low. This is remarkably low when compared to peers with Chevron at 4.7% and European majors at around 10%.
XOM Net Debt Development (Company Filings) XOM Net Debt vs Peers (Company Filings)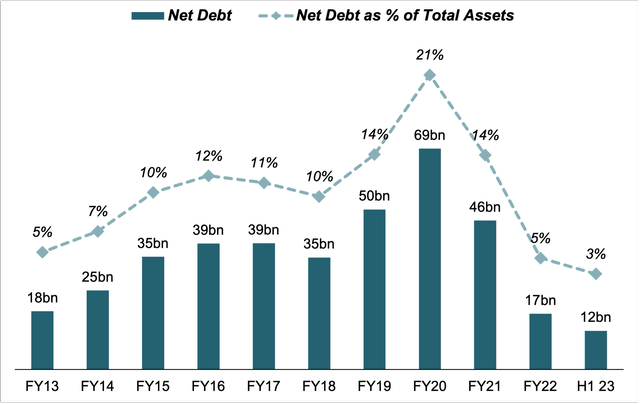
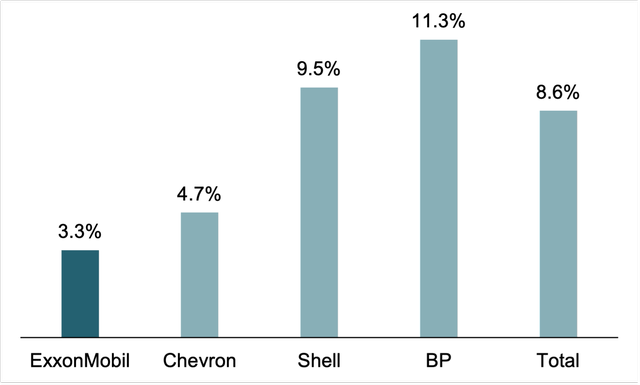
At such low debt levels and with oil prices projected to remain elevated in the near term, this should greatly benefit shareholders as management can fully allocate FCF to grow dividends and buy back shares instead of using parts of it to pay down debt. This is further benefitted by Exxon’s capital discipline with lower CAPEX increasing conversion of CFO to FCF. XOM shares currently yield 3.3% with dividends having grown at 2.74% CAGR over the last 5 years and being increased consistently since 24 years. Current yield is lower than peers, however I do estimate significant upside here as aforementioned factors will benefit Exxon’s ability to grow shareholder payouts above industry-average for the coming years.
Next to dividends, management has long let shareholders participate in the company’s profits by buying back outstanding shares, lowering share count and thus increasing earnings and dividends per share. Since FY13, Exxon has bought back approx. $70bn in shares or around 16% of current capitalization along with paying out $148bn in dividends. At a cumulative CFO of $446bn for the period this equates to a total shareholder payout ratio of c.53%. When compared to Chevron at 48% and especially the European majors which have averaged a payout ratio of 36%, this in my view highlights Exxon’s superior commitment to its shareholders with management recently announcing an increase in planned share buybacks to $50bn through FY24 (annual $17.5bn for FY23 and FY24 with $15bn of purchases in FY22), up 15% from its previous guidance for $30bn to FY23 ($15bn annualized). At current share prices, this could retire up to 319MM shares and lower total share count by a further 8% to help stabilize EPS with profits coming down from record FY22 levels.
XOM Payout Ratio vs Peers (Company Filings and Author’s Calculations)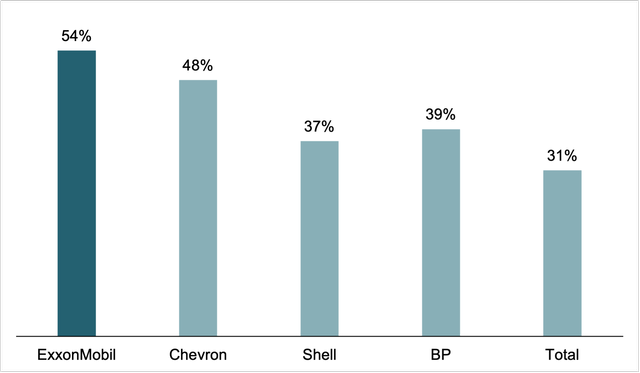
Valuation
Due to the Oil & Gas industry’s long-lived nature, I value Exxon using a 5-Year DCF model with a WACC of 9.5% (derived from XOM equity beta of 1.04 and assuming a post-tax cost of debt of 5%) and a perpetual growth rate of -2% which in my view reflects the overall prospects of the industry as fossil fuels will eventually be phased out despite the transition period likely lasting until at least 2050. For oil prices I assume a base scenario of $75/bbl Brent over the projection period from FY23 to FY27 which I estimate as a good proxy given OPEC’s commitment to keep prices elevated and removal of Russian crude from (Western) oil markets. For cash flows I follow the company’s official guidance as of its Investor Day 2022, aiming to bring breakeven cost per barrel to $30 and a CFO of $60bn (2x vs FY19 at $60/bbl Brent benchmark). This yields a CFO per $/bbl above breakeven price sequentially rising from $1.6bn to $2bn through FY27. CAPEX is assumed at midpoint of company guidance of $23-25bn for FY23 and $20-25bn for FY24-FY27.
Using these inputs with October 16 as valuation date, I obtain an Enterprise Value of c.$610bn (of which 64% accounting for Terminal Value) which, adjusted for Q2 23 Net Debt of $12bn and Minority Interests of $8bn, yields a Fair Equity Value of c.$590bn or $149 per share, giving an approx. upside of 35% to current trading levels. Accounting for different scenarios with oil prices from $70/bbl on the lower end and $90/bbl on the upper end as well as perpetual growth rates of -1% to -3%, total upside potential ranges from 9% to 67%, highlighting an upwards skewed current risk-reward profile for XOM shares.
XOM DCF Model (Company Filings and Author’s Projections)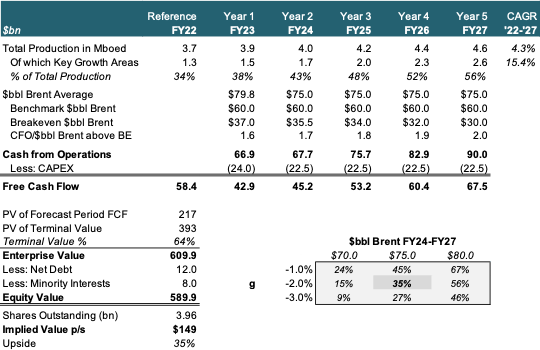
Wrap-Up and Outlook
Following the reasoning laid out above, I view Exxon as a best-in-class play on structural tailwinds in the energy sector given ongoing cost-reduction programs leading to increased margins and capital efficiency as well as management’s strategic decision making to limit capital spending on high-return, lower-cost assets and products across both up- and downstream. Coupled with Exxon’s strong position in the Permian and leading position in Guyana as well as management’s industry-leading commitment to shareholders, I see significant upside to current trading levels which in my view do not accurately reflect the stellar trajectory and operating performance the company has managed to deliver in recent times.
Risk to my thesis include a stronger than expected economic slowdown with the US and Europe entering recession and China’s post-covid recovery not materializing which could drag oil prices materially lower despite OPEC supply cuts as well as more extreme shifts in political and social climate towards hydrocarbons.
Exxon is scheduled to report its Q3 earnings at October 27. Given my very long-term view on the stock I do not expect any significant changes in my investment thesis arising from the call, however, I advise current and prospective investors to pay specific interest to management’s quarterly reporting of its progress in cost-reduction vs 2019 as well as any news regarding the Exxon’s Brazilian operations after recently announcing a continuation of its E&P activities in the Bacalhau field despite failing to find oil there earlier in the year.
Editor’s Note: This article was submitted as part of Seeking Alpha’s Best Value Idea investment competition, which runs through October 25. With cash prizes, this competition — open to all contributors — is one you don’t want to miss. If you are interested in becoming a contributor and taking part in the competition, click here to find out more and submit your article today!
Analyst’s Disclosure: I/we have a beneficial long position in the shares of XOM either through stock ownership, options, or other derivatives. I wrote this article myself, and it expresses my own opinions. I am not receiving compensation for it (other than from Seeking Alpha). I have no business relationship with any company whose stock is mentioned in this article.
Seeking Alpha’s Disclosure: Past performance is no guarantee of future results. No recommendation or advice is being given as to whether any investment is suitable for a particular investor. Any views or opinions expressed above may not reflect those of Seeking Alpha as a whole. Seeking Alpha is not a licensed securities dealer, broker or US investment adviser or investment bank. Our analysts are third party authors that include both professional investors and individual investors who may not be licensed or certified by any institute or regulatory body.
