Summary:
- Alphabet reported better-than-expected earnings, driven by rebounding digital advertising spending on Google and YouTube platforms.
- Google’s free cash flow grew almost four times faster than its revenues, highlighting the strength of its advertising platforms.
- The earnings report caused shares to drop 6%, and I believe the market overreacted here. I will explain why Q3’23 earnings were a huge win for the technology company.
- With a 5% free cash flow yield and potential for organic growth in advertising and Cloud businesses, investors can benefit from Google’s current valuation.

400tmax
Alphabet (NASDAQ:GOOG) reported much better than expected earnings for the firm’s third quarter, driven by a rebound in digital advertising spending on both the Google and YouTube ad platforms, resulting in a return to double-digit top line growth. The rebound in the advertising business is good news because slowing ad spending has weighed on Google’s financial results in the last year. What was an important takeaway from the earnings release was, in my opinion, that Google’s free cash flow, on a Y/Y basis, grew 3.7X faster than its revenues… which underlines the strength of its advertising platforms.
Shares dropped 6% after earnings, on slowing Cloud growth, which reflects a misreading of Google’s earnings report, in my opinion. At the current valuation, investors can get a 5% free cash flow yield and participate in the upside provided by the organic growth of the advertising and Cloud businesses!
Previous rating
My last available rating on Google was strong buy: Google: This FAANG Laggard Has Q2 Surprise Potential. The reasons for my previous rating were favorable trends in the digital advertising market (which continued to play out), improving EPS estimates, and continual potential for an ad market recovery. In addition, I would now name as strong buy reasons: (1) Accelerating revenue to free cash flow translation and (2) FCF margin expansion.
Google delivers top and bottom line beat
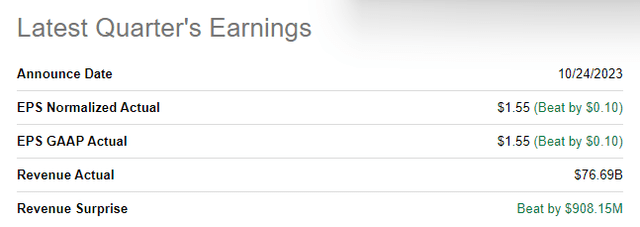
Google’s third-quarter earnings report beat estimates on both the top and the bottom line: the technology firm achieved revenues of $76.7B which was $908M better than the consensus estimate while adjusted earnings of $1.55 per share beat the average prediction by $0.10 per share.

Source: Seeking Alpha
Double-digit top line growth is back, Google’s main accomplishments in Q3’23
Google benefited profoundly from a rebound in advertising spending in the third quarter which was reflected in 11% top line growth. Google Search saw 11% revenue growth while YouTube ads delivered 12% growth compared to the year-earlier period. Google generated a total of $76.7B in revenues in the third quarter. Google Cloud revenues were $8.4B and increased 22% year over year. In the previous quarter, Google Cloud delivered 28% year-over-year growth so this segment has seen a bit of a slowdown here. The slowdown was likely also the reason behind Google’s shares dropping 6% after the earnings report.
While Google Cloud is important as a growth driver, it still accounts for only about 11% of revenues. Google Search & YouTube, on the other hand, account for 68% of total revenues… in other words, the improvement in the ad part of Google’s business should have outweighed the slowing growth in Cloud by a significant margin. Overall, the earnings report was exceptionally strong, in my opinion, especially with the digital advertising business rebounding strongly.
|
$millions |
Q3’22 |
Q3’23 |
Y/Y Growth |
Revenue Share (Q3’23) |
|
Google Search & other |
$39,539 |
$44,026 |
11.35% |
57.41% |
|
YouTube Ads |
$7,071 |
$7,952 |
12.46% |
10.37% |
|
Google Network |
$7,872 |
$7,669 |
-2.58% |
10.00% |
|
Google Other |
$6,895 |
$8,339 |
20.94% |
10.87% |
|
Google Cloud |
$6,868 |
$8,411 |
22.47% |
10.97% |
|
Other Bets |
$209 |
$297 |
42.11% |
0.39% |
|
Hedging |
$638 |
($1) |
-100.16% |
0.00% |
|
Total revenues |
$69,092 |
$76,693 |
11.00% |
100.00% |
(Source: Author)
Free cash flow grew 4x faster than revenues (Y/Y)
The biggest takeaway from Google’s third-quarter earnings release was not that the technology company is benefiting from a rebound in ad spending on its two major platforms (although this is also true), but that free cash flow is growing at a much faster rate than revenues.
Google generated $22.6B in free cash flow on revenues of $76.7B which calculates to a free cash flow margin of 30%. showing an FCF margin improvement of 6.2 PP. Free cash flow, year over year, grew a massive 41%, almost four times faster than revenues. The rebound in free cash flow is in large part due to the revenue rebound on its scalable digital advertising platforms.
|
$millions |
Q3’22 |
Q4’22 |
Q1’23 |
Q2’23 |
Q3’23 |
|
Revenues |
$69,092 |
$76,048 |
$69,787 |
$74,604 |
$76,693 |
|
Net cash provided by operating activities |
$23,353 |
$23,614 |
$23,509 |
$28,666 |
$30,656 |
|
Less: purchases of property and equipment |
($7,276) |
($7,595) |
($6,289) |
($6,888) |
($8,055) |
|
Free cash flow |
$16,077 |
$16,019 |
$17,220 |
$21,778 |
$22,601 |
|
Free cash flow margin |
23.3% |
21.1% |
24.7% |
29.2% |
29.5% |
(Source: Author)
Google’s valuation
Google’s rebound in the digital advertising market, benefiting both Search and YouTube, has resulted in a massive free cash rebound year over year. With $22.6B in quarterly free cash flow, Google could be set to achieve just around $90B in free cash flow in the next twelve months. This translates to a 20X FCF multiplier factor or a decent 5% free cash flow yield, plus shares have upside as Google’s earnings and free cash flow continue to grow organically in the ad and Cloud businesses.
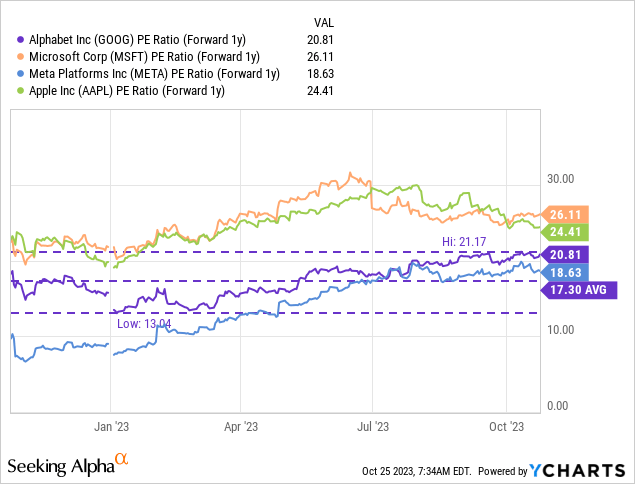
Based off of earnings, Google is valued at 21X forward earnings. The revaluation that has already taken place this year has caused the share price to trade above its 1-year average P/E ratio. However, there is no reason, in my mind, why Google can’t trade at the P/E ratio of Microsoft (MSFT) or Apple (AAPL). At a ~25X P/E ratio, Google would have a fair value around $168, implying about 27% revaluation potential.

Risks with Google
The recent USD strength is a potential problem and earnings headwind for Google. The tech firm achieved only about 47% of its revenues in the third quarter in the U.S., with the rest of its top line coming from other geographies, especially Europe and Asia. A strong USD is a headwind because it makes profits stored abroad less valuable for U.S. companies. Another risk that I see relates to Google’s Cloud business. Investors are especially sensitive to Cloud performance, even if total company performance is improving. A continual slowdown in Cloud may therefore affect the valuation factor despite overall top line and free cash flow growth.
Final thoughts
One takeaway from Google’s Q3’23 earnings release was that the company is enjoying double-digit top line growth again. The ad market slowdown therefore seems to be a thing of the past. A much stronger takeaway was that returning advertising strength in both Search and YouTube has resulted in about four times stronger free cash flow growth relative to top line growth. Google generated a massive $22.6B in free cash flow in Q3’23 and the company’s FCF margins are still expanding. Although Cloud growth slowed Y/Y, I believe the market is too singularly focused on this specific segment. Google’s Q3’23 earnings were a solid win for the company overall and I believe shares remain an exceptionally attractive long-term investment!
Analyst’s Disclosure: I/we have a beneficial long position in the shares of GOOG, MSFT either through stock ownership, options, or other derivatives. I wrote this article myself, and it expresses my own opinions. I am not receiving compensation for it (other than from Seeking Alpha). I have no business relationship with any company whose stock is mentioned in this article.
Seeking Alpha’s Disclosure: Past performance is no guarantee of future results. No recommendation or advice is being given as to whether any investment is suitable for a particular investor. Any views or opinions expressed above may not reflect those of Seeking Alpha as a whole. Seeking Alpha is not a licensed securities dealer, broker or US investment adviser or investment bank. Our analysts are third party authors that include both professional investors and individual investors who may not be licensed or certified by any institute or regulatory body.
