Summary:
- Microsoft reported strong revenue growth (+13%) and increased operating profits (+25%) in its latest Q1 FY24 quarterly results.
- The company’s TTM 32.8x P/E gets more reasonable when considering the 16.2% average revenue and EPS growth over the past 5 years.
- Microsoft’s scale and profitability make it a promising long-term investment to hold, with potential for increased dividends and share repurchases.
David Becker
Microsoft’s (NASDAQ:MSFT) recently released results show continued growth in this technology conglomerate with strong revenue growth of 13% to $56.5 billion with operating profits increasing to $26.9 billion (+25%). With this great growth the company continues to trading at a high 32.8x TTM P/E and 2.0 PEG ratio when considering the average 16.2% per share growth rates over the past 5 years. This article will take a look at Microsoft’s latest results and historical shareholder returns to get a sense of opportunity at today’s share price.
The behemoth of a company continues grow not only organically but also by maneuvering its way around anti-monopoly regulation through the decades by expanding horizontally beyond their core Windows operating system and Microsoft Office products. This was most recently seen through Microsoft’s $69 billion acquisition of Activision to build up their More Personal Computing segment on the game development side to complement their Xbox gaming console offering.
Latest Quarterly Results
In Microsoft’s latest Q1 FY24 results for the quarter ended September 30, the company reports strong revenue growth of 13% to $56.5 billion with operating profits increasing to $26.9 billion (+25%). Operating expenses remained lean up only 1% YoY to $13.3 billion. Net income was $22.3 billion (+27%) for the quarter with diluted EPS of $2.99 increasing by the same percentage. Cash flow from operations reported were $30.6 billion (+32%) and with capital expenditures of $9.9 billion, free cash flows were $20.7 billion for the quarter.
The company’s largest segment, Intelligent Cloud, reported revenues of $24.3 billion which increased 19% from the prior year. Revenue in Productivity and Business Processes was $18.6 billion and increased 13% with the More Personal Computing segment seeing revenue growth of only 3% to sit at $13.7 billion. This segment was held back by Device revenue dropping 22% with Xbox and Search & New Advertising growth remaining strong at 13% and 10%, respectively.
Revenue Highlights (from Microsoft’s from Microsoft’s Q1 FY24 Financials)
Microsoft continued their great shareholder returns with dividends of $5.6 billion and share buybacks of $3.6 billion. The company ended the quarter with $143.9 billion of cash on the balance sheet which was up $32.7 billion (+29.4%) and represents around 6% of Microsoft’s $2,465 million market cap. With this kind of continued cash build up, I expect high dividends and share repurchases as large acquisitions such as Activision Blizzard are hard to come by.
Profitable and Growing
Microsoft’ scale and position in the industry have allowed it to achieve an average return on equity and return on invested capital of 39.5% and 19.8%, respectively, over the past decade. This level of profitability is well above my rule of thumb of 15% ROE and 9% ROIC, allowing me to be confident that, in my opinion, the company is able to maintain and continue to increase its intrinsic value over a business cycle.
Profitability & Growth at Microsoft (compiled by author from company financials)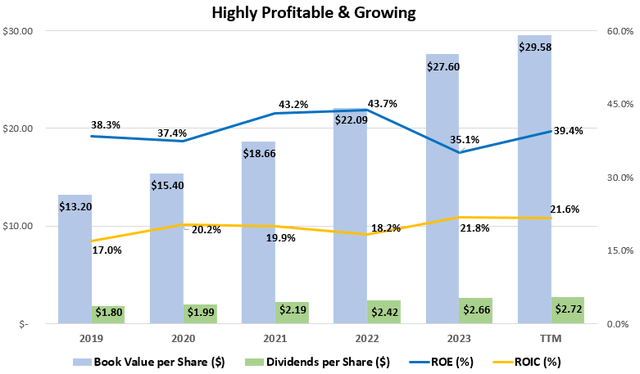
On the growth side, book value per share has grown from $13.20 in 2019 to $29.58 in its latest quarter, which, when combined with the dividends paid out from equity, has averaged growth of 30.5% annually and further supports the ROE average. This book value growth is slightly lower than average ROE not due to poor performance at the company, but rather the mathematical effect of Microsoft repurchasing their shares at much higher values than the price-to-book value as calculated from the financials.
Per Share Growth at Microsoft (compiled by author from company financials)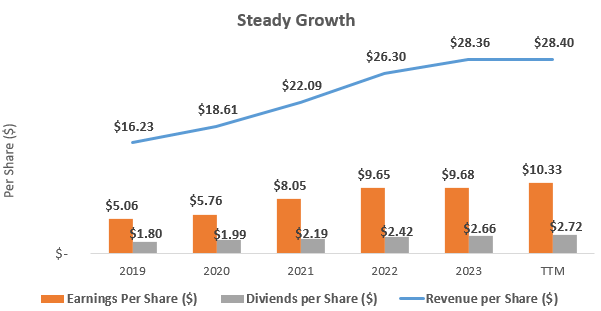
Microsoft still looks like a growth company despite its size and history, continuing to defy the laws of large numbers. Since 2019 the company has managed to grow revenues per share at an average rate of 14.1%. Growth in EPS has been even better, at an average rate of 18.3%. Dividend growth has been slightly below these amounts at 10.2% with the dividend payout ratio decreasing from 36% in 2019 to 26% in the TTM. This low dividend payout ratio shows great potential for growth over EPS or revenue gains going forward, even when considering share repurchases. Let’s analyze the potential for increased dividends more through looking at the cash flows.
Cash Flow Analysis
Microsoft’ does a great job of generating cash and in recent years has been using this free cash flow to pay down debt as well as meaningfully increasing the dividend as mentioned earlier. To get an idea of the sustainability of dividends and share repurchases, we can take a look at what percent of cash flow from operations is available to be returned to shareholders after making the necessary capital expenditures. As can be seen below, capital expenditures and acquisitions only used up on average 29% and 9%, respectively, of cash flow from operations since 2019. This leaves approximately 62% to be returned to investors in the form of dividends and share repurchases.
Cash Flow Analysis (compiled by author from company financials)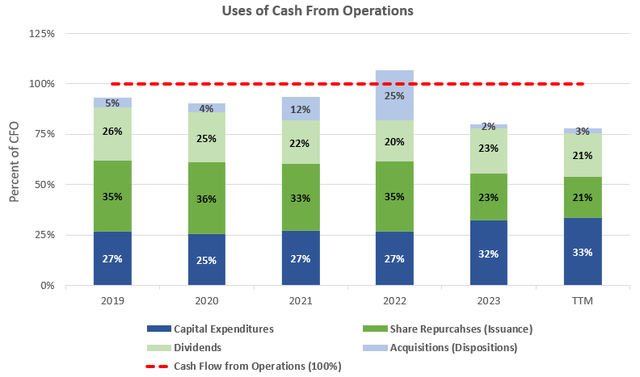
With cash flow from operations growing every year and being at $95.0 billion over the TTM, this 62% would imply free cash flow to shareholders of $58.9 million for around a 2.4% free cash flow yield at the current $2,456 billion market capitalization. While the company is highly profitable with great cash flows, the current +30x P/E valuation pushes down the FCF yield. Microsoft’s current dividend of 0.9% and similar average share buybacks of 0.9% (to be discussed later) combine to an approximate similar 1.8% total shareholder return which this analysis shows could be increased.
How About the Debt?
Financial leverage at Microsoft has been on a steady decline in the last 5 years moving from 2.80x to 2.02x in the latest quarter. This low leverage makes the company ready for another large acquisition such as Activision Blizzard. The interest coverage leverage is not a concern due to the high profitability helping coverage levels reach +40x in recent years.
Capital Structure Highlights (compiled by author from company financials)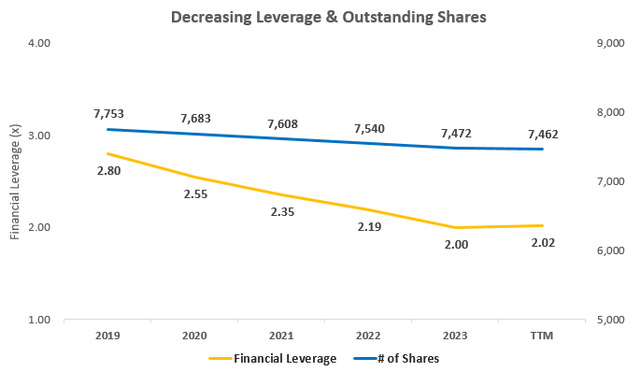
Microsoft also does a great job returning cash to shareholders in the form of dividends and share repurchases. Since its 2019 fiscal year, the company has bought back on average 0.9% of their outstanding shares each year, as can be seen in the graph above. Adding these share repurchases on top of the current 0.9% yield would imply a total shareholder yield of 1.8%.
Getting a Sense of Valuation
Microsoft’s 32.8x TTM P/E ratio can also be expressed as a 3.1% earnings yield, but I also always like to examine the relationship between average ROE and price-to-book value in what I call the Investors’ Adjusted ROE. It examines the average ROE over a business cycle and adjusts that ROE for the price investors are currently paying for the company’s book value or equity per share. Microsoft has a great ROE, but potential returns for investors depend on the multiple paid for the book value of equity in the public stock market.
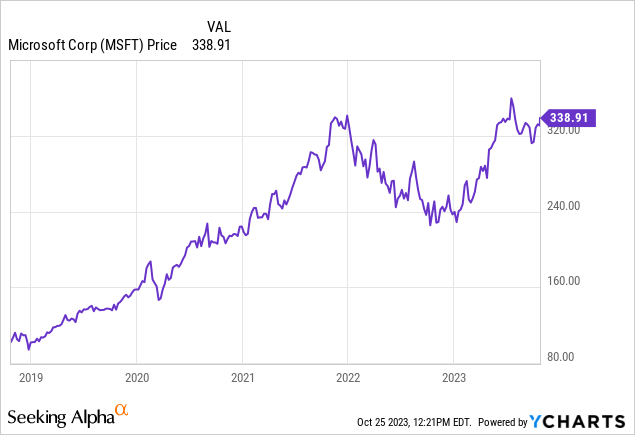
With Microsoft earning an average ROE of 39.5% since 2019 and shares currently trading at a price-to-book value of 11.5x when the price is $338.91, this would yield an Investors’ Adjusted ROE of 3.4% for an investors’ equity at that purchase price, if history repeats itself. This no growth yield is well below the 9% that I like to see given the valuation, but adding a conservative 10% to represent the 16.2% average historical per share growth discussed earlier could increase this potential total return beyond my 9% target and make PEG ratios 2.0x. Below is a table outlining the potential earnings yield estimates from this investors’ adjusted ROE figure as well as the cash flow and earnings yields discussed.
Potential Shareholder Yields (compiled by author from market data and company financials)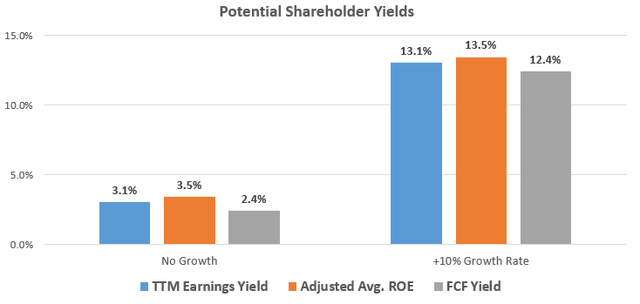
Takeaway for Investors
Microsoft’s recently released results show continued growth with strong revenue growth of 13% to $56.5 billion with operating profits increasing to $26.9 billion (+25%). With this great growth the company continues to trading at a high 32.8x TTM P/E and 2.0 PEG ratio when considering the average 16.2% per share growth rates over the past 5 years. Earnings yields are low at 2.4% – 3.5% but adding Microsoft’s great historical per share growth rates start to make the valuation look reasonable.
Analyst’s Disclosure: I/we have no stock, option or similar derivative position in any of the companies mentioned, and no plans to initiate any such positions within the next 72 hours. I wrote this article myself, and it expresses my own opinions. I am not receiving compensation for it (other than from Seeking Alpha). I have no business relationship with any company whose stock is mentioned in this article.
Disclaimer: While the information and data presented in my articles are obtained from company documents and/or sources believed to be reliable, they have not been independently verified. The material is intended only as general information for your convenience, and should not in any way be construed as investment advice. I advise readers to conduct their own independent research to build their own independent opinions and/or consult a qualified investment advisor before making any investment decisions. I explicitly disclaim any liability that may arise from investment decisions you make based on my articles.
Seeking Alpha’s Disclosure: Past performance is no guarantee of future results. No recommendation or advice is being given as to whether any investment is suitable for a particular investor. Any views or opinions expressed above may not reflect those of Seeking Alpha as a whole. Seeking Alpha is not a licensed securities dealer, broker or US investment adviser or investment bank. Our analysts are third party authors that include both professional investors and individual investors who may not be licensed or certified by any institute or regulatory body.
