Summary:
- Amazon delivered an outstanding quarter, exceeding expectations in nearly every segment.
- The company saw a strong margin expansion and over 80% growth in Operating Cashflow.
- While CAPEX tend to pull back to 2019 levels, Operating Cashflow reaches peak margins of 2020, leading to a strong Free Cashflow.
- Valuation is surprisingly low, considering that Amazon likely solved all problems of the pandemic years.
4kodiak/iStock Unreleased via Getty Images
In February, I presented Amazon (NASDAQ:AMZN) as one of my favorite titles for 2023. Back then there was still a somewhat bearish sentiment on the stock due to a massive growth slowdown in AWS and a poor performance in terms of Cashflows questioning the bull case. I pointed out the ongoing improvements in terms of reducing CAPEX while improving Operating Cashflow leading to substantial Free Cashflows in the upcoming years.
Despite some question marks in the released reports, I gave the stock a strong buy rating because the valuation was at historic lows and already included these threats. In the following months, the company was doing well but their latest Q3 report was one of the best reports for many quarters and a shocker for many sceptics so I have to discuss it here.
Q3 2023: Almost perfect
I will quickly summarize the main strengths and weaknesses of the latest report although this time there are much more strengths than before.
Strengths
- Total revenue grew 13% to $143 billion, the highest growth rate since Q3 2022
- Gross Margin improved 300 base points to 48%
- Operating Income grew 316% to 11.2 billion leading to a margin of 8% lastly seen in Q1 2021
- NA Business continues improving margins also reaching Q1 2021 levels
- AWS Operating Margin sequentially improved 600 Base Points to 30% likely seeing the bottom of its down-cycle
- Online Stores, Third-Party, and Advertising saw accelerating growth rates
- Advertising sells grew 26%, the highest value since Q3 2021
- Operating Cashflow jumped 86% YoY while CAPEX declined 25% resulting in a Free Cashflow of 8.7 billion
- Operating Income guidance indicates annual growth of 230% at midpoint
Weaknesses
- AWS grew at 12% showing no signs of growth acceleration so far and looked pretty low compared to Google Cloud & Azure
- International Sales still generate a small loss despite many cost cuts
- Physical Store’s growth was just 6%
- Soft Revenue guidance indicates 10-11% growth which is below Q3 growth rate.
- Stock-based compensation grew 5% to $5,8 billion which remains high compared to EBIT
While I found five weaknesses I think that only the ones on AWS and the guidance matter. But even those are incidental compared to all the strengths. What we saw here is the result of cost optimizations where the company can finally leave the burdening post-COVID era, one of the most challenging events in Amazon’s history.
Now the company entered a new era which followed the end of 2019 when Amazon was on the verge of finally generating substantial profits after many years of growing at any cost. While the pandemic forced the company to initially neglect these plans, Amazon is now clearly emerging stronger and now faces a decade of profits.
But it seems that the market did not recognize that so far otherwise the stock would not trade at these relatively low valuation levels.
Margin improvements everywhere
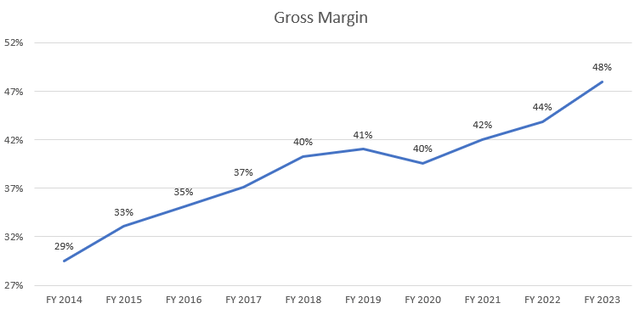
One example of these improvements is Gross Margin.
The rising Gross Margin was a main driver to reaching profitability but after many years of significant improvements, it looked like Margin peaked around 40%. Although the percentage of service sales continued to increase Gross Margin tended to be flattish in 2018-2021. 2022 first showed to results of the ongoing cost improvements and 2023 performed even better so far. Currently, there is a 400 base points improvement compared to 2022 which is just impressive.
The second massive improvement can be seen in Operating Cashflow & CAPEX. Since Operating Cashflow has been historically the most relevant number for the stock price the poor price performance from mid-2021 to the End of 2022 is understandable.
|
2015 |
2016 |
2017 |
2018 |
2019 |
2020 |
2021 |
2022 |
2023e |
|
|
OCF |
12.039 |
17.203 |
18.365 |
30.723 |
38.515 |
66.064 |
46.327 |
46.752 |
87.471 |
|
YoY Growth |
76% |
43% |
7% |
67% |
25% |
72% |
-30% |
1% |
87% |
|
Margin |
11% |
13% |
10% |
13% |
14% |
17% |
10% |
9% |
15% |
Operating Cashflow reached a new record level in absolute numbers and terms of margins during the pandemic before it decreased 30% in 2021 and stayed flat in 2022. In 2023 we are likely to see a massive 87% increase in Operating Cashflow exceeding 2020 levels by far. The rise should continue in 2024 where analysts expect another 25% increase so the record margin level of 17% in 2020 should also be reached soon.
As I wrote in my analysis in February Amazon was facing a problem in 2020, that despite the record numbers in Operating Cashflow were overshadowed by higher growth rates in CAPEX leading to a massive Cash Outflow in 2021 and 2022. This development resulted in Amazon losing control over its cost structures and Amazon cannot operate successfully without Jeff Bezos.
| Q1 2019 | Q2 2019 | Q3 2019 | Q4 2019 | Q1 2020 | Q2 2020 | Q3 2020 | Q4 2020 | Q1 2021 | Q2 2021 | Q3 2021 | Q4 2021 | |
| CAPEX | 3.290 | 3.562 | 4.697 | 5.312 | 6.795 | 7.459 | 11.063 | 14.824 | 12.082 | 14.288 | 15.748 | 18.935 |
| % YoY Growth | 6% | 10% | 40% | 42% | 107% | 109% | 136% | 179% | 78% | 92% | 42% | 28% |
| % of Revenue | 6% | 6% | 7% | 6% | 9% | 8% | 12% | 12% | 11% | 13% | 14% | 14% |
Indeed, CAPEX development was alarming as it went from 6% of total Revenue to 14% in Q3 and Q4 2021.
| Q1 2022 | Q2 2022 | Q3 2022 | Q4 2022 | Q1 2023 | Q2 2023 | Q3 2023 | Q4 2023 | |
| CAPEX | 14.951 | 15.724 | 16.378 | 16.600 | 14.207 | 11.455 | 12.479 | 11859 |
| % YoY Growth | 24% | 10% | 4% | -12% | -10% | -30% | -25% | -29% |
| % of Revenue | 13% | 13% | 13% | 11% | 11% | 9% | 9% | 7% |
But since then CAPEX massively rebounded to more usual levels. In the last two quarters, CAPEX went under 10% of total revenue and Q4 CAPEX should be around 7% according to management which was nearly at pre-pandemic levels.
So it is likely to expect 2024 CAPEX to reach a level like in 2019. Taking these two developments together we might see Amazon operating at record pandemic 2020 Cashflow Margins at 2019 efficient cost structures which leads to record Free Cashflow Margins.
| 2019 | 2020 | 2021 | 2022 | 2023 | 2024e | 2025e | |
| OCF | 38.515 | 66.064 | 46.327 | 46.752 | 87.471 | 108.907 | 125.000 |
| YoY Growth | 25% | 72% | -30% | 1% | 87% | 25% | 15% |
| Margin | 14% | 17% | 10% | 9% | 15% | 17% | 18% |
| CAPEX | 16.861 | 40.141 | 61.053 | 63.653 | 50.000 | 48.382 | 50.000 |
| % of Revenue | 6% | 10% | 13% | 12% | 9% | 8% | 7% |
| FCF | 21.654 | 25.923 | – 14.726 | – 16.901 | 37.471 | 60.525 | 75.000 |
| Margin | 8% | 7% | -3% | -3% | 7% | 9% | 11% |
This brings us to a potential Free Cashflow Margin of 11% in 2024 with further room for improvements. It does look not like the market currently values Amazon’s potential of substantial Free Cashflow Generation in the next years correct.
Valuation: Too cheap
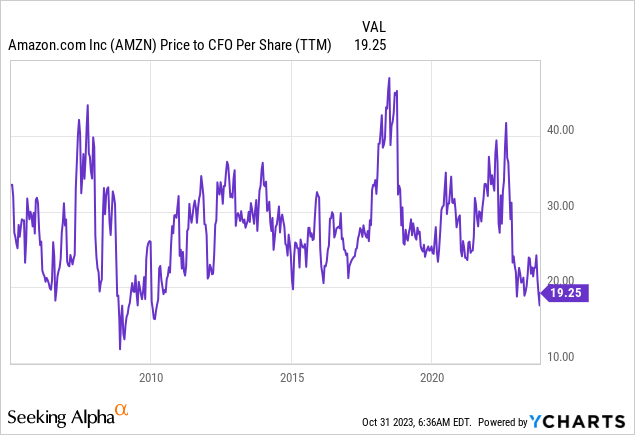
In the past quarters, Operating Cashflow rose much faster than the stock price, Price to Operating Cashflow Ratio continued to decline. Recently it even went below 20 a level which was not seen since the financial crisis. This looks like a massive mispricing given the fact that OCF will increase further in the next quarters.

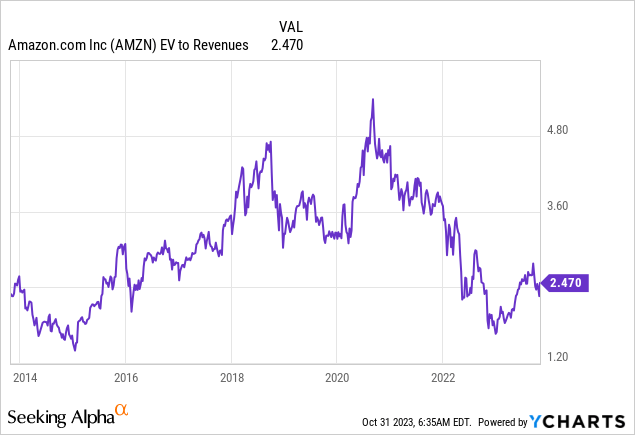
The current EV/Sales is at 2,47 which is also well below the historical average not even mentioning the significant margin improvements.

I also updated my Free Cashflow Model with the following assumptions:
- Average Revenue Growth Rate 2024-2032 at 9%
- Gross Margin steadily improves to 55% in 2032
- Operating Margin increases to 18% in 2032
- Average Amortization & Depreciation at 6% of total revenue
- Average CAPEX at 6,5% of total revenue
- Terminal Growth Rate 2,5%
- WACC at 9,5%
This brings me to a fair value of $195 per share, indicating 50% potential to the latest closing showing that there is still a valuation gap despite a Year-to-date performance of 60%.
Coming to my sum parts valuation it can be seen that the market now at least values the E-Commerce Business in some way. Back in February AWS and Ads alone could justify the Market Cap of 1 trillion dollars.
I slightly increased the fair multiples for AWS, Ads, and third-party due to improved growth perspectives. In total, I arrive at a Market Cap of 1.82 trillion which is around 33% higher than currently.
| 2023e Revenue | P/S Multiple | Fair Value 23 | |
| Online Stores | 229.329 | 0,80 | 183.463 |
| Physical Stores | 19.778 | 1,00 | 19.778 |
| Third-Party | 138.494 | 3,00 | 415.482 |
| Subscription | 40.221 | 4,00 | 160.884 |
| AWS | 91.053 | 8,00 | 728.424 |
| Advertising | 46.752 | 6,50 | 303.888 |
| Others | 4.847 | 2,00 | 9.694 |
| Total | 570.474 | 3,19 | 1.821.613 |
Summary
All in all, I believe that Amazon’s efforts in optimizing its cost structures were not appreciated enough by the market. Amazon delivered an outstanding quarter where it was hard to find room for criticism even for the perma bears.
The company is likely to see Free Cashflow Margins of 11% in 2025 which is impressive while the valuation is historically low. Amazon remains my favorite out of the large Tech-companies and I stick to my strong buy rating.
Analyst’s Disclosure: I/we have a beneficial long position in the shares of AMZN either through stock ownership, options, or other derivatives. I wrote this article myself, and it expresses my own opinions. I am not receiving compensation for it (other than from Seeking Alpha). I have no business relationship with any company whose stock is mentioned in this article.
Seeking Alpha’s Disclosure: Past performance is no guarantee of future results. No recommendation or advice is being given as to whether any investment is suitable for a particular investor. Any views or opinions expressed above may not reflect those of Seeking Alpha as a whole. Seeking Alpha is not a licensed securities dealer, broker or US investment adviser or investment bank. Our analysts are third party authors that include both professional investors and individual investors who may not be licensed or certified by any institute or regulatory body.

