
Summary:
- The estimates maintained in this analysis, which already stood below market consensus, underscore the strength of Nvidia Corporation’s financial prospects.
- With a potential fair price of around $548.29, Nvidia stock could offer a 29.54% upside and a future price estimate of $1658.85 with annual returns of up to 32.9%.
- The conservative nature of these estimates leaves significant room for error, providing investors with a comforting safety margin.
- The “buy” rating on Nvidia remains unwavering, given its robust financial health, strong market presence, and promising return potential.
- Despite potential external risks like economic downturns, Nvidia’s diversified business model and prudent financial management position it to navigate these challenges effectively. Additionally, short-term stock price fluctuations can be viewed as opportunities for long-term investors.
Justin Sullivan
Thesis
In my previous article on NVIDIA Corporation (NASDAQ:NVDA), I recommended a “buy” rating, emphasizing that the stock was fairly valued at that time. However, in light of the recent export restrictions imposed by the Biden administration, I’ve decided to make my conservative models even more conservative by subtracting the annual revenue generated from the Chinese market. The result is a new fair price estimate of $414.5, which is only 2.1% lower than the current stock price of $423.25. Despite this adjustment, Nvidia still holds significant potential for delivering substantial annual returns, and my valuation maintains a healthy safety margin. With all factors considered, I reiterate my “buy” rating for Nvidia.
Overview
In my previous article on Nvidia, I recommended a “buy” rating based on my estimates, which were approximately $20 billion lower than analyst expectations. The stock was trading around the fair values suggested by my models, and its price was aligned with my projections.
Nvidia’s stock price was tracked according to my estimates until unfavorable news emerged. The chips that Nvidia had produced for the Chinese market were no longer suitable for export. Analysts estimated that China accounted for around 25% of Nvidia’s revenue, a substantial portion.
For fiscal year 2025 (corresponding to 2024 in the regular calendar), analysts anticipated Nvidia’s revenue to reach $79.39 billion, while for fiscal year 2024 (2023), the projection was approximately $54 billion.
Revenue Estimates (Seeking Alpha)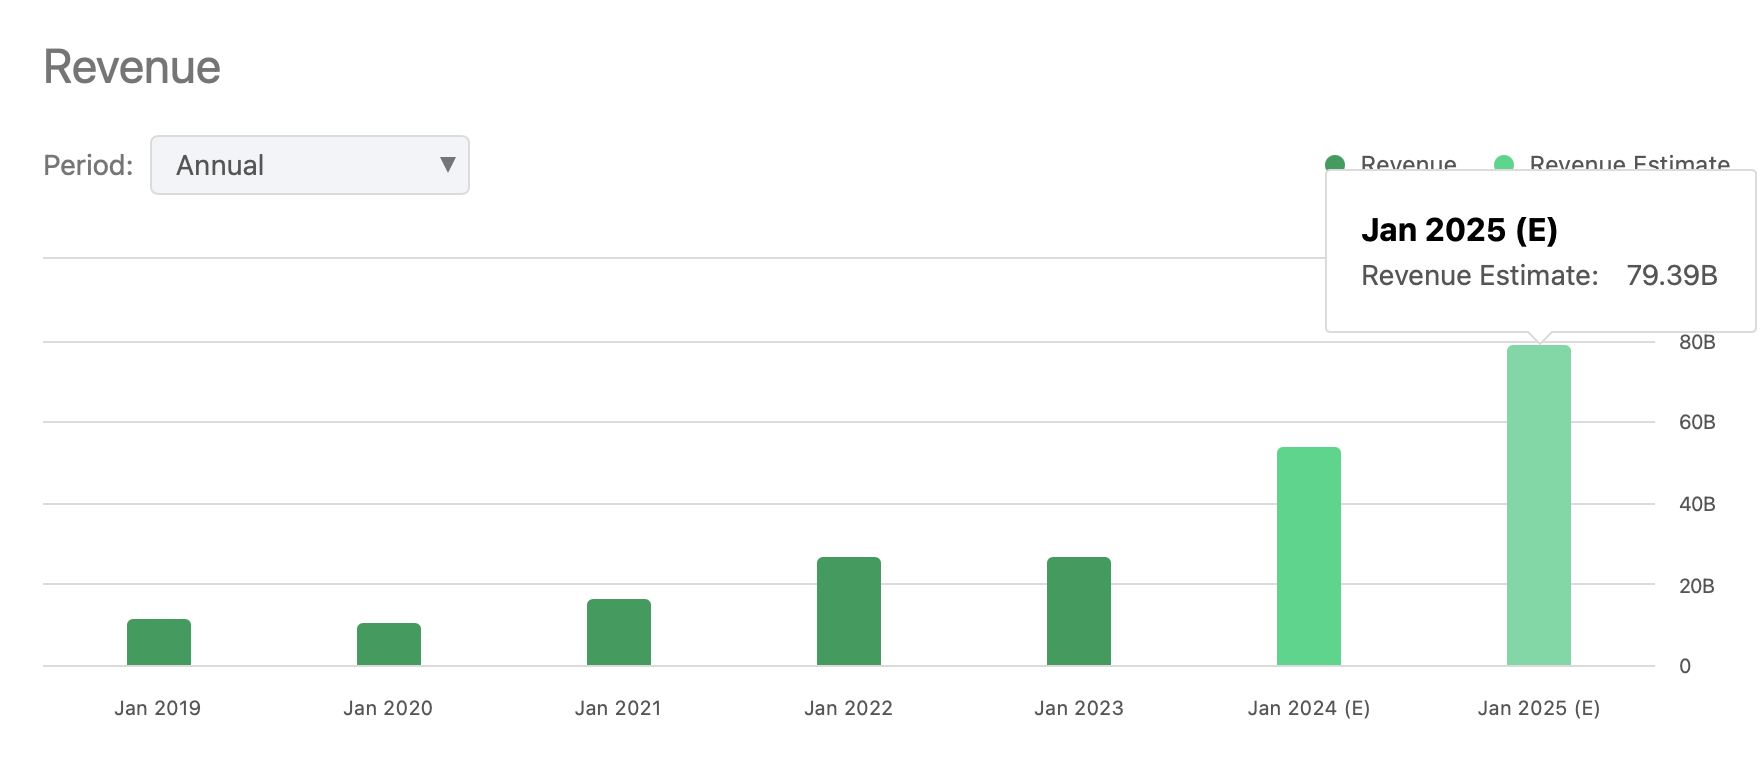
In terms of net income, analysts expected an EPS of $10.90, equivalent to a net income of $27.13 billion, considering the number of shares outstanding (2,489 million). Looking ahead to fiscal year 2025, analysts projected an EPS of $16.66, resulting in an estimated net income of about $41 billion.
EPS Estimates (Seeking Alpha)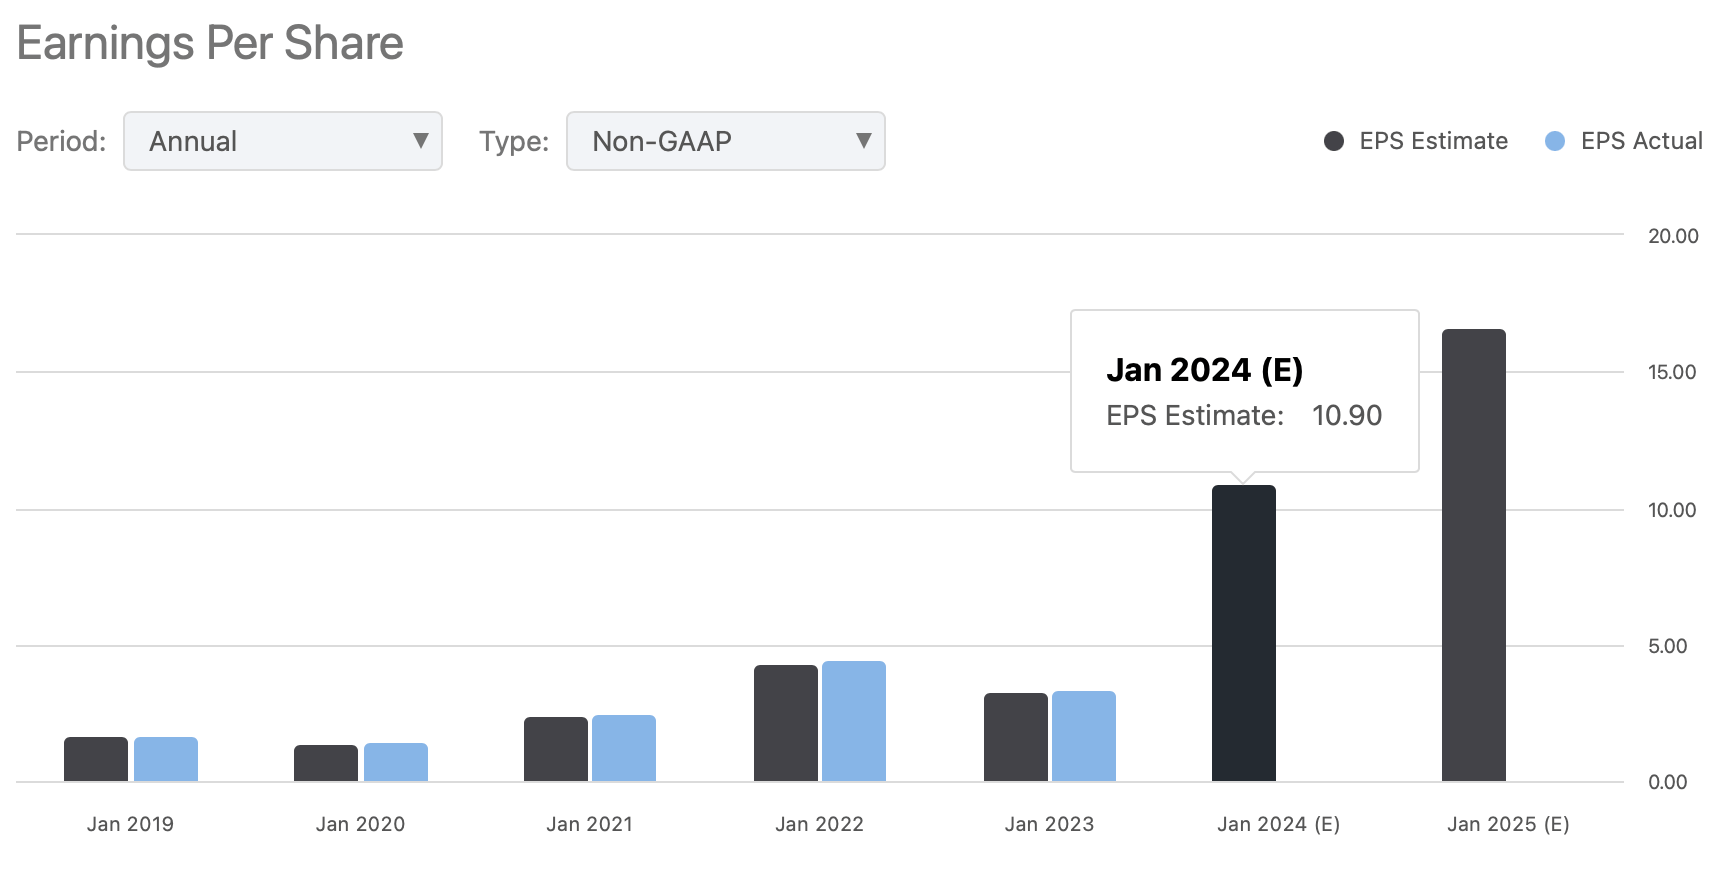
Since Nvidia had not disclosed its Q3 earnings (expected November 21st), the financial metrics I discussed in my initial article about Nvidia still remain relevant.
As the table below shows, China contributed $4.3 billion in revenue for the first half of fiscal year 2024 (2023). When this figure is divided by the total revenue generated during that period, it suggests that Nvidia derived roughly 20% of its sales from China.
Q2 2024 Extract (Nvidia)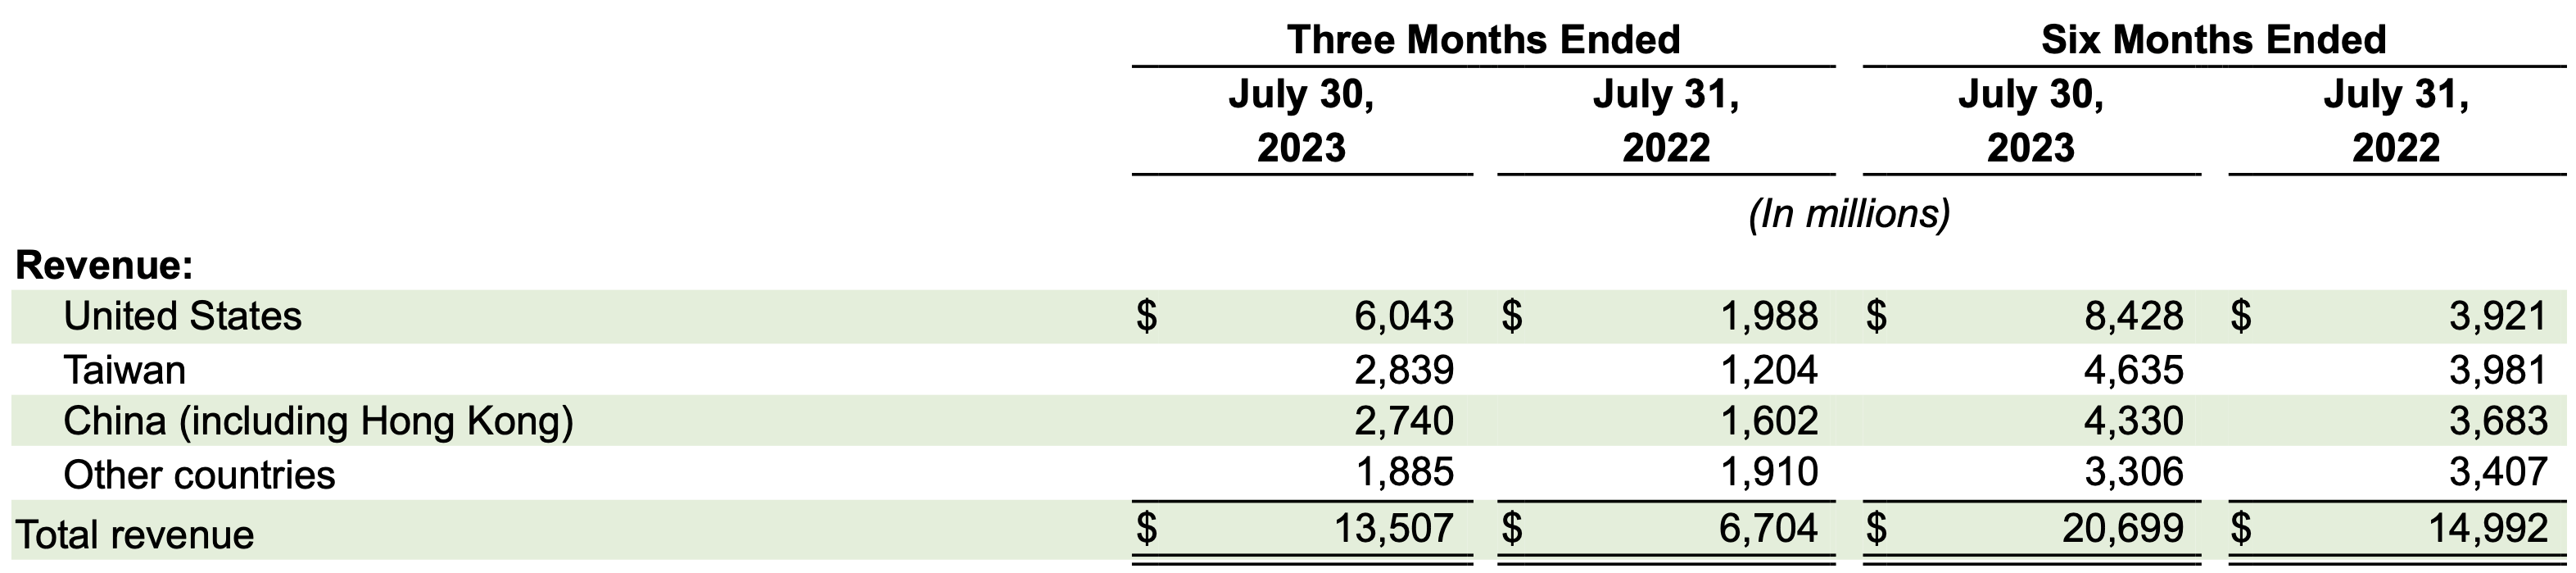
Valuation
As seen in the table above, the annualized impact of China’s absence would be around $8.6 billion. In the valuation section below, I present a new model that considers the subtraction of this $8.6 billion from my previous estimates.
Table of Assumptions (Author’s Calculations)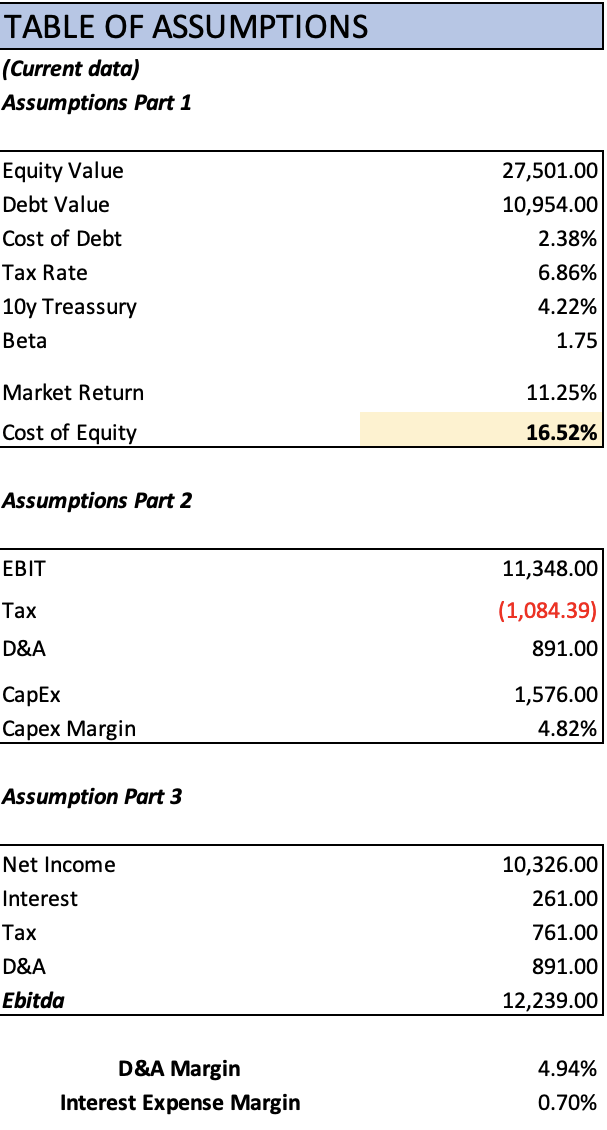
The first step is to recall that the revenue estimates are derived from the expected market revenue growth for each of Nvidia’s segments. These growth rates were discussed in my initial article about Nvidia.
The data center market is expected to grow at a rate of 17.30%, matching the growth rate of the “AI Market.” Cloud gaming and the sale of gaming GPUs are projected to grow at rates of 44.09% and 33.8%, respectively, while the automotive segment is anticipated to grow at a rate of 16.7%. The OEM segment remains relatively constant at $907 million, leaving minimal room for error in this valuation.
The final column reveals the year-to-year growth rates, which are notably lower than what analysts anticipate (43.41% annually).
| Data Center | Gaming | Professional Visualization | Automotive | OEM & Other | Total | Growth % | |
| FY 2024 | 29,517.00 | 12,275.71 | 4,079.00 | 1,094.00 | 907.00 | 47,872.71 | |
| FY 2025 | 34,771.03 | 16,632.47 | 4,474.26 | 1,276.70 | 907.00 | 58,061.45 | 21.28% |
| FY 2026 | 40,960.27 | 22,553.34 | 4,907.81 | 1,489.91 | 907.00 | 70,818.33 | 21.97% |
| FY 2027 | 48,251.20 | 30,607.34 | 5,383.38 | 1,738.72 | 907.00 | 86,887.63 | 22.69% |
| FY 2028 | 56,839.91 | 41,573.60 | 5,905.03 | 2,029.09 | 907.00 | 107,254.63 | 23.44% |
| FY 2029 | 66,957.41 | 56,520.25 | 6,477.22 | 2,367.94 | 907.00 | 133,229.83 | 24.22% |
| FY 2030 | 78,875.83 | 76,913.37 | 7,104.87 | 2,763.39 | 907.00 | 166,564.47 | 25.02% |
| FY 2031 | 92,915.73 | 104,767.82 | 7,793.33 | 3,224.88 | 907.00 | 209,608.75 | 25.84% |
| FY 2032 | 109,454.73 | 142,856.13 | 8,548.50 | 3,763.43 | 907.00 | 265,529.79 | 26.68% |
| FY 2033 | 128,937.67 | 194,998.48 | 9,376.85 | 4,391.93 | 907.00 | 338,611.93 | 27.52% |
To determine the impact of subtracting Chinese revenue, I take the previously mentioned $8.6 billion and project it using the growth rates from the table above. I then subtract these values from my previous estimates.
| China | |
| FY 2024 | 8,600.0 |
| FY 2025 | 10,430.3 |
| FY 2026 | 12,722.0 |
| FY 2027 | 15,608.8 |
| FY 2028 | 19,267.6 |
| FY 2029 | 23,933.8 |
| FY 2030 | 29,922.2 |
| FY 2031 | 37,654.8 |
| FY 2032 | 47,700.6 |
| FY 2033 | 60,829.3 |
The table below illustrates the complete EBITDA calculation. Net income is estimated at 31.5%, closely aligning with Nvidia’s net income margin in fiscal year 2019 (2018) of 31.37%. D&A and interest expenses are calculated with margins linked to revenue, as shown in the table.
| Revenue | Net Income | Plus Taxes | Plus D&A | Plus Interest | |
| FY 2024 | $39,272.71 | $12,406.25 | $13,257.80 | $15,196.69 | $15,471.60 |
| FY 2025 | $47,631.11 | $15,046.67 | $16,079.46 | $18,431.00 | $18,764.42 |
| FY 2026 | $58,096.31 | $18,352.62 | $19,612.33 | $22,480.54 | $22,887.22 |
| FY 2027 | $71,278.87 | $22,517.00 | $24,062.54 | $27,581.58 | $28,080.53 |
| FY 2028 | $87,987.07 | $27,795.12 | $29,702.94 | $34,046.87 | $34,662.78 |
| FY 2029 | $109,296.02 | $34,526.61 | $36,896.48 | $42,292.43 | $43,057.50 |
| FY 2030 | $136,642.31 | $43,165.31 | $46,128.13 | $52,874.16 | $53,830.66 |
| FY 2031 | $171,953.99 | $54,320.27 | $58,048.75 | $66,538.12 | $67,741.80 |
| FY 2032 | $217,829.20 | $68,812.25 | $73,535.45 | $84,289.67 | $85,814.48 |
| FY 2033 | $277,782.65 | $87,751.54 | $93,774.71 | $107,488.84 | $109,433.32 |
Author’s Calculations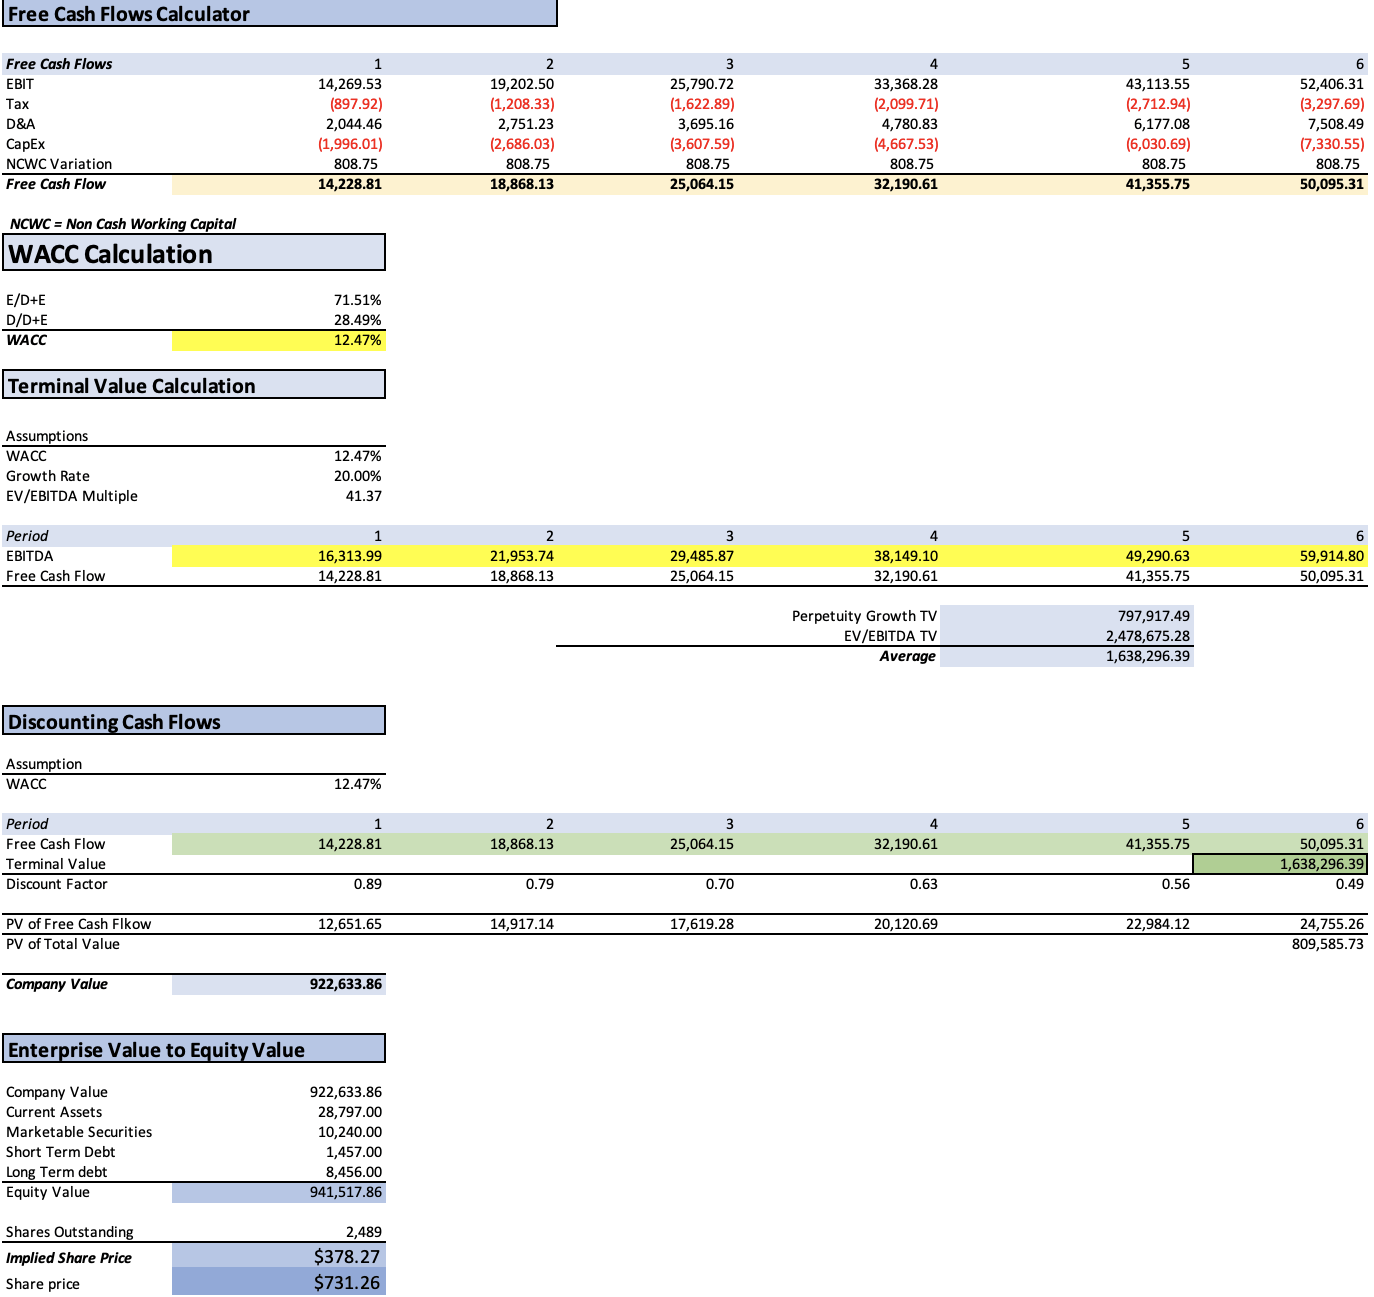
The present fair value of $378.27 suggests a downside of 11.89% from the current stock price of $423.25. Additionally, the future stock price estimate of $731.26 indicates an annual return of 14.54%, which I consider a healthy margin of safety.
The next model extends projections up to fiscal year 2033 (2022), a common approach among analysts. This additional period introduces more future cash flows to the equation, ultimately raising the present fair value of the company.
Author’s Calculations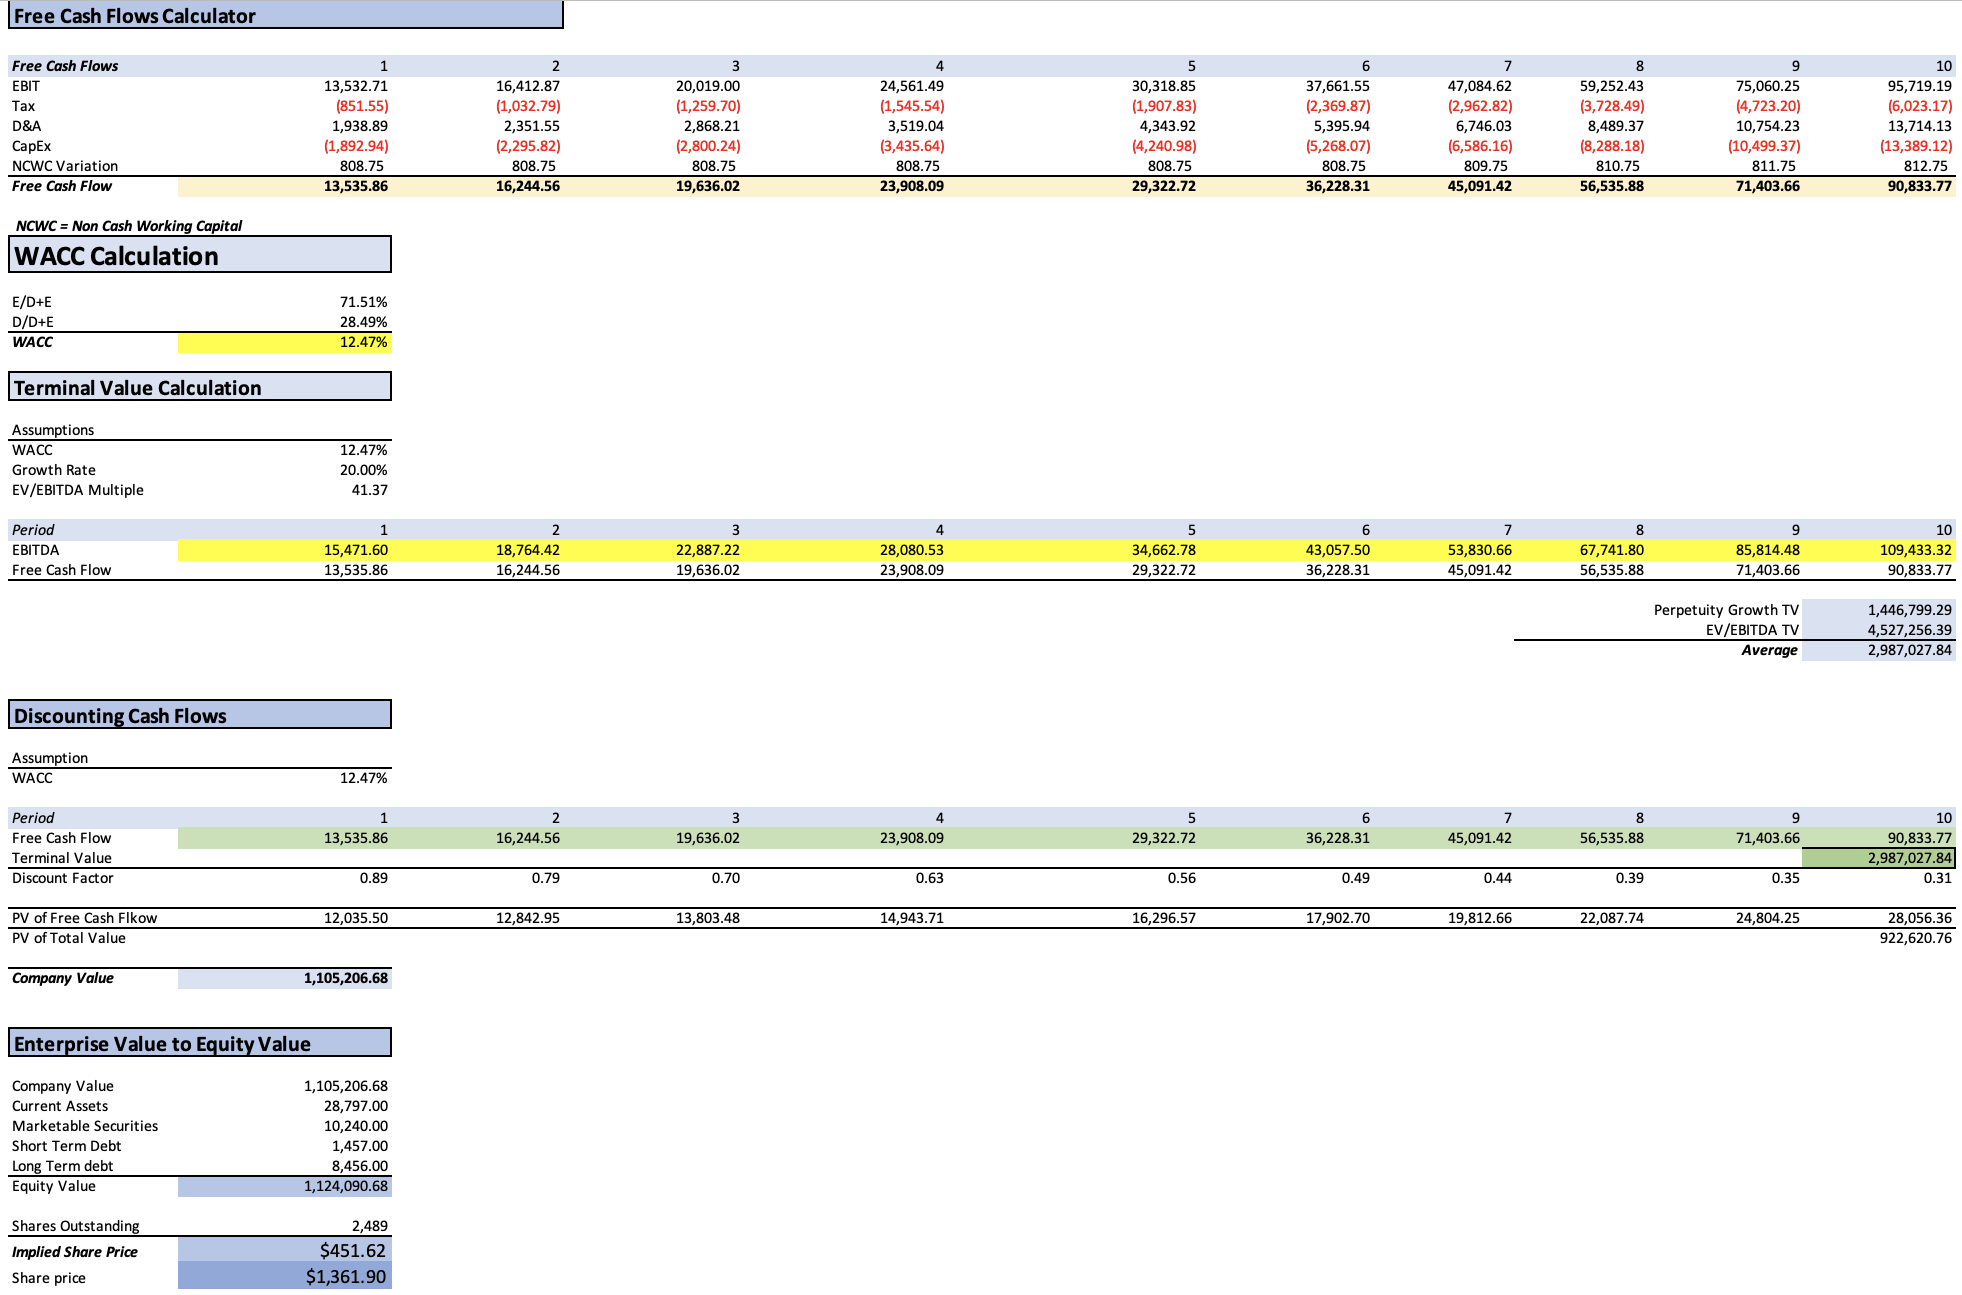
This final model yields a present fair price of $451.62, representing a 6.70% upside from the current stock price of $423.25. The projected future price of $1361.90 implies annual returns of 24.64%.
So What?
I believe that my previous estimates remain valid, especially considering they were already notably lower than analysts’ expectations. Therefore, there is no need to further adjust my already conservative estimates.
| Revenue | Net Income | Plus Taxes | Plus D&A | Plus Interest | |
| FY 2024 | $47,872.71 | $15,122.99 | $16,161.01 | $18,524.49 | $18,859.60 |
| FY 2025 | $58,061.45 | $18,341.61 | $19,600.56 | $22,467.05 | $22,873.48 |
| FY 2026 | $70,818.33 | $22,371.51 | $23,907.07 | $27,403.37 | $27,899.10 |
| FY 2027 | $86,887.63 | $27,447.80 | $29,331.79 | $33,621.43 | $34,229.65 |
| FY 2028 | $107,254.63 | $33,881.74 | $36,207.34 | $41,502.50 | $42,253.29 |
| FY 2029 | $133,229.83 | $42,087.30 | $44,976.13 | $51,553.69 | $52,486.30 |
| FY 2030 | $166,564.47 | $52,617.71 | $56,229.34 | $64,452.63 | $65,618.58 |
| FY 2031 | $209,608.75 | $66,215.41 | $70,760.36 | $81,108.74 | $82,576.01 |
| FY 2032 | $265,529.79 | $83,880.86 | $89,638.36 | $102,747.56 | $104,606.27 |
| FY 2033 | $338,611.93 | $106,967.51 | $114,309.65 | $131,026.92 | $133,397.20 |
Previous Estimates (Author’s Calculations)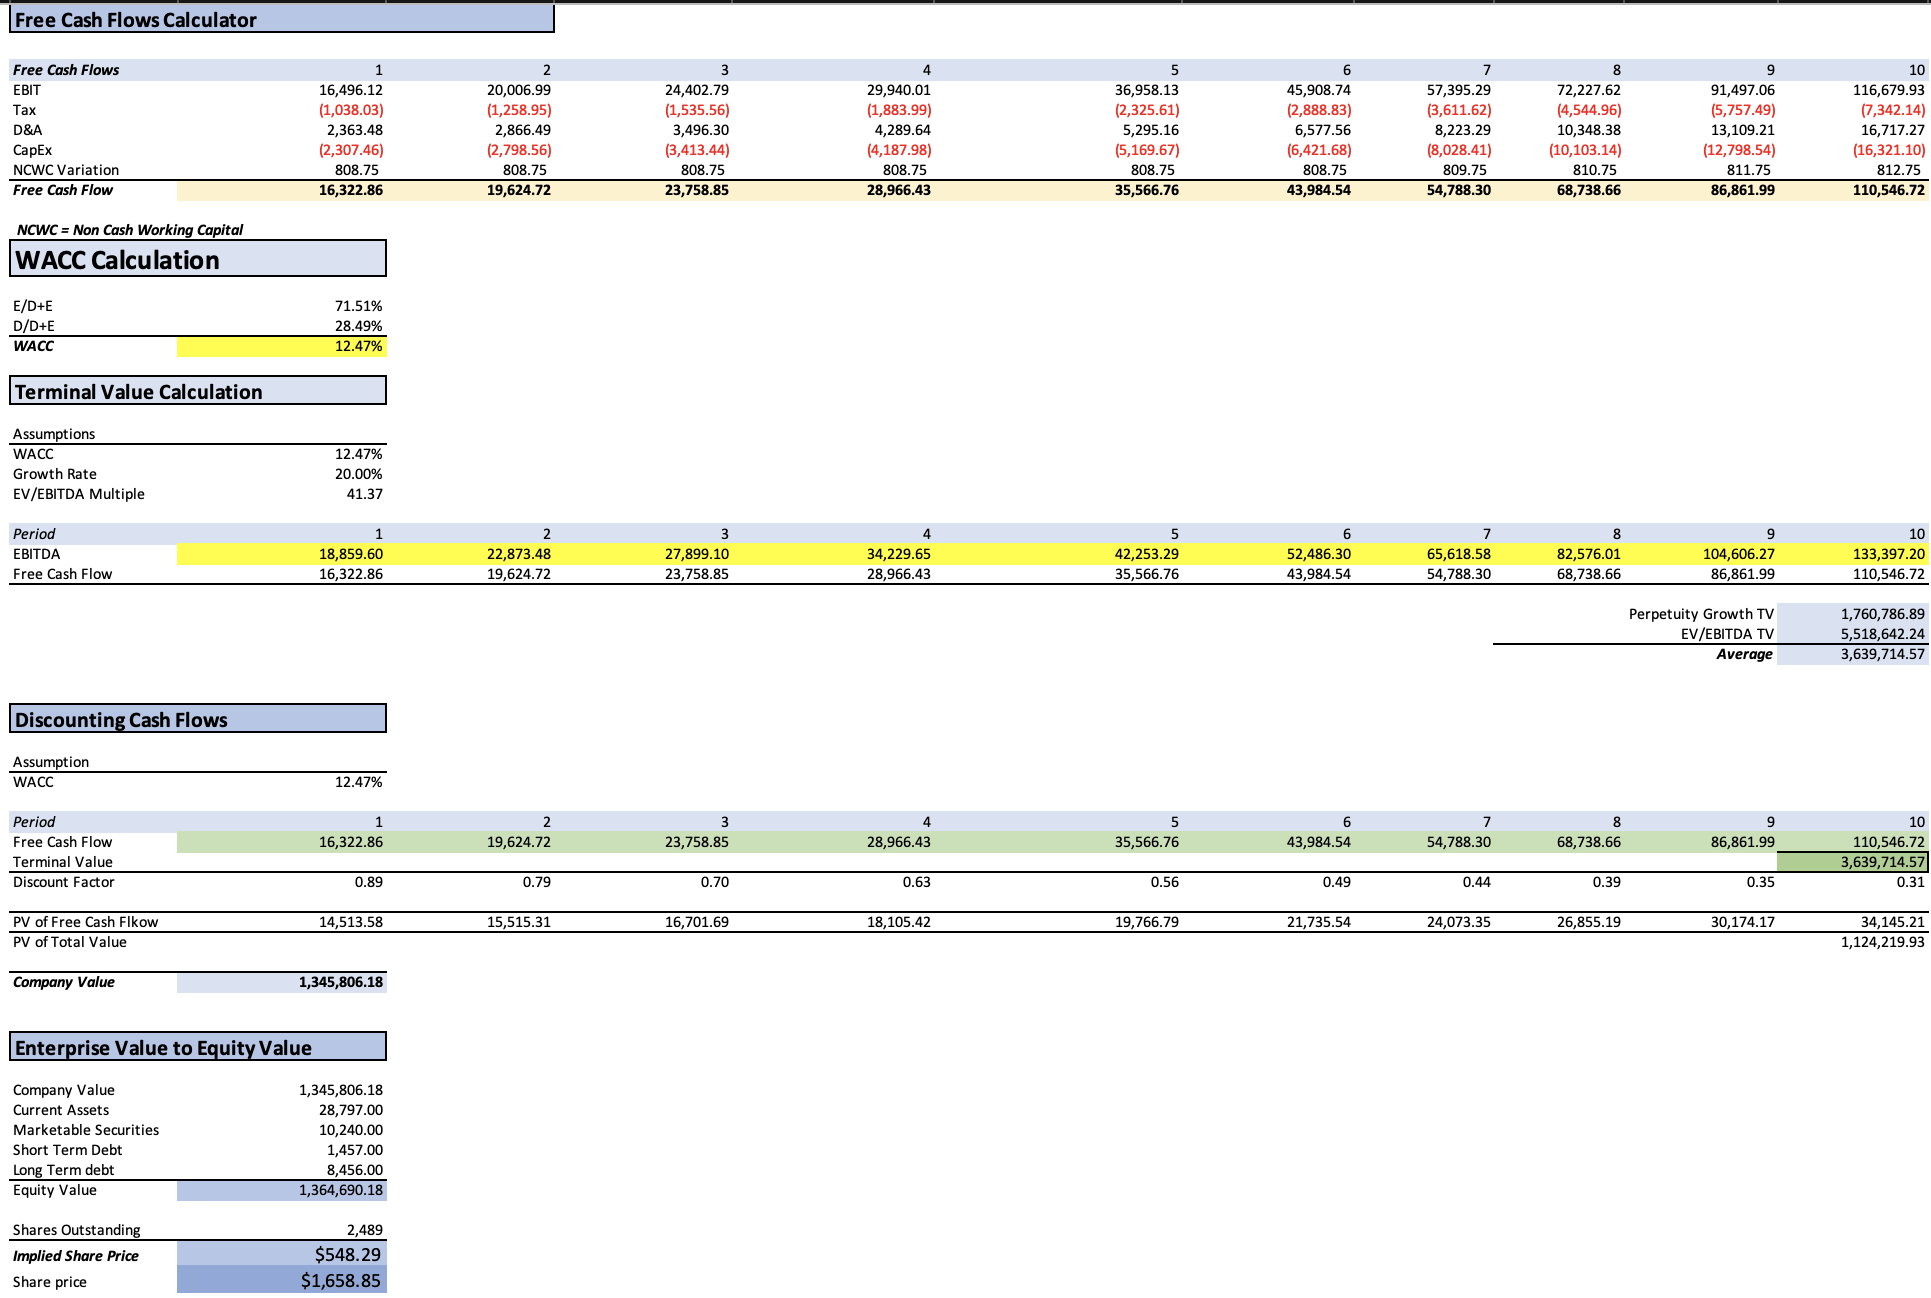
As demonstrated by my previous estimates (which I stand by), Nvidia’s fair price is approximately $548.29, reflecting a 29.54% upside from the current stock price of $423.25. Looking to the future, the estimated price of $1658.85 suggests annual returns reaching as high as 32.9%. It’s worth noting that my estimates maintain a comfortable margin of safety, as they are considerably lower than those of analysts.
For net income, analysts are expecting an EPS of $10.90, which translates to a net income of $27.13 billion, when you multiply the EPS by the number of shares outstanding of 2,489 (In millions). Then for FY 2025, analysts are expecting an EPS of $16.66 which is the equivalent to a net income of around $41 billion.
Risks to Thesis
The primary risk to Nvidia’s optimistic outlook is the potential for an economic downturn. Such a downturn could lead to reduced AI investments and impact the gaming segment. While projecting $56 billion in gaming revenue by 2028 may appear ambitious, any surplus can be channeled to support other segments like data centers and automotive, which may be underestimated in my calculations. Nvidia’s financial stability is robust, characterized by low debt and ample cash reserves. In the short term, a dip in the stock price may occur due to perceived overvaluation. However, this shouldn’t be a major concern, as it presents an opportunity for investors to acquire more shares at a lower price.
Conclusion
In conclusion, my analysis underscores the resilience of Nvidia’s financial prospects, even in the face of unforeseen challenges. The estimates I maintain, which already stood below the consensus of market analysts, continue to reveal an attractive investment opportunity. With a fair price projection of approximately $548.29, representing a robust 29.54% upside from the current stock price of $423.25, and a future price estimate of $1658.85, offering annual returns reaching up to 32.9%, it is evident that Nvidia possesses substantial growth potential. Importantly, my conservative estimates leave ample room for error, providing a reassuring safety margin for investors.
Therefore, I maintain my steadfast “buy” rating on Nvidia, emphasizing its consistent financial health, strong market presence, and potential for remarkable returns. While external risks, such as economic downturns, are always present, Nvidia’s well-diversified business model, coupled with its prudent financial management, positions it to weather such challenges. Furthermore, the current stock price may experience short-term fluctuations, but this should be seen as an opportunity for astute investors to enhance their positions and take advantage of the long-term growth prospects that Nvidia continues to offer.
Analyst’s Disclosure: I/we have no stock, option or similar derivative position in any of the companies mentioned, but may initiate a beneficial Long position through a purchase of the stock, or the purchase of call options or similar derivatives in NVDA over the next 72 hours. I wrote this article myself, and it expresses my own opinions. I am not receiving compensation for it (other than from Seeking Alpha). I have no business relationship with any company whose stock is mentioned in this article.
Seeking Alpha’s Disclosure: Past performance is no guarantee of future results. No recommendation or advice is being given as to whether any investment is suitable for a particular investor. Any views or opinions expressed above may not reflect those of Seeking Alpha as a whole. Seeking Alpha is not a licensed securities dealer, broker or US investment adviser or investment bank. Our analysts are third party authors that include both professional investors and individual investors who may not be licensed or certified by any institute or regulatory body.