Summary:
- Under current market conditions, our view is that playing defensive is more important than pursuing growth.
- Against this overall backdrop, this article explains why Johnson & Johnson is a good defensive stock.
- Johnson & Johnson satisfies all the requirements that Benjamin Graham promoted for picking defensive stocks.
- Notably, it’s also trading at a sizable discount from the overall market and also the Graham P/E (by about 12%).
takasuu/iStock via Getty Images
Thesis
We keep reminding our readers – and ourselves – that in investing, avoiding losses is more important than achieving gains (even though the latter always FEELs better). The reason is a simple math fact – because compounding is mathematically asymmetric. A 10% loss requires more than a 10% gain to break even. When you actively withdraw, a loss can hurt even more. We feel this is particularly important under current market uncertainties, ranging from the direction of inflation, the possibility of interest rate changes, and also the likelihood of a recession.
Against this background, the thesis of this article is to explain why Johnson & Johnson (NYSE:JNJ) is a good defensive stock. Since we are talking about defensive stocks, it is only fitting to follow the framework developed by Ben Graham in his The Intelligent Investor. The remainder of this article will show that:
- JNJ meets all the requirements described by Graham. It is a prominent company with conservative financials, it has a strong dividend record, and it has been demonstrating superbly consistent growth.
- At the same time, the stock is also currently trading at a sizable discount (about 12% based on my analysis) from the Graham P/E, providing an extra layer of margin of safety.
Graham on defensive stocks
For readers not familiar with Graham’s framework, the following is a brief summary. It is a checklist that I compiled from his writings. More details can be found in our earlier article.
- Is the company large, prominent, and conservatively financed? The specific metrics to look for are stable financial strength, consistent capital structure, and a long record of continuous dividend payments.
- Especially the dividend record. Graham emphasized countless times the importance of dividend records – for good reasons. In his own words, he thinks “a record of continuous dividend payments for the last 20 years or more is an important plus factor in the company’s quality rating.”
- Has the company demonstrated an adequate level of Earnings Growth in the past? For defensive investors, growth is not the key and “adequate” is enough. In Graham’s mind, a minimum increase of at least one-third in per-share earnings in the past ten years is adequate enough.
- Finally, are the valuation multiples moderate? As a value investor to the core, he also recommended a series of methods for investors to gauge the price they should pay. And also, being fully aware of the uncertainties in his own method, he emphasized that you should always leave a safe margin of safety.
JNJ: prominence, financial strength, and dividend
Johnson & Johnson meets many of the above requirements obviously – so obviously that I will risk boring my readers if I go into them. I will just take it as self-evident that JNJ is a large and prominent company with a record of continuous dividend payments for more than 20 years (far more). The company has demonstrated a consistent level of earnings growth in the past 10 years at a rate of around 6.5% (in terms of EPS), far exceeding Graham’s minimum requirements for growth.
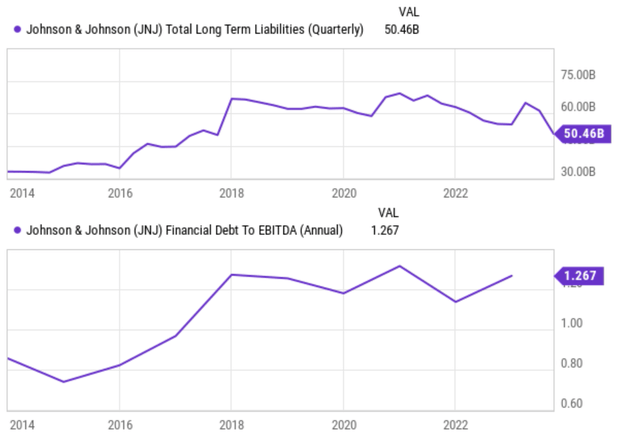
In the remainder of this article, I will examine the less obvious aspects more closely. More specifically, I will examine its financial position and also its future growth prospects. The company has always been in a strong financial position historically (say, over the past 2 decades), and its current financial position is near the strongest point in a decade in my view thanks to a variety of factors. It has consistently generated strong operating cash flow, which has allowed the company to repay debt and make significant investments in its business. It has also divested some of its non-core assets recently, which has generated cash that has been used to repay debt.
The end result, as seen in the chart below, is a substantial decrease in its total debt in recent years. To wit, its total long-term liabilities have been reduced from about $70B to the current level of ~$50B (see the top panel). Combined with robust earnings, its debt/EBITDA ratio now sits around 1.27x, the peak level in a decade (see the bottom panel).
Growth outlook and valuation
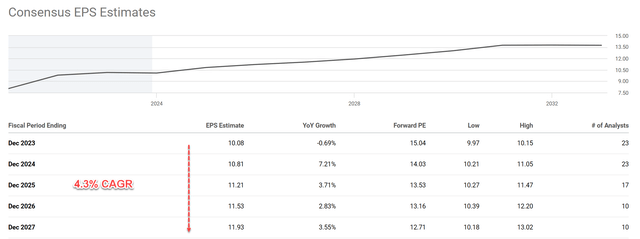
A strong financial position is half of the growth equation as it provides the capital to be employed towards growth. The other half of the equation is a robust return on the capital employed (i.e., ROCE), which JNJ also enjoys. Thanks to this powerful combination, both the company’s own management and consensus estimates expect a healthy level of growth rate in the long term. As seen from the chart below, consensus estimates expect an EPS growth from $10.08 in 2023 to $11.93 in 2027, translating into an annual growth rate of 4.3%.
My view is that the above consensus estimates are on the conservative side. In the past decade, JNJ has been maintaining a consistent ROCE on average of 50.7%, as shown below. Note that due to the significant role of pharmaceuticals in its business, I’ve analyzed its ROCE in two different approaches. In the first approach, I’ve included its intangible book value (such as its intellectual properties) as part of the capital employed. And in the second approach, I’ve included its R&D expenses as part of its capital employed. As you can see, both ways yielded similar results. With a 50.7% ROCE, a 10% reinvestment rate (which is close to its historical average) could lead to a 5.07% growth rate already. Note that this is real growth before inflation escalation.
Author based on Seeking Alpha data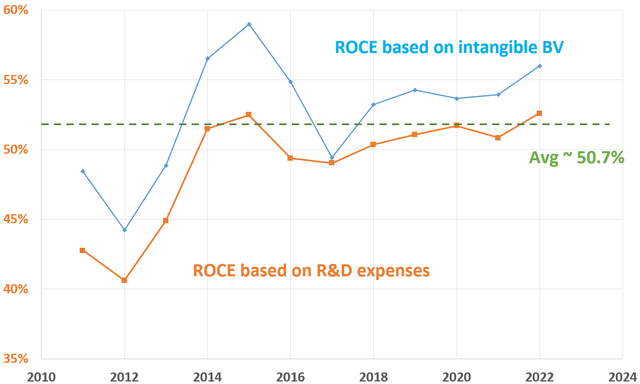
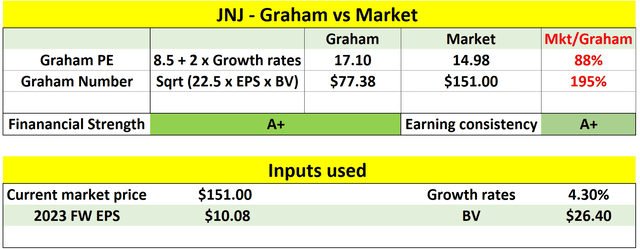
Even based on a 4.3% growth rate forecasted by the consensus estimates, the so-called Graham P/E for JNJ would be about 17.1x for the stock as shown in the chart below. For readers new to the concept, the Graham P/E is computed as 8.5 plus twice the projected annual growth rate (only the numerical value without the percentage sign). As such, JNJ is now trading at a P/E (~15x as of this writing) of about 12% discounted from the Graham P/E.
Risks and final thoughts
Investment in Johnson & Johnson certainly entails some risks. Some of these risks are common to the healthcare sector (such as the uncertainties associated with its pipelines) and some of more unique to itself. Here I will only focus on the risks that are more particular to JNJ and the approach I used in this article.
Many pharmaceutical companies face lawsuits, and JNJ is no exception. However, JNJ sometimes faces unusually large litigations given its scale and reach of customers. Two notable recent examples would be sufficient to illustrate my point. The first one involves its talc-based products (such as baby powder) and the second one involves its marketing of opioids. Also, it is important to point out that my above valuation analysis based on the Graham P/E has uncertainties and limitations too. Other valuation metrics could suggest different levels of discounts. For example, the so-called Graham number (detailed in this link) suggests a large overvaluation, as shown in my table above. However, my view is in JNJ’s case, the Graham number failed to consider its relatively high ROE and thus resulted in an underestimate of its valuation.
To conclude, given current market uncertainties, we believe the benefits of a defensive strategy outweigh the potential gains of a growth strategy. And in Graham’s mind, defense stocks mean high-quality stocks with reasonable valuations. JNJ is an excellent fit for this strategy, checking off all the boxes in Graham’s checklist: prominence, strong financials, superb dividend record, and healthy and consistent growth. Finally, the stock is also trading at a very reasonable valuation of ~15x P/E, a sizable discount from the overall market (about 25x), its historical average (about 17.5x), and also the Graham P/E (about 17.1x).
Analyst’s Disclosure: I/we have no stock, option or similar derivative position in any of the companies mentioned, and no plans to initiate any such positions within the next 72 hours. I wrote this article myself, and it expresses my own opinions. I am not receiving compensation for it (other than from Seeking Alpha). I have no business relationship with any company whose stock is mentioned in this article.
Seeking Alpha’s Disclosure: Past performance is no guarantee of future results. No recommendation or advice is being given as to whether any investment is suitable for a particular investor. Any views or opinions expressed above may not reflect those of Seeking Alpha as a whole. Seeking Alpha is not a licensed securities dealer, broker or US investment adviser or investment bank. Our analysts are third party authors that include both professional investors and individual investors who may not be licensed or certified by any institute or regulatory body.
As you can tell, our core style is to provide actionable and unambiguous ideas from our independent research. If your share this investment style, check out Envision Early Retirement. It provides at least 1x in-depth articles per week on such ideas.
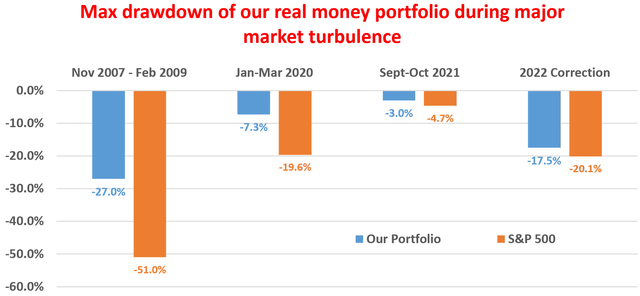
We have helped our members not only to beat S&P 500 but also avoid heavy drawdowns despite the extreme volatilities in BOTH the equity AND bond market.
Join for a 100% Risk-Free trial and see if our proven method can help you too.
