Summary:
- AT&T is showing signs of a potential turnaround, having gained the support of the 200-day moving average.
- AT&T remains in its 8-year downtrend, but this could be the run that breaks the trend.
- Current price target of $18.10.
Brandon Bell
AT&T (NYSE:T) is a stock that seems to capture a wide variety of opinions. Some love it, some hate it. Some will never sell it, others wouldn’t touch it with a 10-foot pole. Taking out all of the noise around a stock is really important when it comes to investing decisions. When it comes to that part of a decision, I always rely on technicals. That’s not to say I don’t do my due diligence on the fundamentals, but I find if you map out both a bull & bear case technically, you find yourself with a good game plan should the fundamentals change. I have written on AT&T several times in the past, most recently this past January. Things were going according to plan, up until AT&T flopped on earnings and sent the stock tumbling back down. Fast-forward almost a year and I think the stock has bottomed and we could be on the way back up towards $18.10 and beyond.
Concerning the fundamentals, I still think the company is headed in the right direction, albeit slowly. As per the latest earnings report, debt is being paid down, subscribers are up, and the dividend is growing & secure at just under 7%. With that said, let’s dive into the technical picture.
Where Do We Go From Here?
As mentioned, I have been wrong on this one a few times. Regardless of how the earnings looked or the dividend paid, the stock kept falling. I’ll get to where I was wrong in a little bit. But let’s look at what could happen.
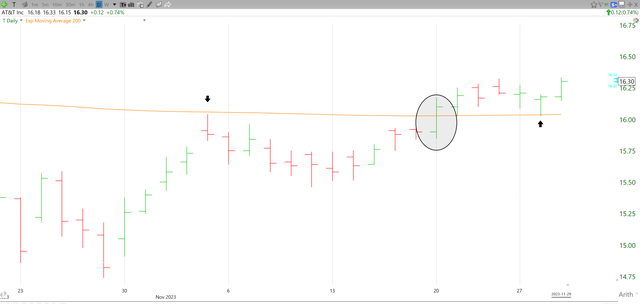
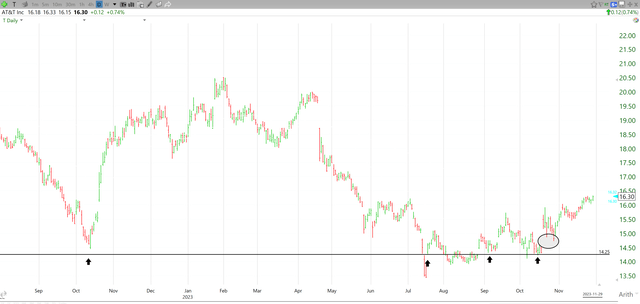
First off, we have seen a pretty important move across the 200-day moving average. The stock has not been above the moving average since April. It was news that sent it down 10% in a single day. It’s amazing what quarterly results will do to a stock. However, just as we thought the stock might be breaking out, it crashed back to earth. What’s important about this recent move is that we saw a test of the moving average on November 3rd, and then the stock retracted. Then we bust through the moving average on November 20th and then had a retest on the 28th. The picture below helps show exactly how this played out.
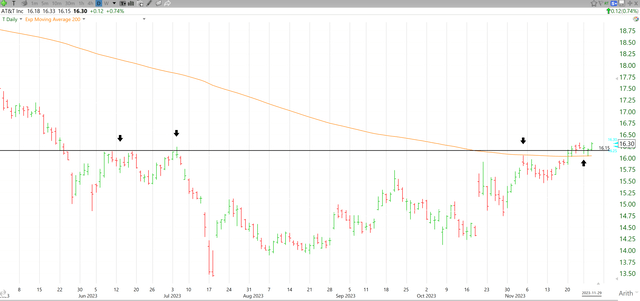
As soon as we have that positive re-test, it’s game on. Even better, this moving average break is tied to an important level this year. Looking below you can see that $16.15 was where we saw the triple top this last summer. To have both the 200-day moving average and $16.15 behind the stock is very positive.
Does that mean we could see the stock run here? Yes, it does. Just how long will it run for? Well, I have two targets for the stock. $18.10 short-term and $19.60 medium-term. Starting with $18.10, if we can hold the $16.15 line, this is the next point of serious resistance that lies ahead. This is about 11% from current levels, which most shareholders would be pretty happy with. Especially after adding on that dividend. Just as we saw the stock reject the moving average the first time around, I would expect something similar here should we get to the $18.00 range.
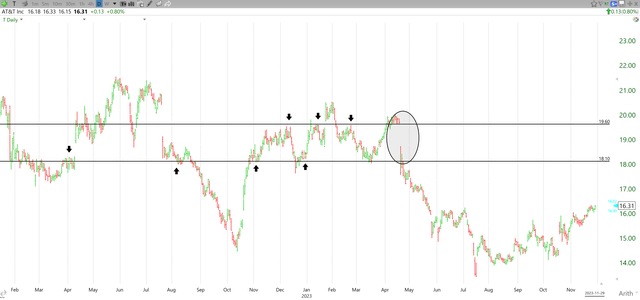
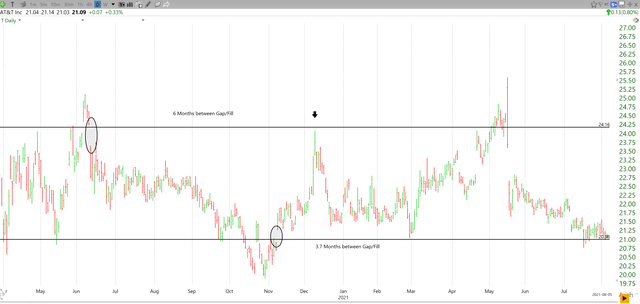
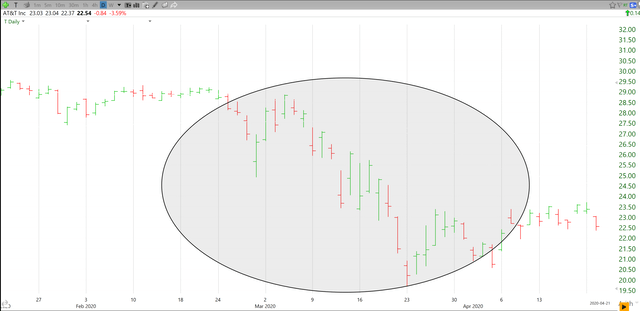
The second target is $19.60. This is based on the stock-filling gaps. What I mean by this is that when there is a larger swing in price overnight, the stock leaves a gap, which I have circled above. Lucky for us, AT&T has a really strong history of filling previous gaps. What this means is that we will likely see $19.60 again one day. When? Who knows. This can work both for and against the stock. Looking below, we see two examples of this in 2020/21. The first we saw the gap down gets filled 6 months later. The second, we saw the gap up get filled 4 months later.
Even if you go back to the Covid crash, you will see there are no gaps on the chart, and every day we were waking up to massive moves in the market. They always got filled before resuming its way back down. Is this a foolproof method? No, if it was, I wouldn’t be out here writing articles in my spare time. But, there are enough cases of it happening not only in AT&T but across several stocks and indices. Thus giving us a clear medium-term target to strive for.
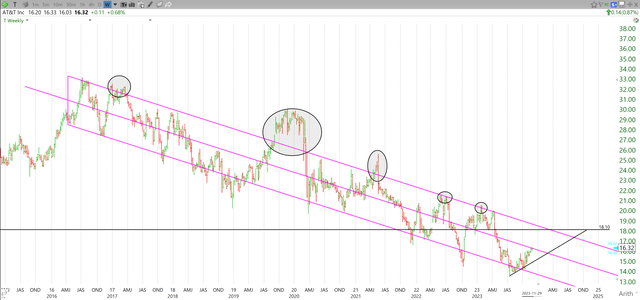
So where have I gone wrong in the past? Well, that’s not siding with the general trend of the stock. I had even posted this exact chart in previous articles, yet still bet against it. Now, if you had the stop in place that I suggested, you would have been out around $18.50. Regardless, it’s a loss. Looking below, you can see this updated chart. You can see the general trend is still trending down, and it has been since 2016. We have had multiple false breakouts and they have all led to lower lows a few months later. Be it earnings, or a global pandemic, it doesn’t matter. They all have the same result.
Now, I am recommending buying back into AT&T as we have busted through the 200-day moving average and crossed the midpoint in the trend. We should definitely see another test of the top line, which also happens to correspond with my short-term target of $18.10. I think the chart above may be the most important chart to keep an eye on. A lot of money could have been made had one simply traded the top and bottom touches. Until we get a breakout and a positive re-test, it’s hard to ask for more than $18.10.
Most importantly, let’s not forget about the stop. I have my stop currently set at $14.25. The reason for this is similar to my mid-range target. There is a gap that was not fully filled just above my stop. We also have a point of previous support right above the stop. This leaves about a 12% potential downside. If we see continued positive trends, I will be looking to move my stop up as quickly as possible to protect capital.
Wrap-Up
As you can see, the stock appears to be turning a corner. I can’t say this enough, regardless of your opinion, always set stops. You can always buy back in. But it’s a lot easier to use a clear headspace when your cash is on the sidelines. This is a stock that has turned into a value play, and it’s not going to be flashy. It’s slow and steady. They will disappoint on earnings again at some point. It’s inevitable. With clear targets and stops in place, you can ignore the noise and enjoy the ride. The dividend is a nicer kicker to collect while you wait. Sit back, relax, and enjoy the ride to $18.10 and beyond.
Analyst’s Disclosure: I/we have a beneficial long position in the shares of T either through stock ownership, options, or other derivatives. I wrote this article myself, and it expresses my own opinions. I am not receiving compensation for it (other than from Seeking Alpha). I have no business relationship with any company whose stock is mentioned in this article.
Seeking Alpha’s Disclosure: Past performance is no guarantee of future results. No recommendation or advice is being given as to whether any investment is suitable for a particular investor. Any views or opinions expressed above may not reflect those of Seeking Alpha as a whole. Seeking Alpha is not a licensed securities dealer, broker or US investment adviser or investment bank. Our analysts are third party authors that include both professional investors and individual investors who may not be licensed or certified by any institute or regulatory body.

