Summary:
- Amazon’s ROIC is back on the rise and appears to be normalizing.
- Not everything is as good as it seems at first glance, especially with respect to FCF.
- AMZN is well-positioned to benefit from current trends and is likely to capitalize on them.
FinkAvenue
The Amazon Investment Thesis
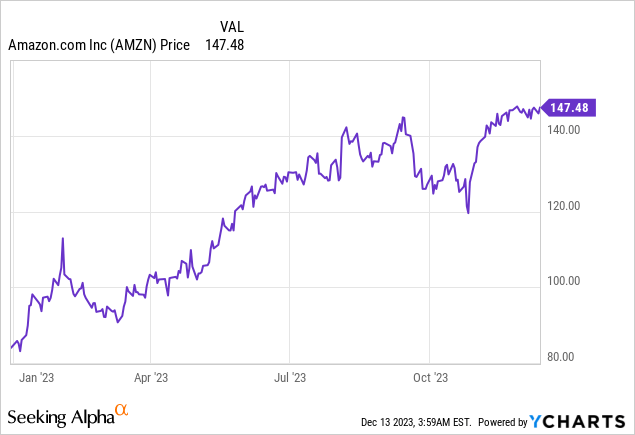
Amazon.com, Inc. (NASDAQ:AMZN) has outperformed the S&P 500 (SPY) by a mile so far this year thanks to 3 strong quarters and good execution. But like any company, Amazon has its good and bad sides, and it will be important to determine which sides outweigh the others. In my opinion, the positives clearly outweigh the negatives because the growth opportunities and the quality of Amazon’s business are phenomenal.
But let’s take a closer look at the business so you can see why I came to this conclusion.
AMZN’s Metrics and Balance Sheet
Amazon has $49,605 million in cash and $14,564 million in short-term investments compared to $67,698 million in long-term debt. So their cash and short-term investments are almost enough to pay off all their debt if they wanted to. In addition, they have a TTM net income of about $20,079 million, which makes the debt less than 4 times the net income, and therefore I consider it safe. So, the balance sheet and leverage situation should not be a concern for investors.
Adjusted FCF on a TTM basis was $21,400 million, but, unfortunately, this was offset by $23,310 million in TTM SBC that Amazon paid to its employees. So the SBC adjusted FCF is $-1.910 million. SBC was 19,621 million in December 2022 and 12,757 million in December 2021, so SBC costs remain a critical issue. Sure, you have to pay them to stay competitive, but they have almost doubled in two years. That could spell trouble down the road.
But Amazon is not alone with this problem and it is more of a trend of today’s time to pay SBC and from an accounting standpoint, it is understandable as FCF looks better when you pay SBC instead of higher salaries. As FCF has become a very important metric in recent years, one can understand it, but therefore one should always adjust FCF to SBC to get a better picture.
ROIC and Capital Allocation
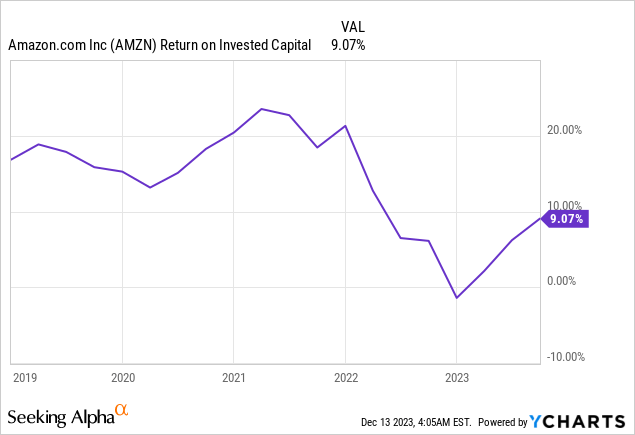
As a result of investments in the infrastructure of AWS and the expansion of the fulfillment network in the U.S. to ensure future growth, ROIC suffered somewhat. From a strong number in the low 20s, it briefly turned negative but has since moved back up. And it is quite likely that we will see returns on capital in the 20%+ range again as Amazon’s investments bear fruit.
In a paper on ROIC, Professor Mauboussin explained that companies with rising ROIC are among the best investments, and this probably explains a good part of the rise in Amazon’s stock price in 2023.
The investments, and therefore the capital allocation, that Amazon has made have been exactly the right thing to do. The expansion of the fulfillment network to 8 different regions will result in shorter distances, which will reduce costs and shorten delivery times. And that benefits the customer, which strengthens Amazon’s competitive advantage. It also puts pressure on the competition, forcing them to invest more if they want to offer their customers the same customer service as Amazon. And customer service through delivery times, return policies and price advantages is Amazon’s key competitive advantage in this segment.
Customer loyalty through Amazon Prime, which is similar to the Costco (COST) model, has also played a huge role in Amazon’s success, as they provide customers with a huge ecosystem with Prime Video and all the other services they offer. As a result, customers are more loyal to Amazon and make repeat purchases. The collaboration between Shopify (SHOP) and Prime also makes it easier for customers to buy, which leads to more business for Amazon.
In general, I see large investments in R&D as a positive thing if the company can get an excellent return on them. And in normal times, when Amazon has a 20% ROIC, they have a huge ROIC-WACC spread and therefore create a lot of value for shareholders. Right now, I would say that Amazon has a WACC of about 7% to 8%, derived from a cost of equity of 8% and a cost of debt of 4.5%. That would make the spread slightly positive right now at 1% to 2%, but if they go back to the 20% of the past, that would put them at a very strong 12% to 13% spread.
Valuation Vs. Competition
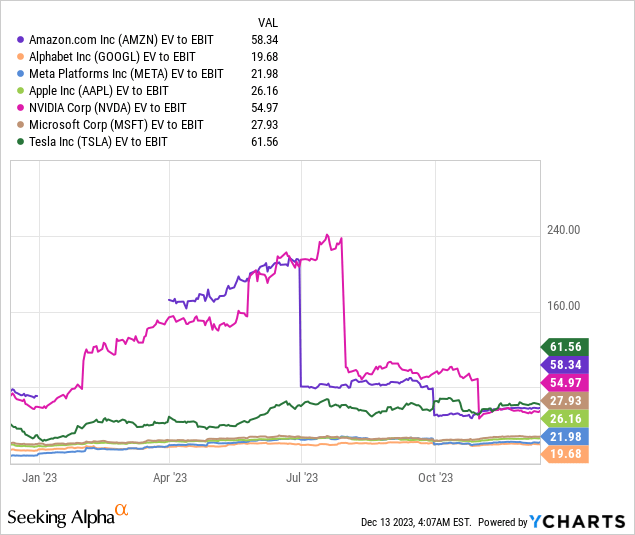
The magnificent seven, Alphabet (GOOGL), Meta Platforms (META), Apple (AAPL), NVIDIA Corp. (NVDA), Microsoft (MSFT), and Tesla (TSLA) are the best comparisons due to their size and the many overlaps in their businesses. At first glance, if we just look at the EV/EBIT multiple, they do not look undervalued, although we could argue that Meta and Alphabet are fairly valued from a multiple perspective alone.
However, we need to consider the quality of the business, barriers to entry, and future growth opportunities and normalized earnings to get a better picture. And a lot of people in the past underestimated the growth potential of these companies and thought the valuations were way too high, but the magnificent seven have outperformed expectations tremendously.
The demand for AWS and Amazon Bedrock from generative AI, which is still in its infancy, will be huge. Bedrock will help customers get easy access to leading LLMs, and AWS, as the leader in the cloud space, will provide the cloud infrastructure. This is in addition to its advertising business, which is growing 25% year over year. Amazon has millions of customers and their data, so they can target customers extremely well, and they can also integrate the ads into video, audio, and shopping. They can also improve their targeting with machine learning. So it will be interesting to see how ads are received in Prime Video. They will start in early 2024 and customers will have the option to pay $2.99 more to get rid of ads or keep the old price and see ads from time to time.
With the huge growth opportunities, Amazon’s valuation suddenly looks less expensive, even though it is not cheap and probably never will be. However, because the competition has similar growth opportunities, some of the competitors are likely to have more attractive valuations when we take everything into account.
Amazon’s Reverse DCF
I am a big fan of reverse DCF to see what is priced into the stock. And if we take the TTM diluted EPS of $1.92, we get the following results if we want a 15% annual return. A 22% annual EPS growth rate is priced in. On a historical basis, the diluted EPS growth rate is 16.56% for the last 5 years and 63.83% for the last 10 years. So, on a 5-year basis, the shares look overvalued, but if they can achieve the 10-year growth rate, the shares are massively undervalued.
However, I think the $1.92 is too low and on a normalized basis EPS is more in the $3.00 range.
So on a normalized basis, only 16% annualized diluted EPS growth is priced in, which is pretty much in line with the 5-year trend. So I think the stock is probably fairly valued and maybe even a little bit undervalued when the investments of the last few years are reflected in earnings growth.
What could EPS look like in 5 years?
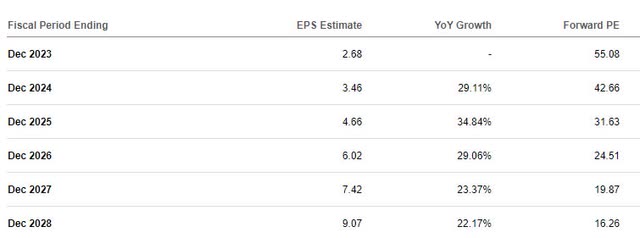
Seeking Alpha sees EPS of $9.07 in December, which is a 22% growth rate and would lead to a stock price of ~$450 if we take a 50x multiple, which could be historically appropriate. I would estimate the EPS a bit lower at about $8.00 and therefore a 50x multiple would be $400. Still, both estimates give investors a strong upside over 5 years, and even if the stock is only $300 in 5 years, investors will likely have easily beaten the SP500.
Risks for Amazon
The escalating cost of SBC is definitely Amazon’s weakness, and the relatively strong competition in almost all of its businesses is also something that could lead to problems in the future. In the long term, strong competition often leads to lower margins for everyone in the industry. In addition, Amazon may be entering too many different markets, sometimes relatively far away from the core market, which could lead to “diworsification”.
Is Amazon A Buy, Hold or Sell?
However, Amazon’s strong execution, management’s long-term outlook, and exceptional growth opportunities are the strengths of the business that I believe outweigh the risks. AWS, with its ~30% operating margin, is a higher margin business than advertising and retail, and AWS is back in growth mode. Right now, AWS is only ~16% of total revenue, but it will likely be a higher percentage going forward, which would lead to higher margins for Amazon overall.
In addition, Amazon’s black box is likely to contain one or two surprises due to its high R&D spending. So I think Amazon will be a better company in 5 years than it is today, and that should be reflected in earnings. So let us not make things too complicated and try to keep it as simple as possible. We know that this company is a big part of a lot of people’s lives and probably will be for a long time. If Amazon were to disappear, a lot of people would feel it very strongly in their lives, and it would make life more difficult for both individuals and businesses.
Therefore, my conclusion is that Amazon deserves a Buy rating based on its untapped potential and outstanding management team, which should just be careful not to escalate SBC costs.
Analyst’s Disclosure: I/we have no stock, option or similar derivative position in any of the companies mentioned, but may initiate a beneficial Long position through a purchase of the stock, or the purchase of call options or similar derivatives in AMZN over the next 72 hours. I wrote this article myself, and it expresses my own opinions. I am not receiving compensation for it (other than from Seeking Alpha). I have no business relationship with any company whose stock is mentioned in this article.
Seeking Alpha’s Disclosure: Past performance is no guarantee of future results. No recommendation or advice is being given as to whether any investment is suitable for a particular investor. Any views or opinions expressed above may not reflect those of Seeking Alpha as a whole. Seeking Alpha is not a licensed securities dealer, broker or US investment adviser or investment bank. Our analysts are third party authors that include both professional investors and individual investors who may not be licensed or certified by any institute or regulatory body.


