Summary:
- Comparing British American Tobacco and Altria reveals no clear winner; the most suitable choice depends on the factors you prioritize.
- I consider Altria to be the slightly better choice for those seeking to combine dividend income and dividend growth, due to the company’s higher Dividend Yield and Dividend Growth Rates.
- However, British American Tobacco has the moderately lower Valuation, and I consider it to be the superior choice when looking for an option to reduce portfolio volatility.
- My decision to select British American Tobacco over Altria for The Dividend Income Accelerator Portfolio has been a strategic allocation decision, allowing us to maintain a reduced portfolio risk level.
krblokhin
Investment Thesis
Both British American Tobacco (NYSE:BTI) and Altria (NYSE:MO) present compelling investment options, particularly for long-term investors who prioritize dividend income.
Both companies combine dividend income and dividend growth, have significant competitive advantages, an attractive Valuation, and a robust financial health. In addition to that, both choices can contribute to reducing the risk level of your investment portfolio.
I see Altria as being slightly ahead of British American Tobacco due to its superior mix of dividend income and dividend growth. However, the optimal choice for you depends on your investment priorities.
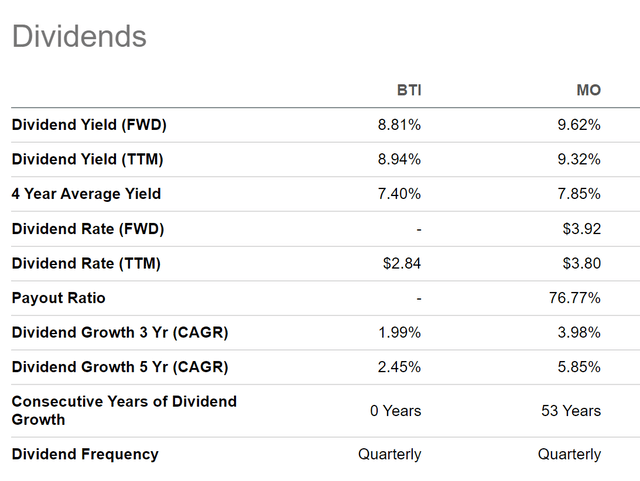
If you prioritize maximizing dividend income and dividend growth, Altria might be your preferred choice. The company currently pays a Dividend Yield [FWD] of 9.62% (compared to British American Tobacco’s 8.81%), and has shown a 5 Year Dividend Growth Rate [CAGR] of 5.85% (compared to 2.45%).
In case you prefer to select the one with the lower Valuation (British American Tobacco has a P/E [FWD] Ratio of 7.92 compared to Altria’s 8.88), or the one that can most contribute to reducing portfolio volatility, you might prioritize British American Tobacco (24M Beta Factor of 0.17 compared to 0.41).
I have selected British American Tobacco over Altria for incorporation into The Dividend Income Accelerator Portfolio. This has been a strategic portfolio allocation decision due to the largest position being SCHD, which is already invested in Altria.
This ensures that the proportion of Altria does not become disproportionately high compared to the overall investment portfolio. Moreover, it helps to maintain a reduced company-specific concentration risk, keeping a low risk level for all investors that follow and implement the investment approach of The Dividend Income Accelerator Portfolio. This strategy helps us to increase the probability of the portfolio reaching an attractive Total Return.
The Performance of British American Tobacco and Altria Over the Past 12-Month Period
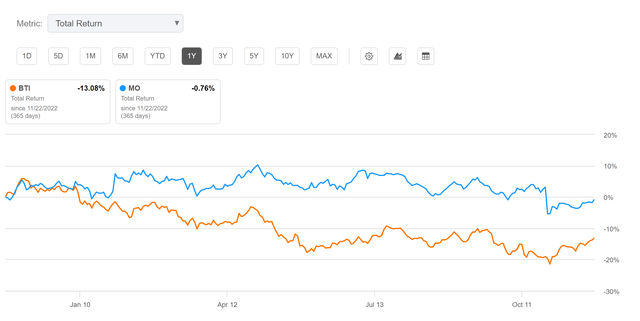
Considering British American Tobacco and Altria’s performance within the past 12-month period, it can be highlighted that both have shown a negative performance. However, Altria’s performance has been superior when compared to British American Tobacco: while Altria’s Total Return has been -0.76% within the past 12-month period, British American Tobacco’s has been -13.08%. This has contributed to the fact that British American Tobacco presently has a moderately lower Valuation compared to Altria.
British American Tobacco and Altria’s Dividend and Dividend Growth
It is worth noting that Altria currently pays the slightly higher Dividend than British American Tobacco. Altria pays a Dividend Yield [FWD] of 9.62%, while British American Tobacco’s is 8.81%.
It is further worth highlighting that Altria has shown superior results when it comes to dividend growth. While Altria’s 5 Year Dividend Growth Rate [CAGR] is 5.85%, British American Tobacco’s is slightly lower (2.45%). The same is indicated when having a look at the companies’ 3 Year Dividend Growth Rate [CAGR] (3.98% compared to 1.99%).
These metrics indicate that Altria is the moderately superior choice in terms of dividend income and dividend growth compared to British American Tobacco.
British American Tobacco and Altria’s Projection of Their Dividend and Yield on Cost
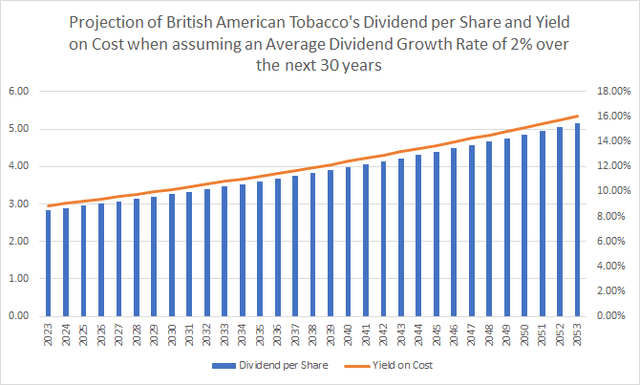
The graphic below illustrates a projection of British American Tobacco’s Dividend and Yield on Cost when assuming an Average Dividend Growth Rate [CAGR] of 2% for the following 30 years. My assumption is based on the company’s 5 Year Dividend Growth Rate [CAGR] of 2.45%. This assumption implies that investors could potentially achieve a Yield on Cost of 10.80% by 2033, 13.17% by 2043, and 16.05% by 2053. These numbers underscore the company’s attractiveness for dividend income and dividend growth investors.
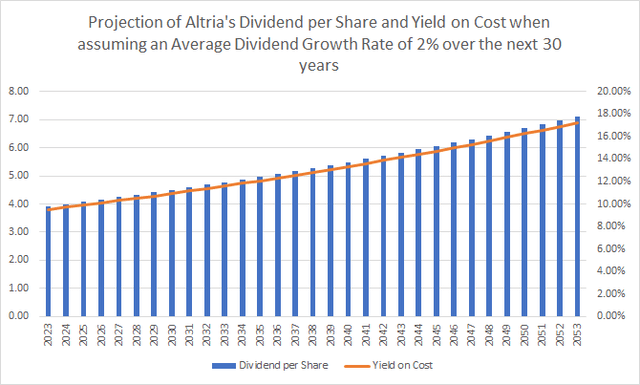
The graphic below shows a projection of Altria’s Dividend and Yield on Cost when assuming a Dividend Growth Rate [CAGR] of 2% for the following 30 years. For Altria, I have made a more conservative assumption considering that the company’s 5 Year Dividend Growth Rate [CAGR] stands at 5.85%.
When assuming this Dividend Growth Rate for the following 30 years, you could potentially reach a Yield on Cost of 11.60% by 2033, 14.14% by 2043, and 17.24% by 2053.
When investing over the long term, Altria seems to be the slightly superior pick due to its higher Dividend Yield [FWD] which will lead to a higher Yield on Cost when assuming the same Average Dividend Growth Rates of 2% for both companies.
British American Tobacco and Altria According to the Seeking Alpha Dividend Grades and Seeking Alpha Quant Rankings
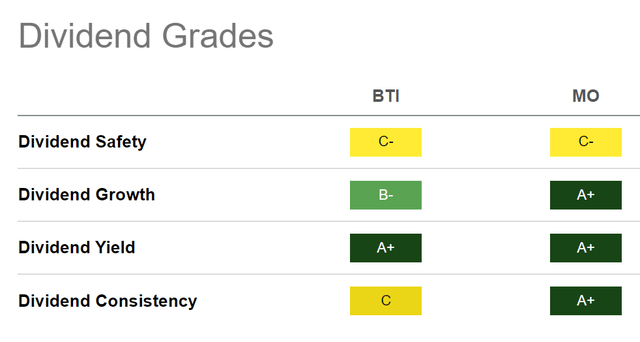
According to the Seeking Alpha Dividend Grades, both British American Tobacco and Altria receive an A+ rating for Dividend Yield and a C- rating for Dividend Safety.
However, Altria’s rating is superior for Dividend Growth (A+ rating compared to B-) and for Dividend Consistency (A+ rating compared to C). These metrics indicate that Altria is the superior choice for investors seeking dividend growth.
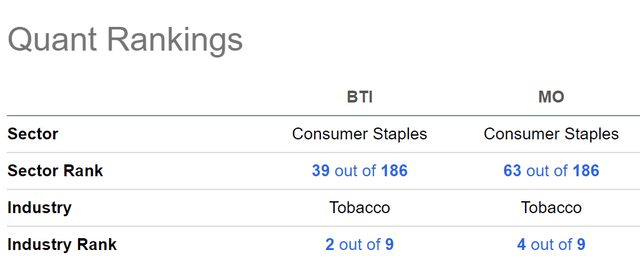
According to the Seeking Alpha Quant Ranking, British American Tobacco seems to be the slightly more attractive pick at this moment in time compared to Altria. British American Tobacco is ranked 2nd out of 9 within the Tobacco Industry (while Altria is ranked 4th), and is ranked 39th out of 186 within the Consumer Staples Sector (while Altria is ranked 63rd).
British American Tobacco and Altria’s Current Valuations
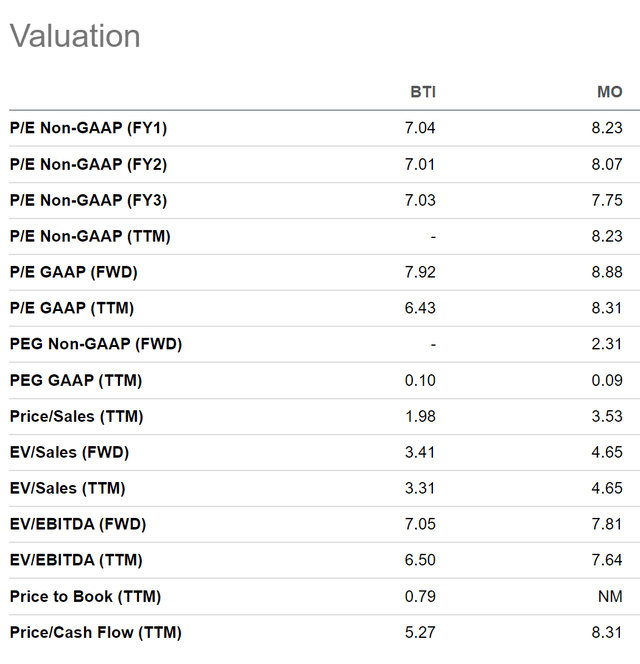
In terms of Valuation, it can be stated that British American Tobacco has the slightly lower P/E [FWD] Ratio when compared to Altria: while British American Tobacco’s P/E [FWD] Ratio stands at 7.92, Altria’s is at 8.88.
My theory that British American Tobacco is the slightly more attractive pick when it comes to Valuation is further supported when looking at the companies’ Price/Sales [TTM] Ratio: while British American Tobacco’s Price/Sales [TTM] Ratio stands at 1.98, Altria’s is 3.53.
The same is underlined by British American Tobacco’s lower Price/Cash Flow [TTM] Ratio (5.27 compared to 8.31).
Considering the Valuation metrics previously discussed, British American Tobacco seems to be the moderately more attractive pick.
Discounted Cash Flow [DCF]-Model
I have used a Discounted Cash Flow Model to determine the intrinsic value of British American Tobacco and Altria.
Discounted Cash Flow [DCF]-Model for British American Tobacco
My DCF Model indicates an intrinsic value of $40.07 for British American Tobacco. This gives the company an upside of 23.9%.
For this calculation, I have projected a Revenue Growth Rate and EBIT Growth Rate of 2% for the following 5 years, followed by a Perpetual Growth Rate of 2%. These estimates are based on the company’s 5 Year Average Revenue Growth Rate [FWD] of 2.78% and EBIT Growth Rate [FWD] of 2.79%.
The table below illustrates the Internal Rate of Return [IRR] for British American Tobacco, as projected by my DCF Model across various purchase price scenarios. At the company’s current stock price of $32.33, my DCF Model indicates an Internal Rate of Return of 14% for British American Tobacco.
|
Purchase Price of the British American Tobacco Stock |
Internal Rate of Return as according to my DCF Model |
|
$26.00 |
18% |
|
$28.00 |
17% |
|
$30.00 |
16% |
|
$32.00 |
14% |
|
$32.33 |
14% |
|
$34.00 |
13% |
|
$36.00 |
12% |
|
$38.00 |
11% |
|
$40.00 |
10% |
Source: The Author
Discounted Cash Flow [DCF]-Model for Altria
My DCF Model indicates an intrinsic value of $62.68 for Altria. This implies an upside of 51.2%. For Altria, I have assumed a Revenue Growth Rate and EBIT Growth Rate of 2% for the following 5 years, followed by a Perpetual Growth Rate of 2%. These estimates are slightly more conservative when compared to the company’s EBIT Growth Rate [FWD] of 3.30%.
Below you can see the Internal Rate of Return indicated by my DCF Model when assuming different purchase prices for Altria. At the company’s current stock price of $41.47, my DCF Model indicates an Internal Rate of Return of 18%.
|
Purchase Price of the Altria Stock |
Internal Rate of Return as according to my DCF Model |
|
$34.00 |
23% |
|
$36.00 |
21% |
|
$38.00 |
20% |
|
$40.00 |
19% |
|
$41.47 |
18% |
|
$42.00 |
18% |
|
$44.00 |
16% |
|
$46.00 |
15% |
|
$48.00 |
14% |
Source: The Author
The calculations of my DCF Model indicate Altria to be the superior choice compared to British American Tobacco, since it indicates a higher Internal Rate of Return for Altria (18%) when compared to British American Tobacco (14%).
However, I would like to highlight that the calculations of my DCF Models are based on assumptions, and changing these assumptions would result in different outcomes.
In the following, I will demonstrate why I have selected British American Tobacco for incorporation into The Dividend Income Accelerator Portfolio, even though I consider Altria to be the slightly superior choice in terms of dividend income and dividend growth.
Before I explain the reasons behind my investment decision, I would like to introduce you to the investment approach of The Dividend Income Accelerator Portfolio (particularly for those who are not familiar with it). Those that are already familiar with the investment approach can skip the following section written in italics.
The Dividend Income Accelerator Portfolio
The Dividend Income Accelerator Portfolio’s objective is the generation of income via dividend payments, and to annually raise this sum. In addition to that, its goal is to attain an appealing Total Return when investing with a reduced risk level over the long-term.
The Dividend Income Accelerator Portfolio’s reduced risk level will be reached due to the portfolio’s broad diversification over sectors and industries and the inclusion of companies with a low Beta Factor.
Below you can find the characteristics of The Dividend Income Accelerator Portfolio:
- Attractive Weighted Average Dividend Yield [TTM]
- Attractive Weighted Average Dividend Growth Rate [CAGR] 5 Year
- Relatively low Volatility
- Relatively low Risk-Level
- Attractive expected reward in the form of the expected compound annual rate of return
- Diversification over asset classes
- Diversification over sectors
- Diversification over industries
- Diversification over countries
- Buy-and-Hold suitability
Why I Have Selected British American Tobacco over Altria for The Dividend Income Accelerator Portfolio
The main reason for selecting British American Tobacco over Altria is because the portfolio’s investment in the Schwab U.S. Dividend Equity ETF already includes a stake in Altria.
Including Altria into The Dividend Income Accelerator Portfolio could increase its share, leading to an elevated company-specific concentration risk. This imbalance could negatively impact the probability of achieving favorable investment results.
My strategic portfolio allocation decision to select British American Tobacco over Altria for The Dividend Income Accelerator Portfolio helps to maintain a reduced company-specific concentration risk.
I am still considering including Altria in the future. First, I plan to expand the portfolio with additional investments, thereby enhancing its diversification. This approach will ensure that Altria’s eventual addition will not lead to a high concentration in a single company.
Once a broader diversification is achieved, Altria’s incorporation into the portfolio will not significantly elevate its company-specific concentration risk. This allocation strategy ensures a reduced overall risk level for our investment portfolio, thereby enhancing the likelihood of positive investment outcomes.
Why British American Tobacco Aligns With the Investment Approach of The Dividend Income Accelerator Portfolio
- Attractive Dividend Yield: British American Tobacco pays an attractive Dividend Yield [FWD] of 8.81%, aligning with the investment approach of The Dividend Income Accelerator Portfolio to generate extra income via dividends.
- Attractive Dividend Growth Rate: British American Tobacco has shown a Dividend Growth Rate [CAGR] of 2.45% over the past 5 years, indicating that the company should be able to increase its dividends continuously in the years ahead, aligning with The Dividend Income Accelerator Portfolio’s investment strategy.
- Appealing Valuation: British American Tobacco currently has an attractive Valuation: its P/E [FWD] Ratio of 7.92 stands 18.12% below its average from the past 5 years, and 56.86% below the Sector Median. These metrics indicate that the company is currently undervalued. They further indicate that investors can invest with a margin of safety, reducing the risk level when investing. It is worth reiterating that my DCF Model indicates an Internal Rate of Return of 14% for British American Tobacco at its current price level.
- Low Risk Level: British American Tobacco’s 24M Beta Factor of 0.17 is substantially lower than the broader stock market’s Beta Factor of 1. This suggests that we significantly reduce the risk level of The Dividend Income Accelerator Portfolio by including British American Tobacco.
- Financial Health: British American Tobacco demonstrates robust financial health, reflected in its EBIT Margin [TTM] of 48.10%, and Return on Equity of 12.19%. This aligns with the investment approach of The Dividend Income Accelerator Portfolio to invest in financially healthy companies to ensure capital preservation above all else.
Investor Benefits of The Dividend Income Accelerator Portfolio After Investing $100 in British American Tobacco
With the incorporation of British American Tobacco into The Dividend Income Accelerator Portfolio, its Weighted Average Dividend Growth Rate [CAGR] has increased from 4.49% (before the company’s inclusion into the portfolio) to 4.69%, promising an elevated income for investors.
The portfolio’s Weighted Average Dividend Growth Rate [CAGR] over the past 5 years has slightly decreased from 9.33% to 9.03%. Nonetheless, I am convinced that the portfolio remains attractive for those aiming to combine dividend income and dividend growth.
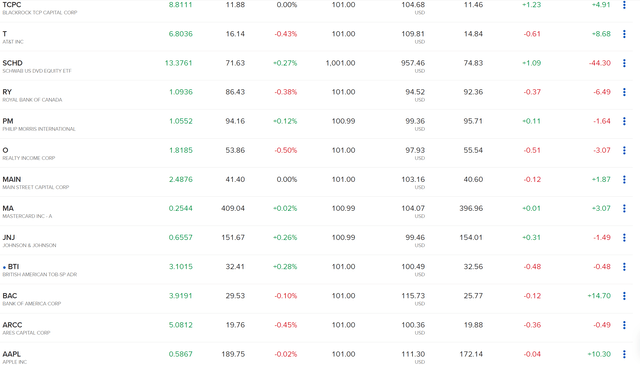
The Current Positions of The Dividend Income Accelerator Portfolio
Risk Analysis: British American Tobacco Versus Altria
Comparing British American Tobacco and Altria: Analyzing Their Beta Factors
British American Tobacco’s 24M Beta Factor of 0.17 (compared to Altria’s 0.41) indicates that an investment in the company contributes to reducing the volatility of your investment portfolio and risk level to an even higher degree.
Analyzing British American Tobacco and Altria’s Financial Health
The financial health of both companies’ is reflected in their A3 (for Altria) and Baa2 (for British American Tobacco) credit rating from Moody’s, indicating an even lower credit risk for Altria compared to British American Tobacco. Their financial health is further evidenced by their high EBIT Margins [TTM] of 59.67% (Altria) and 48.10% (British American Tobacco).
Analyzing British American Tobacco’s and Altria’s Free Cash Flow Yield
The companies’ high Free Cash Flow Yield [TTM] of 15.22% (Altria) and 17.61% (British American Tobacco) further indicate that both are attractive risk/reward choices and that their Valuations are not based on high growth expectations. This underscores my theory that an investment in both companies comes attached to a relatively low risk level.
The companies’ high Free Cash Flow Yield further strengthens my theory that both combine strongly with the investment approach of The Dividend Income Accelerator Portfolio.
However, there are different risk factors that you should consider before taking the decision to invest in Altria or British American Tobacco.
The Challenges of the Highly Regulated Tobacco Industry
Both companies operate in the highly regulated Tobacco Industry and any changing regulations can have a relatively strong impact on their financial results, and represent a risk factor for investors.
For this reason, I generally suggest to limit the proportion of companies from the Tobacco Industry to a maximum of 10% of your overall investment portfolio. This ensures a reduced industry-specific concentration risk of your portfolio.
The Potential for Dividend Reductions for Both British American Tobacco and Altria
Another risk factor I see for both companies would be a dividend cut. This could have a strong adverse effect on the companies’ stock prices and therefore represent an additional risk factor for you as an investor.
While British American Tobacco’s Payout Ratio [FY1] [Non GAAP] stands at 62.50%, Altria’s is at 77.10%. I consider the dividend of both to be relatively safe in the near future, and I see the probability of a dividend cut for British American Tobacco to be even lower when compared to Altria.
The companies’ 5 Year Average EPS Diluted Growth [FWD] of 4.21% (for British American Tobacco) and 5.87% (for Altria) strengthens my belief that their dividend should be relatively safe in the near future.
The Currency Risk for Investors in British American Tobacco
When considering investing in British American Tobacco, you should further consider the currency risks that come attached to an investment. The potential devaluation of the British Pound against the US Dollar represents an additional risk for investors in British American Tobacco.
Conclusion of the Risk Factors
I consider the risk factors for British American Tobacco investors to be slightly lower than for Altria investors, which is based on British American Tobacco’s lower 24M Beta Factor of 0.17 (compared to 0.41), its higher Free Cash Flow Yield of 17.61% (compared to 15.22%), and its slightly lower Dividend Payout Ratio [FY1] [Non GAAP] of 62.50% (compared to 77.10%). However, investors need to be aware of the currency risk when investing in British American Tobacco.
Conclusion
When comparing British American Tobacco and Altria, we are not left with a clear winner. Therefore, the most suitable choice for you as an investor depends on the factors you prioritize.
Altria: A Superior Combination of Dividend Income and Dividend Growth
If you want to prioritize the company that best combines dividend income and dividend growth, you might prefer Altria over British American Tobacco: Altria pays the slightly higher Dividend Yield (9.62% compared to 8.81%) and has shown a higher 5 Year Dividend Growth Rate [CAGR] (5.85% compared to 2.45%).
British American Tobacco’s Lower Valuation and Enhanced Ability to Reduce Portfolio Volatility
However, if you prefer to add the one that has the lower Valuation, you might opt for British American Tobacco over Altria: British American Tobacco presently has a P/E [FWD] Ratio of 7.92, while Altria’s is 8.88.
In the case that you are looking for a company to help you reduce the volatility of your investment portfolio, you might also prioritize British American Tobacco. This is due to its even lower 24M Beta Factor (0.17 versus 0.41) compared to Altria, indicating that it is the superior choice when aiming to reduce portfolio volatility.
The Strategic Portfolio Allocation Decision to Select British American Tobacco over Altria for The Dividend Income Accelerator Portfolio to Reduce Company-Specific Concentration Risk
I believe that both can be excellent investment choices: they have attractive Valuations, strong competitive advantages, robust financial health, and both combine dividend income with dividend growth.
I have selected British American Tobacco over Altria for The Dividend Income Accelerator Portfolio. This strategic portfolio allocation decision has been taken so that Altria does not account for a disproportionally high share, since The Dividend Income Accelerator Portfolio is already invested in Altria through SCHD (which presently accounts for the largest position of the overall portfolio).
Altria remains on my watchlist, and I plan to include the company after expanding the portfolio with additional investments and enhancing its diversification.
By implementing this portfolio allocation, we minimize company-specific concentration risk for The Dividend Income Accelerator Portfolio. This approach helps to maintain a reduced risk level for the overall portfolio, enhancing the potential for achieving attractive investment results for those who adopt and apply the investment approach of The Dividend Income Accelerator Portfolio.
Analyst’s Disclosure: I/we have a beneficial long position in the shares of BTI, MO either through stock ownership, options, or other derivatives. I wrote this article myself, and it expresses my own opinions. I am not receiving compensation for it (other than from Seeking Alpha). I have no business relationship with any company whose stock is mentioned in this article.
Seeking Alpha’s Disclosure: Past performance is no guarantee of future results. No recommendation or advice is being given as to whether any investment is suitable for a particular investor. Any views or opinions expressed above may not reflect those of Seeking Alpha as a whole. Seeking Alpha is not a licensed securities dealer, broker or US investment adviser or investment bank. Our analysts are third party authors that include both professional investors and individual investors who may not be licensed or certified by any institute or regulatory body.

