Summary:
- The cloud market slowdown in 2023 was due to cloud optimization and lower price hikes by major providers.
- We expect moderation in cloud optimization and forecast the cloud market to grow at an average 5-year forward growth of 23%.
- Strategic partnerships with Oracle, OpenAI, and Salesforce, coupled with the development of custom Arm-based chips, position Microsoft Corporation favorably in the expanding cloud market.
HJBC/iStock Editorial via Getty Images
In our previous analysis, we believed Microsoft Corporation (NASDAQ:MSFT) could benefit from its exclusive partnership with OpenAI as OpenAI’s sole cloud provider and stand to gain significant advantages by powering OpenAI’s workloads through Azure and integrating the advanced GPT-4 model into its extensive range of products and services. We believed that Microsoft’s leadership in Enterprise Software, Application Development Software, and Productivity Software, comprising 77.2% of the market, is attributable to its diverse artificial intelligence (“AI”) solutions and integration with OpenAI’s superior GPT-4, setting it apart from competitors like IBM (IBM). Microsoft’s seamless integration of AI-powered solutions throughout its product ecosystem further contributes to its strength. Additionally, we saw Microsoft as a frontrunner in the cloud market for AI, particularly in NLP and Computer Vision, and believed that incorporating GPT-4 into Azure OpenAI Service strengthens its position against competitors such as Amazon’s (AMZN) AWS and Google Cloud (GOOG).
Following the company’s recent fiscal Q1 earnings, we return to cover the company again as Azure cloud revenue growth had bounced back to 29% YoY from the previous quarter after slowing down in FY2023. Thus, we examine whether the company’s cloud growth could continue to accelerate further by analyzing the cloud market which had been faced with slowing growth overall throughout the year. Moreover, we also examine Microsoft’s partnerships and collaborations to determine how it could impact its cloud business as well as determine whether Microsoft is starting to capitalize on its advantages in AI for cloud.
Cloud Market Slow Down
Firstly, we examined the cloud infrastructure market growth in 2023 by compiling the market growth from Q1 to Q3 2023.
|
Cloud Infrastructure Market Projections |
2018 |
2019 |
2020 |
2021 |
2022 |
2023F (Bear Case) |
2023F (Base Case) |
2023F (Bull Case) |
Our Previous Forecast (2023) |
|
Cloud Infrastructure Market Revenues ($ bln) |
69 |
96 |
129.5 |
178 |
227 |
270.6 |
270.6 |
270.6 |
302.2 |
|
Cloud Infrastructure Market Revenue Growth % YoY |
48.4% |
39.1% |
34.9% |
37.5% |
27.5% |
19.2% |
19.2% |
19.2% |
33.1% |
|
Data Volume (ZB) |
33 |
41 |
64.27 |
84.45 |
109.0 |
170.9 |
142.1 |
135.4 |
142.1 |
|
Data Volume Growth % |
26.9% |
24.2% |
56.8% |
31.4% |
29.1% |
56.8% |
30.4% |
24.2% |
30.4% |
|
Cloud Infrastructure Revenue Growth/Data Volume Growth |
1.80 |
1.61 |
0.61 |
1.19 |
0.95 |
0.34 |
0.63 |
0.79 |
1.09 |
*2023 Full Year Forecast.
Source: Synergy Research, IDC, Khaveen Investments.
As seen above, the cloud infrastructure market growth had slowed down in Q3 YTD 2023 with a YoY growth rate of only 19.2%, the lowest for the market in the past 12 years and below our forecast of recovery of the market growth to 33.1% for the full year of 2023. In 2022, although data volume growth decreased slightly, the slowdown of the cloud market was to a larger extent, leading to the Cloud Infrastructure Revenue Growth/Data Volume Growth (“CRDV”) factor decreasing to 0.95x. Moreover, based on the average 10-year data volume growth as our forecast growth for 2023 (30.4%), we calculated the CRDV factor would decline to 0.63x in 2023 compared to our forecast of 1.09x. In the past 5 years, the highest and lowest data volume growth rate was 56.8% and 24.2% respectively, which would translate to a CRDV factor of 0.34x and 0.79x respectively. Therefore, even in the hypothetical scenario where the data volume growth is the lowest (24.2%), the highest CRDV factor would still be 0.79x, which is lower than in 2022 (0.95x), therefore, we believe the decline of the CRDV factor is the main component that could explain the market slowdown.
We compiled several factors highlighted by the top cloud companies (AWS, Azure and Google Cloud) affecting their growth in 2023.
Cloud Optimization
Company Data, Khaveen Investments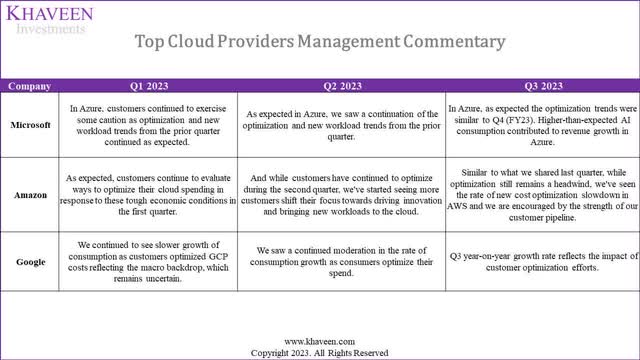
Based on the past 3 earnings briefings of the companies, all of them highlighted cloud optimization which continued in Q3 2023, though AWS claimed optimization had slowed down. Cloud optimization involves accurately choosing and allocating resources to a workload or application, ensuring alignment with performance needs and cost-effectiveness. According to AWS and Google, customers optimized their cloud amid macroeconomic uncertainty.
- Azure: Azure offers free tools for billing and cost management, providing visibility, cost organization, bill monitoring, budget implementation, and spending allocation. Users also benefit from cost optimization training.
- AWS: AWS optimization boosts workload performance, reliability, and cost-effectiveness across compute, storage, networking, and databases with tools like AWS Cost Explorer and Trusted Advisor.
- GCP: Google Cloud offers cost optimization guidance and free billing tools for workload cost management, with features for visibility, monitoring, analysis, and budgeting.
Microsoft describes the cycle of cloud workloads where new cloud workloads start and get optimized.
The second thing, of course, is the workloads start, then workloads get optimized, and then new workloads start, and that cycle continues. – Satya Nadella, Chairman & CEO.
Microsoft further guided that it expects optimization in the cloud to continue in Q2 as well as H2 of FY2024. However, it highlighted the impact of optimization was higher in previous quarters. In the previous earnings briefing, Microsoft also highlighted that during the pandemic, there were “lots of new project starts” and its customers postponed optimization until recently as “catch-up optimization” which the company expects “will come down.”
We’ve been very consistent that the optimization trends have been consistent for us through a couple of quarters now. Customers are going to continue to do that. It’s an important part of running workloads that is not new. There obviously were some quarters where it was more accelerated, but that is a pattern that is and has been a fundamental part of having customers, both make new room for new workload adoption and continue to build new capabilities. – Amy Hood, EVP & CFO, FQ1 earnings call.
Therefore, we believe that cloud optimization highlights increasing cloud efficiency which we previously determined as a factor for the slowdown of the cloud market in 2022. While companies such as Microsoft expect high levels of cloud optimization to come down, it highlighted it will continue to provide customers with cloud optimization capabilities going forward, thus we believe this could be a negative factor for the CRDV factor.
Macroeconomic Conditions
Furthermore, according to Amazon and Google, another factor highlighted for the cloud market weakness was tough macroeconomic conditions. However, in our previous analysis of Taiwan Semiconductor (TSM), we highlighted the improving outlook of the global economy in 2023 with a higher average revised forecast of 2.55% versus 1.9% based on IMF, PwC, EY and World Bank revised global GDP projections. Therefore, we do not believe macroeconomic conditions to be the main reason for the CRDV factor decline.
IT Spending
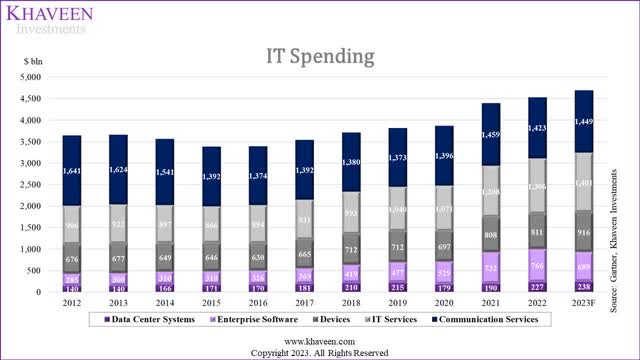
In terms of enterprise IT spending, Gartner forecasts a growth rate of 3.5% for total IT spending this year, higher than 2.9% in 2022. Moreover, IT services growth is forecasted to be fairly in line in 2023 at 7.3% with last year’s growth rate of 7.5%. Therefore, we believe IT spending is not a factor in the slowdown in cloud market growth. Additionally, based on the OECD, the ICT capital component of growth in GDP in 2022 was 0.5% and had been very stable in the past 10 years at an average of 0.4%.
Cloud Pricing
|
Company |
Price Increase (2022) |
Price Increase (2023) |
|
AWS |
23% |
21% |
|
Microsoft Azure |
-9.1% |
11% |
|
Google Cloud |
50% to 100% |
25% |
Source: Khaveen Investments.
In terms of cloud pricing, we believe this is not a factor for its slowing growth as the top cloud players such as Microsoft (11%) and Google Cloud (25%) had raised their cloud services pricing in 2023. Furthermore, AWS pricing for spot instances has increased by 21% in 2023. According to Liftr, Azure pricing had declined in 2022 by 9.1% but Amazon’s cloud prices increased by an average of 23% in the past 3 years with each increase higher each year since 2019. Moreover, Google Cloud previously increased pricing for some of its cloud services by between 50% to 100% in 2022. Therefore, all of the top 3 cloud providers’ pricing increases in 2023 are lower compared to the previous year which could indicate it as a factor for the slowdown in the CRDV factor.
Outlook
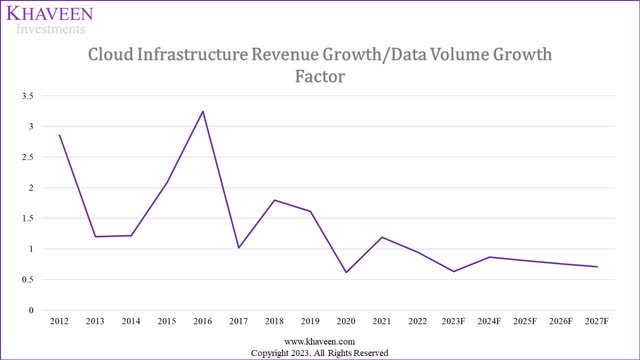
The chart above shows the CRDV factor in a decreasing trend, which we believe is due to cloud optimization.
|
Cloud Infrastructure Market Projections |
2022 |
2023F |
2024F |
2025F |
2026F |
2027F |
|
Cloud Infrastructure Market Revenues ($ bln) |
227 |
270.6 |
341.8 |
425.9 |
524.1 |
637.2 |
|
Cloud Infrastructure Market Revenue Growth % (‘a’) |
27.5% |
19.2% |
26.3% |
24.6% |
23.0% |
21.6% |
|
Data Volume (ZB) |
109.0 |
142.1 |
185.3 |
241.7 |
315.1 |
410.9 |
|
Data Volume Growth % (‘b’) |
29.1% |
30.4% |
30.4% |
30.4% |
30.4% |
30.4% |
|
CRDV Factor (‘c’) |
0.95 |
0.63 |
0.87 |
0.81 |
0.76 |
0.71 |
*a = b x c
Source: IDC, Khaveen Investments.
Overall, we believe the cloud market slowdown in 2023 with the decline in the CRDV factor even in the bull case (0.79x) could be attributed to factors such as cloud optimization and slowing price increase by top cloud providers in 2023. According to the top cloud providers, these cloud optimizations have affected their cloud growth as a headwind but indicated that although cloud optimization will remain as part of the cloud cycle, cloud optimization could moderate is expected to moderate going forward by the top cloud providers as customers delayed optimization during the pandemic period according to Microsoft. Moreover, we find pricing increases that were announced by the top cloud providers to be lower than in 2022, which could further contribute to the slowdown.
All in all, we see 2023’s CRDV factor declining significantly to 0.63x based on the 10-year data volume growth average which we continue to use as our assumption through 2027 and CRDV factor in 2024 based on a 3-year average of 0.81x, an increase compared to 2023 as we expect the market to improve as cloud optimization moderates, but tapering down by a 5-year average of 6.4% per year. In total, we forecasted the cloud market growth 5-year average of 23%, which is lower compared to our previous forecast of 38.1% due to the lower Revenue Growth/Data Volume Growth factor (1.25x previously) as we expect cloud optimization to continue impacting cloud market growth.
Microsoft Cloud Partnerships and Product Development
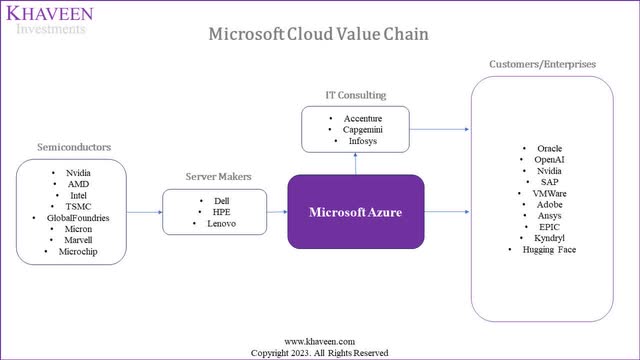
Recently, Microsoft announced several cloud partnerships it had secured with partners such as Oracle and Salesforce. We examined Microsoft’s cloud partnerships by compiling a value chain of its partners in the chart below.
At the start of the value chain, the first group of partners to Microsoft’s cloud are semiconductor companies such as server GPU makers Nvidia (NVDA) and AMD (AMD), CPU makers Intel (INTC) and AMD, memory chipmaker Micron (MU) as well as foundries such as TSMC and GlobalFoundries (GFS). Chips in the cloud are vital for processing data, facilitating virtualization, supporting efficient networking, and providing security features, collectively enhancing the performance and capabilities of cloud computing services. These chips are incorporated in cloud infrastructure equipment such as servers which include server makers Dell (DELL), HPE (HPE) and Lenovo (OTCPK:LNNGY). Servers act as the backbone of computing infrastructure, hosting and executing applications, storing data, and facilitating communication between different components. Both semiconductor and server maker partners are suppliers to Microsoft and represent a significant share of capex spending by Microsoft cloud.
Microsoft Azure has several IT consulting company partners such as Accenture, Capgemini (OTCPK:CAPMF) and Infosys (INFY). IT consulting companies assist organizations with the strategic adoption and migration of cloud computing technologies from developing comprehensive cloud strategies and managing migrations to ensuring security and providing ongoing support. Thus, these firms are sales partners to Microsoft, helping it promote the adoption of its cloud services to its customers.
Finally, the value chain concludes with Microsoft serving enterprise customers, offering scalable infrastructure, development tools, and advanced services, enabling efficient application development, global accessibility without the need for extensive physical infrastructure investment. For example, it includes Financial companies like Moody’s (MCO) and UBS (UBS) enabling the modernization of financial operation platforms. In the Industrials sector, customers like Siemens (OTCPK:SIEGY) and Lockheed Martin (LMT) leverage Azure for the development of industrial AI solutions such as Siemens Industrial Copilot and GEMS technology catering to automotive and military customers respectively enhancing operational efficiency and innovation in industries such as manufacturing and aerospace.
Within Software, Microsoft has several exclusive partnerships such as with Oracle, Salesforce and OpenAI. We examined how each of these exclusive partnerships benefits Microsoft.
Oracle Database Partnership
In 2023, Microsoft announced that it had secured a partnership with Oracle to be the:
“only cloud provider other than Oracle Cloud Infrastructure (ORCL) to host Oracle services, including Oracle Exadata Database Service and Oracle Autonomous Database on Oracle Cloud Infrastructure in Azure datacenters.”
Microsoft highlighted this will enable Oracle’s database customers, including 97% of Fortune 100 companies who use Oracle databases, to migrate to the cloud. Additionally, Oracle stated that its database solution can be purchased by customers on Azure Marketplace, which could provide an opportunity for them to capture Azure customers.
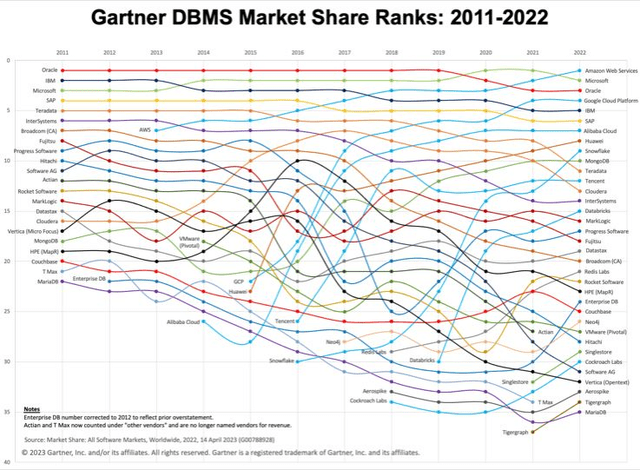
We believe this partnership benefits Microsoft as Oracle is one the leading database management software companies, at 3rd place according to Gartner, trailing behind Microsoft and AWS. That being said, Oracle has been faced with increasing competition from Microsoft. Based on the chart, Oracle is one of the top DBMS companies but has lost its longstanding market leadership with the rise of cloud-based DBMS providers such as Microsoft, AWS and Google which had been growing faster than the overall DBMS market as highlighted previously.
Specifically, Oracle database users who choose Azure will be able to access various products offered in Microsoft’s cloud.
Oracle Database@Azure customers can migrate existing databases to OCI and deploy in Azure, enhance security by keeping apps and data on a single network, gain optimal performance with the same fully managed Exadata Database Service that runs in OCI, and then innovate with the comprehensive services offered in the Microsoft cloud. – Microsoft.
Therefore, we believe this would enable Microsoft to capitalize on Oracle’s database customers’ cloud migration and enable cross-selling revenue opportunities by providing customers with access to Microsoft’s cloud solutions.
Once we announced that the Oracle databases are going to be available on Azure, we saw a bunch of unlock from new customers who have significant Oracle estates that have not yet moved to the cloud because they needed to rendezvous with the rest of the app estate in one single cloud. And so we’re excited about that. So in some sense, even the financial services sector, for example, is a good place where there’s a lot of Oracle that still needs to move to the cloud. – Satya Nadella, Chairman & CEO.
Oracle OCI
Besides that, Microsoft also recently signed an agreement with Oracle Cloud to collaborate on using Oracle OCI for its Bing AI service amid a shortage of Nvidia’s server GPUs. Oracle Cloud features thousands of top-range Nvidia H100 and A100 GPUs. Therefore, we believe this partnership would allow Microsoft to utilize Oracle for services such as Bing AI which does not monetize and utilize capacity saved in its data centers to cater to AI cloud service customers such as its Azure OpenAI. However, Oracle is only a small player in the cloud market with a 2% market share in 2022. Furthermore, Microsoft Azure also utilized Nvidia’s H100 chips with the next-gen H200 planned to be used by Azure next year according to Nvidia.
OpenAI
Furthermore, as highlighted previously, Microsoft has a partnership with OpenAI where it is the exclusive cloud provider to the company, powering OpenAI’s workloads “across research, products and API services”. In addition, Microsoft promised to increase its investments in “the development and deployment of specialized supercomputing systems to accelerate OpenAI’s groundbreaking independent AI research” as well as build out Azure infrastructure to integrate and deploy OpenAI’s AI applications globally. For example, this includes its Azure OpenAI Service which allows customers to build AI applications supported by OpenAI’s models. This follows after the company announced its multiyear partnership with OpenAI with plans to further increase its investments in the company. Overall, we believe this partnership could benefit Microsoft’s cloud growth as OpenAI not only has the top LLM with GPT-4 based on parameters as analyzed previously, but also magnificent growth. According to SimilarWeb, OpenAI’s ChatGPT web visits reached 1.5 bln in September 2023, a 143% growth rate since January 2023.
Salesforce
Furthermore, within the CRM market, Microsoft’s partnership with Salesforce (CRM) began as its public cloud provider for Salesforce Marketing Cloud as well as enabling various integrations between Salesforce’s CRM platform and Microsoft’s products such as Teams. As covered previously, Salesforce has an agnostic AI model approach for its AI CRM solutions. This means that its customers could choose other AI models besides their own such as OpenAI, which benefits Microsoft as its sole cloud provider. However, that said, Salesforce’s approach also allows competitors to integrate with its solutions such as Amazon Sagemaker and Google Vertex AI. Overall, we believe Salesforce’s partnership with Microsoft could benefit its growth as Salesforce has been consistently the CRM market leader with a 23% market share and we previously forecasted a strong growth outlook supported by AI CRM with a 5-year forward average growth of 18%.
Microsoft In-House Arm-based Chips
Moreover, Microsoft had announced new custom Arm-based chips to be featured in its data centers including its Colbalt 100 CPU and Maia 100 GPU, launching next year in 2024. This comes amid a supply shortage of Nvidia’s top-range server GPUs including A100 and H100.
Demand for Nvidia’s A100 and H100 chips has far outstripped supply over the past year, with even Microsoft tapping rival cloud providers such as Oracle for extra GPU capacity to support its own AI services. In another sign of computing capacity constraints in AI, OpenAI — which is backed by Microsoft and relies heavily on its infrastructure — was forced on Tuesday to “pause” new sign-ups to its ChatGPT Plus service after a “surge in usage”. – Financial Times.
Therefore, we believe Microsoft’s move towards custom chip development could benefit the company to scale its cloud infrastructure and support its rapid cloud growth and not be constrained as it had been such as with OpenAI’s premium ChatGPT.
Besides that, according to Microsoft, its custom chip development could enable it to benefit customers in terms of speed, cost and quality. Generally, Arm-based processors are recognized for fast instruction execution, promoting efficient performance and high energy efficiency.
We think this gives us a way that we can provide better solutions to our customers that are faster and lower cost and higher quality. – Scott Guthrie, executive vice president of Microsoft’s cloud and AI group.
Moreover, Microsoft’s custom chip developments come after its top competitors Microsoft and Google had been in custom Arm-based server chip development. For example, Amazon launched its latest Trainium server GPU in 2021 following the release of its first-gen Inferentia GPU in 2019. In CPUs, Amazon first launched its Graviton processors in 2018. Whereas Google (GOOG) developed its custom chip called a TPU designed for AI inferencing and training.
We compared the company’s GPU in the table below with Nvidia’s H100, Amazon Trainium and Google’s TPU v4 to determine whether it has any performance advantage against these companies.
|
Chip |
Maia 100 |
Nvidia H100 |
Amazon Trainium |
Google TPU v4 |
|
Process |
5nm |
4nm TSMC |
7nm |
7nm |
|
Transistors (‘bln’) |
105 |
80 |
55 |
22 |
|
Memory |
64GB |
80GB |
32GB |
32GB |
|
Memory Bandwidth |
1.6 TB/s |
3.35 TB/s |
820 GB/s |
1.2TB/s |
Source: Microsoft, Nvidia, Amazon, ArXiv, Khaveen Investments.
As seen in the table, Microsoft’s Maia 100 GPU will be built using a TSMC 5nm process, trailing behind Nvidia which uses a 4nm process but is more advanced than Amazon’s Trainium and Google’s TPU. Despite that, Microsoft’s GPU has the highest transistor count at 105 bln compared to Nvidia, Amazon and Google. Though, Microsoft’s GPU has lower memory capacity and bandwidth compared to Nvidia but higher than Amazon and Google. Overall, this could indicate Microsoft GPU edges out Amazon and Google but is unlikely to outperform Nvidia’s H100. Moreover, Nvidia’s next-gen H200 chip is planned to be released in 2024 and could be even stronger than Microsoft’s.
Furthermore, in terms of CPU, Microsoft has not provided many details about its Colbalt 100 CPU but stated that it is a 64-bit 128-core chip. For comparison, AMD’s 4th gen EPYC server CPUs also include up to 128 cores while Intel’s Xeon CPUs have up to 56 cores.
The 64-bit 128-core chip represents performance improvements of up to 40% over current generations of Azure Arm servers. – Microsoft.
Besides performance, in terms of costs, while Microsoft had not indicated how much customers could save with its custom chips, management indicated that the use of its own custom silicon could enable it to provide cheaper cloud models for customers using its chips.
Azure’s end-to-end AI architecture, now optimized down to the silicon with Maia, paves the way for training more capable models and making those models cheaper for our customers. – Scott Guthrie, executive vice president of Microsoft’s cloud and AI group.
According to Amazon, the company claims that migrating to cloud instances based on Amazon Graviton2 processors provides up to 20% cost savings to customers. Thus, we believe the company’s move towards custom Arm-based CPUs could allow it to pass on cost savings to customers to increase its competitiveness in the cloud market. Notwithstanding, Microsoft’s management will continue to obtain chips from Nvidia to diversify and provide choices to customers.
At the scale we operate, it’s important to optimize and integrate every layer of the stack to maximize performance, but it’s also important to diversify and give our customers choices. – Rani Borkar, corporate vice-president for Azure Hardware Systems and Infrastructure
Outlook
Overall, Microsoft has partnerships with various companies including semiconductors, server makers and IT consulting firms in cloud. Microsoft has several key partnerships which we believe could support the competitiveness of its cloud business. This includes its partnership with Oracle for integrating its database services with Microsoft Azure, allowing the company to capitalize on Oracle’s customers’ migration to the cloud as the only cloud partner to Oracle. Besides that, Microsoft has signed an agreement with Oracle to utilize its data center capacity equipped with high-end Nvidia GPUs for some of Microsoft’s AI services such as Bing AI, which could allow it to use its capacity to cater to other AI cloud services. Moreover, we believe Microsoft’s partnership with OpenAI and Salesforce (CRM market leader) as their exclusive cloud provider for OpenAI’s AI workloads and Salesforce Marketing Cloud CRM platforms.
|
Cloud Infrastructure Pricing |
Pricing |
Pricing (Microsoft Chips) |
|
AWS |
133.71 |
133.71 |
|
Microsoft Azure |
137.24 |
109.79 |
|
Google Cloud |
116.08 |
116.08 |
|
Alibaba Cloud (BABA) |
125.753 |
125.75 |
|
Tencent (OTCPK:TCEHY) |
93.6 |
93.60 |
|
Huawei |
86.78 |
86.78 |
|
Baidu (BIDU) |
40.85 |
40.85 |
|
IBM Cloud |
74.47 |
74.47 |
|
Oracle |
100.23 |
100.23 |
|
Average |
100.97 |
97.92 |
Source: Company Data, Khaveen Investments.
Furthermore, we expect Microsoft’s custom development of Arm-based CPUs and GPUs to be significant to Microsoft, allowing it to compete with other competitors such as AWS and Google Cloud which already have custom Arm chips in their data centers with benefits such as cost-effectiveness. For example, based on the table above of our updated compilation of cloud pricing, Microsoft has the highest pricing among competitors. Assuming it achieves a 20% saving with its custom Arm-based chips and passes the cost savings to customers, similar to Amazon, its cloud pricing would be lower than AWS, Google and Alibaba, increasing its competitiveness in the cloud market.
Microsoft Cloud Outperformance
We examined Microsoft’s cloud growth compared to its competitors and determined whether it is already realizing its advantage which we believed it has due to its wide breadth of AI solutions and integration with OpenAI’s GPT-4 models.
Company Data, Khaveen Investments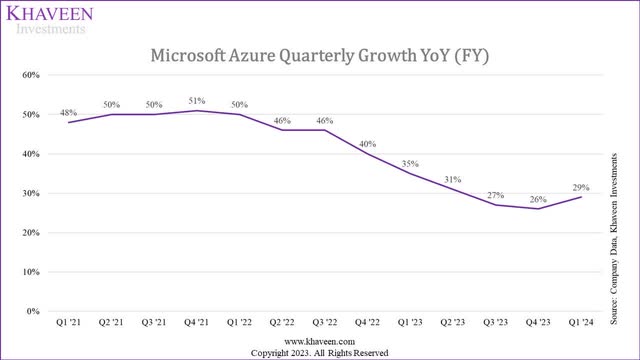
Source: Company Data, Khaveen Investments.
In Q3 2023, Microsoft’s Azure revenue growth had improved (29% YoY) following its slowing growth. According to Microsoft, in its latest earnings briefing, “higher-than-expected AI consumption contributed to revenue growth in Azure.”
Synergy Research, Company Data, Khaveen Investments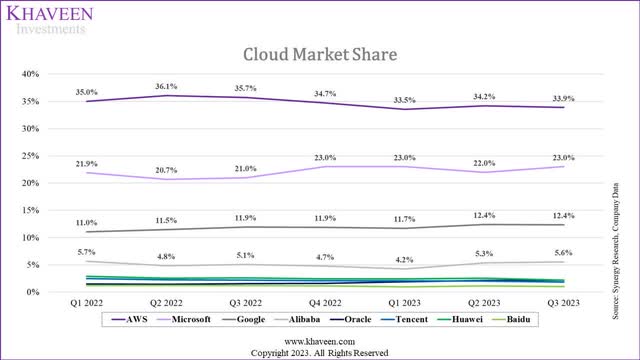
|
Cloud Infrastructure Company |
Q3 YTD 2023 Revenue ($ bln) |
Q3 YTD 2023 Revenue Growth YoY % |
|
Amazon |
66.55 |
13.3% |
|
|
23.90 |
26.0% |
|
Microsoft |
44.57 |
27.6% |
|
Alibaba |
9.96 |
16.5% |
|
Tencent |
3.86 |
1.7% |
|
Huawei |
4.68 |
6.0% |
|
Baidu |
2.07 |
4.6% |
|
Oracle |
4.10 |
66.0% |
|
Total |
196.60 |
19.2% |
Source: Synergy Research, Company Data, Khaveen Investments.
We compiled the market share and revenue performance of the top cloud providers in Q3 YTD 2023 above. As seen, Microsoft’s cloud growth was the highest at 27.6% followed by Google and Amazon.
In our previous analysis, we found Microsoft has the most AI cloud solutions which is reflected by it having the highest growth rate. However, Google has a higher growth rate than Amazon despite having fewer AI-related cloud solutions.
|
Cloud Company |
Pricing |
Data Center Total Availability Zones |
Number of Services |
|
AWS |
$133.7 |
117 |
241 |
|
Microsoft Azure |
$137.2 |
144 |
302 |
|
Google Cloud |
$116.1 |
148 |
367 |
|
Alibaba Cloud |
$125.8 |
102 |
186 |
|
Tencent |
$93.6 |
83 |
159 |
|
Huawei |
$86.8 |
100 |
141 |
|
Baidu |
$40.9 |
29 |
59 |
|
IBM Cloud |
$74.5 |
37 |
170 |
|
Oracle |
$100.2 |
62 |
100 |
|
Average |
$100.97 |
91.4 |
192 |
Source: Company Data, Khaveen Investments.
We updated our comparison of the top cloud providers from our previous analysis of pricing (based on 2 core CPUs and 8GB of RAM), total availability zones and number of cloud services. Compared to our previous analysis, the average cloud pricing had decreased by 10% which we believe could be due to the impact of cloud optimization. In terms of availability zones, Google continues to lead with the highest followed closely by Microsoft. Additionally, Google has overtaken Microsoft with more cloud products with AWS trailing behind.
|
Ranking |
Pricing |
Data Center Total Availability Zones |
Number of Services |
Average |
Factor Score |
|
AWS |
8 |
3 |
3 |
4.7 |
0.98 |
|
Microsoft Azure |
9 |
2 |
2 |
4.3 |
1.02 |
|
Google Cloud |
6 |
1 |
1 |
2.7 |
1.26 |
|
Alibaba Cloud |
7 |
4 |
4 |
5.0 |
0.93 |
|
Tencent |
4 |
6 |
6 |
5.3 |
0.88 |
|
Huawei |
3 |
5 |
7 |
5.0 |
0.93 |
|
Baidu |
1 |
9 |
9 |
6.3 |
0.74 |
|
IBM Cloud |
2 |
8 |
5 |
5.0 |
0.93 |
|
Oracle |
5 |
7 |
8 |
6.7 |
0.69 |
Source: Company Data, Khaveen Investments.
Based on our updated comparison, we ranked each company by each metric and derived their average ranking and factor score. As seen Google Cloud ranked the highest is ahead of Microsoft, which is placed second, due to its stronger positions across all metrics.
Outlook
Notwithstanding, despite its leading ranking in our analysis, in Q3 2023 YTD, Microsoft had outperformed Google Cloud with a higher growth rate, indicating other factors that we had not accounted for. One of the factors could be due to AI where we determined that Microsoft leads all cloud competitors in terms of number of AI-related cloud services.
|
Cloud Companies |
Total Cloud AI Solutions |
Ranking |
Q3 YTD 2023 Growth % |
Ranking |
|
Microsoft Azure |
27 |
1 |
27.61% |
2 |
|
AWS |
24 |
2 |
13.34% |
5 |
|
Google Cloud |
15 |
3 |
26.00% |
3 |
|
Alibaba |
13 |
4 |
16.48% |
4 |
|
IBM |
12 |
5 |
N/A |
|
|
Baidu |
11 |
6 |
4.62% |
7 |
|
Huawei |
10 |
7 |
6.03% |
6 |
|
Oracle Cloud |
9 |
8 |
66.02% |
1 |
|
Tencent |
7 |
9 |
1.69% |
8 |
Source: Company Data, Khaveen Investments.
Comparing the number of total cloud AI solution rankings with their Q3 2023 YTD growth, Microsoft had outperformed all competitors except for Oracle which growth had surged in 2023 following the partnership with Microsoft for its Bing AI on Oracle Cloud.
|
Ranking |
Pricing |
Data Center Total Availability Zones |
Number of Services |
Cloud AI Services |
Average |
Factor Score |
|
AWS |
8 |
3 |
3 |
2 |
4.0 |
1.07 |
|
Microsoft Azure |
9 |
2 |
2 |
1 |
3.5 |
1.14 |
|
Google Cloud |
6 |
1 |
1 |
3 |
2.8 |
1.25 |
|
Alibaba Cloud |
7 |
4 |
4 |
4 |
4.8 |
0.96 |
|
Tencent |
4 |
6 |
6 |
9 |
6.3 |
0.75 |
|
Huawei |
3 |
5 |
7 |
7 |
5.5 |
0.86 |
|
Baidu |
1 |
9 |
9 |
6 |
6.3 |
0.75 |
|
IBM Cloud |
2 |
8 |
5 |
5 |
5.0 |
0.93 |
|
Oracle |
5 |
7 |
8 |
8 |
7.0 |
0.64 |
Source: Company Data, Khaveen Investments.
Thus, we factored in the number of AI cloud services in our cloud revenue projections for each company. We included the ranking of cloud AI solutions and derived a new average and factor score. However, our model continues to show Microsoft having the second-highest factor score as we weighed each metric equally. Based on our updated factor scores, we forecast each company’s growth rate by multiplying each of their factor scores with our cloud market projections and deriving our cloud market share projections as seen below. Overall, we expect Microsoft’s market share to continue rising and challenging market leader AWS. Additionally, we see Google’s share rising rapidly as well but remaining below Microsoft in third place as its market share is much smaller (0.53x) than Microsoft.
Synergy Research, Company Data, Khaveen Investments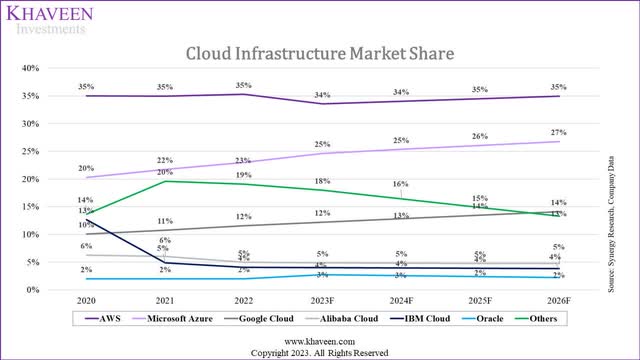
Risk: Cloud AI Competition
Despite Microsoft’s current lead in cloud for AI based on its number of services related to AI, we believe one of the risks to the company is competition from top competitors who are also aggressively expanding in space. Notably, market leader AWS is investing $4 bln in OpenAI’s competitor, Anthropic and will depend on AWS as its primary cloud provider as well as pursue joint development of AI models for AWS customers. Furthermore, Amazon is reportedly building an LLM called “Olympus” which supports 2 tln parameters, making it more advanced than OpenAI’s GPT-4 model. Besides Amazon, Google is also developing a next-gen AI model named “Gemini” which could launch in 2024 and challenge OpenAI. Therefore, we believe these developments by Microsoft’s competitors could threaten its position as the top cloud AI company and affect its growth outlook in the cloud.
Valuation
|
Revenue Projections ($ mln) |
2022 |
2023 |
2024F |
2025F |
2026F |
|
Office Products |
44,862 |
48,728 |
54,404 |
60,741 |
67,817 |
|
Office Products Growth % |
12.5% |
8.6% |
11.6% |
11.6% |
11.6% |
|
|
13,816 |
15,145 |
16,299 |
17,215 |
17,838 |
|
LinkedIn Growth % |
34.3% |
9.6% |
7.6% |
5.6% |
3.6% |
|
Dynamics |
4,686 |
5,437 |
6,095 |
6,710 |
7,254 |
|
Dynamics Growth % |
24.8% |
16.0% |
12.1% |
10.1% |
8.1% |
|
Server Products |
67,321 |
79,970 |
97,615 |
119,876 |
146,544 |
|
Server Products Growth % |
28.0% |
18.8% |
22.1% |
22.8% |
22.2% |
|
Windows Revenues (excluding Search and News Advertising) |
24,761 |
21,507 |
21,799 |
22,096 |
22,396 |
|
Windows Revenues Growth % |
10.1% |
-13.1% |
1.4% |
1.4% |
1.4% |
|
Search and News Advertising |
11,591 |
12,208 |
14,679 |
17,715 |
20,469 |
|
Growth % |
25.1% |
5.3% |
20.2% |
20.7% |
15.5% |
|
Netflix Partnership |
865 |
1,383 |
2,088 |
||
|
Other Segments |
31,233 |
29,787 |
31,463 |
34,293 |
37,445 |
|
Other Segments Growth % |
4.7% |
-4.6% |
5.6% |
9.0% |
9.2% |
|
Total Activision |
11,578 |
12,561 |
14,465 |
||
|
Total Microsoft Revenue (Including Activision) |
198,270 |
212,782 |
254,798 |
292,590 |
336,316 |
|
Growth % |
18.0% |
7.3% |
19.7% |
14.8% |
14.9% |
Source: Company Data, Khaveen Investments.
We updated our revenue projections for Microsoft by segments from our previous analysis with its full-year FY2023 results, we also updated our projections for its cloud revenue growth with a forward average of 28.5% under its Server Products segment. In total, we forecasted Microsoft’s forward 3-year average of 17.2%, including our previous estimate of Activision’s revenue contribution following the completion of the deal.
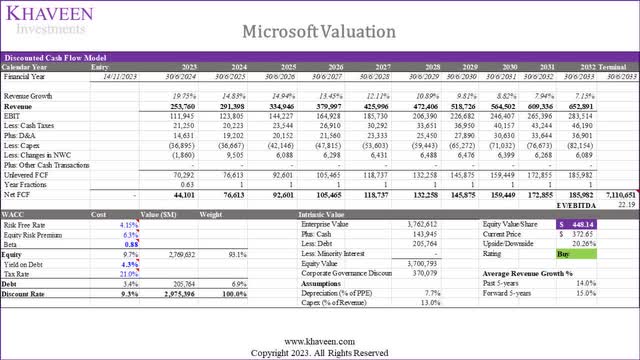
Based on a discount rate of 9.3% (company’s WACC) and terminal value based on its 5-year average EV/EBITDA of 22.19x, our model shows an upside of 20.3% for the company.
Verdict
In summary, the anticipated slowdown in the cloud market for 2023 is attributed to factors like cloud optimization and lower price hikes by major providers. As we foresee the influence of cloud optimization moderating in line with Microsoft’s expectations, we have revised our cloud market projections, indicating a 5-year average growth of 23%, driven primarily by the growth in data volume. Regarding Microsoft’s cloud growth prospects, we believe its strategic partnerships with Oracle, OpenAI, and Salesforce position it favorably to capitalize on the expanding cloud market. Also, we believe the development of custom Arm-based chips to generate cost savings for customers, bolstering Microsoft’s competitiveness.
In our updated analysis comparing top cloud providers, Microsoft stands out as a leading company in terms of data center presence, the breadth of cloud services, and AI-related offerings. We believe this positions Microsoft to continue gaining market share, with our projected factor score 1.14x higher than our market growth projections, resulting in a forward average growth of 28.5%, supporting overall company growth.
However, based on our revised discounted cash flow analysis, we have established a lower price target of $448.14. This adjustment is driven by a reduced total forward growth of 15.9%, compared to the previous 19.2%, reflecting the impact of lower cloud market growth projections factoring in cloud optimization. All in all, we rate Microsoft Corporation stock as a Buy.
Analyst’s Disclosure: I/we have a beneficial long position in the shares of MSFT either through stock ownership, options, or other derivatives. I wrote this article myself, and it expresses my own opinions. I am not receiving compensation for it (other than from Seeking Alpha). I have no business relationship with any company whose stock is mentioned in this article.
No information in this publication is intended as investment, tax, accounting, or legal advice, or as an offer/solicitation to sell or buy. Material provided in this publication is for educational purposes only, and was prepared from sources and data believed to be reliable, but we do not guarantee its accuracy or completeness.
Seeking Alpha’s Disclosure: Past performance is no guarantee of future results. No recommendation or advice is being given as to whether any investment is suitable for a particular investor. Any views or opinions expressed above may not reflect those of Seeking Alpha as a whole. Seeking Alpha is not a licensed securities dealer, broker or US investment adviser or investment bank. Our analysts are third party authors that include both professional investors and individual investors who may not be licensed or certified by any institute or regulatory body.

