Summary:
- Apple’s Q4 2023 financial results show steady growth and minor setbacks, with a slight decline in revenue but a significant increase in earnings per share.
- The introduction of the latest iPhone series and environmentally friendly Apple Watch models align with the company’s commitment to carbon neutrality by 2030.
- Technical analysis suggests that Apple’s stock is set for a significant upswing in 2024, supported by bullish price action and solid technical indicators.
Justin Sullivan
Apple Inc. (NASDAQ:AAPL) revealed a complex financial landscape with modest growth and some setbacks in Q4 2023. The quarter ended with a slight decline in revenue compared to the previous year, yet it saw a significant increase in earnings per share. The introduction of the latest iPhone series and environmentally friendly Apple Watch models reflects the company’s commitment to carbon neutrality by 2030. This article extends the discussion from the previous article, focusing on the Q4 2023 earnings and offering a technical analysis to determine future trends. Notably, the stock is currently trading at elevated levels. It seems set for a significant upswing in 2024, supported by the development of bullish price action.
A Financial Overview of Growth and Challenges
Apple’s financial performance for Q4 2023 showcases steady growth and minor setbacks. The company announced a quarterly revenue of $89.5 billion, a slight decrease of 1% compared to the previous year. However, the earnings per diluted share significantly improved, increasing 13% yearly to $1.46. CEO Tim Cook highlighted the company’s achievements, noting a record revenue for iPhone sales in Q4 2023 and a record high in the Services sector.
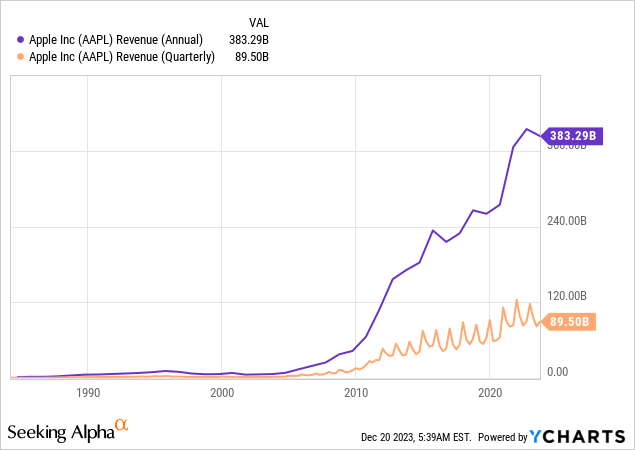
Apple’s product lineup, including the iPhone 15 series and the first carbon-neutral Apple Watch models, positions the company strongly for the upcoming holiday season. These developments align with Apple’s goal of achieving carbon neutrality for all its products by 2030. The chart below showcases the quarterly revenue numbers. It presents a slight year-over-year decrease in revenue in Q4, yet the overall trend is still upward. Conversely, the annual revenue in 2023 stood at $383.29, a slight dip from the $394.33 in 2022. Nonetheless, the consistent long-term growth in annual revenue highlights Apple’s future profit potential.
Luca Maestri, Apple’s CFO, pointed out the growth in the company’s active installed base of devices, which reached new highs across all product categories and geographic segments. This growth reflects the strength of Apple’s ecosystem and its customer loyalty. The company also reported significant financial activities, including double-digit earnings per share growth and a substantial $25 billion return to shareholders, while continuing to invest in long-term development.
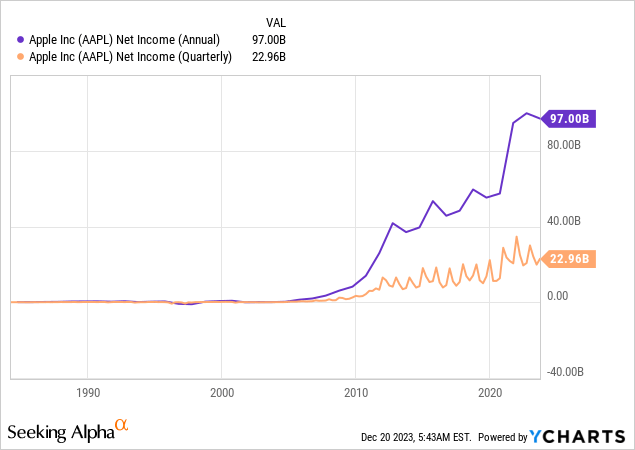
The Board of Directors declared a cash dividend of $0.24 per share, which reflects Apple’s ongoing commitment to delivering shareholder value. Moreover, the net income showed an overall increase quarterly. The net income rose from $20.72 billion in Q4 2022 to $22.96 billion in Q4 2023. However, the annual net income declined from $99.80 billion to $97 billion. Similarly, the operating income for Q4 2023 saw a year-over-year increase. However, the annual operating income showed a slight decrease.
The total operating expenses for Q4 2023 and the full year saw an uptick, mainly attributable to the rise in research and development expenses, signaling a strategic emphasis on investment in this area. Concurrently, there was a year-over-year increase in the provision for income taxes in Q4 2023.
Overall, Apple’s financial results for Q4 2023 display a blend of robust growth and minor challenges. Despite a slight dip in annual revenue and operating income, the company’s strategic investments, particularly in research and development, are laying the groundwork for future success. This, coupled with strong product performance and a steadfast commitment to shareholder value, positions Apple favorably as it moves forward with its sustainability goals and continues to innovate in the technology sector.
Exploring the Price Structures of Bullish Momentum
Recap
The previous article analyzed the long-term technical trajectory of Apple’s stock, examining annual and quarterly charts. The article highlighted that a significant upward trend began in 2016, propelling the stock to unprecedented highs. Most of this price surge occurred in 2019, 2020, and 2021, with 2022 as an ‘inside bar’ candle. A breach of this inside bar in 2023 sparked a new upward market trend. Furthermore, the quarterly charts underscore this bullish momentum with rapid reversal patterns amidst a robust parabolic move.
The latest uptick in Apple’s stock began in 2023, first noted when the stock reached the 38.2% Fibonacci retracement level. This rebound also originated from a solid base at the bull flag support. The successful breach of the bull flag and subsequent support found after the breakout suggests a continued rally, overcoming formidable resistance. Given these solid bullish indicators across various time frames, the stock was anticipated to maintain its upward trajectory.
The Next Move in Apple
Apple’s stock price has rebounded from its support level at the bull flag pattern at $165.45, experiencing a significant upward surge. The monthly candlestick patterns for November and December 2023 suggest that the year will end on a high note, potentially forming a bullish yearly candlestick on the chart. This development would confirm a breakout from the inside bar candle of 2022, signaling a robust bullish trend for 2024. This rally commenced from the 38.2% Fibonacci retracement level, which stretches from the 2019 low of $34.03 to the January 2022 peak of $180.65. The breakout from the 2022 inside bar, coupled with a year-end close at elevated levels, is expected to trigger a significant upward momentum in the market. Although Apple has shown robust price performance, its RSI still falls short of overbought territory, indicating potential for additional price growth.
Apple Monthly Chart (stockcharts.com)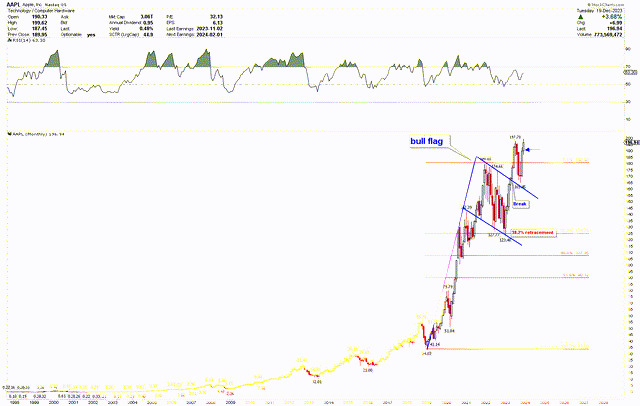
This optimistic perspective gains further credibility from the weekly chart below, showcasing a robust double-bottom pattern with lows at $127.77 and $123.48. The successful breach above the neckline of this formation, followed by a retracement and a subsequent bounce back, suggests robust price momentum and the potential for a significant rally. Over the recent weeks, weekly solid candles underscore the likelihood of the price preparing for an upward breakout from this zone.
AAPL Weekly Chart (stockcharts.com)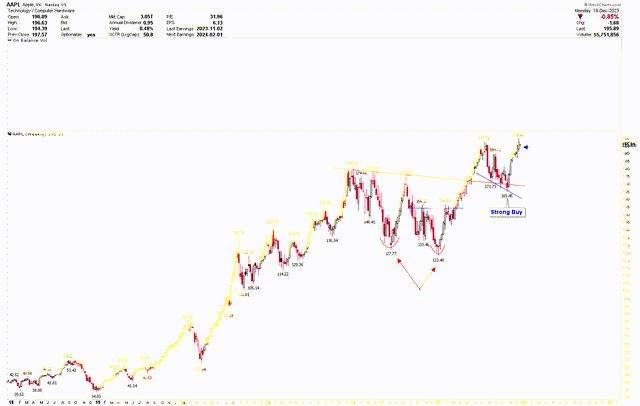
Key Action for Investors
The short-term daily chart below offers an in-depth view of the price movements at this specific breakout point. It showcases a triangle pattern delineated by the red dotted trend lines, with the lower points highlighted at $171.73, $167.40, and $165.45. The pronounced price reversal followed by a breakout from this triangle pattern signals robust price dynamics, suggesting a readiness for the price to continue its upward trajectory.
AAPL Daily Chart (stockcharts.com)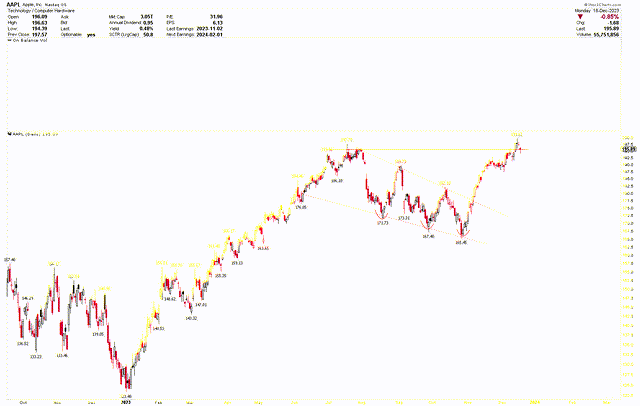
Based on the above analysis, it’s clear that despite Apple’s stock currently trading at elevated levels, it could still present a valuable investment opportunity for investors to expand their portfolio in anticipation of the upcoming surge. The robust performance displayed in the monthly charts and a strong 2023 close following the breach of the inside bar in 2022 suggest a possible market surge in 2024.
Market Risk
Despite Apple’s impressive financial results and strong market positioning, the company is not immune to broader economic and industry-related risks. The global economic landscape remains uncertain, with inflation, interest rate hikes, and geopolitical tensions that could impact consumer spending and disrupt global supply chains. Additionally, the technology sector is highly competitive and rapidly evolving. Apple faces intense competition from tech giants and emerging players, especially in smartphones, wearables, and services. The company’s ability to maintain its market share and profitability hinges on continuous innovation and effectively responding to consumer preferences, which can be unpredictable.
While Apple’s financial performance has been robust, operational risks could affect its future earnings. The slight decrease in quarterly revenue and the fluctuations in operating income highlight the company’s susceptibility to market dynamics. Increases in operating expenses, driven by research and development, could impact profit margins if not matched by proportional revenue growth. Furthermore, Apple’s ambitious goal of achieving carbon neutrality by 2030 poses challenges and costs.
From a technical standpoint, Apple’s stock exhibits strong bullish patterns, yet it trades at high levels, suggesting the possibility of a market correction. A decline in price below $123.48 would counter the current bullish trend and potentially trigger additional downward momentum in the market.
Final Thoughts
In conclusion, Apple’s financial results for Q4 2023 paint a picture of a company navigating a complex economic terrain with both resilience and challenges. Despite a slight dip in annual revenue and a fluctuation in operating income, Apple has demonstrated a capacity for robust growth, as evidenced by a record-breaking quarter for iPhone sales and firm performance in the Services sector. The company’s strategic investment in research and development and its commitment to sustainability, particularly in achieving carbon neutrality by 2030, underscore its long-term vision.
From a technical analysis perspective, Apple’s stock appears poised for significant growth in 2024. The bullish momentum indicated by the breach of the 2022 inside bar and the successful bounce from the bull flag pattern, coupled with a strong year-end close, suggest a continued upward trajectory for the stock. This optimism is supported by solid price action, including a robust double-bottom pattern and a breakout from a triangle. The powerful closing price in December 2023 is poised to surpass the 2022 inside bar, setting the stage for a significant price rally in 2024. Investors may consider increasing positions in anticipation of this impending upward surge.
Analyst’s Disclosure: I/we have no stock, option or similar derivative position in any of the companies mentioned, and no plans to initiate any such positions within the next 72 hours. I wrote this article myself, and it expresses my own opinions. I am not receiving compensation for it (other than from Seeking Alpha). I have no business relationship with any company whose stock is mentioned in this article.
Seeking Alpha’s Disclosure: Past performance is no guarantee of future results. No recommendation or advice is being given as to whether any investment is suitable for a particular investor. Any views or opinions expressed above may not reflect those of Seeking Alpha as a whole. Seeking Alpha is not a licensed securities dealer, broker or US investment adviser or investment bank. Our analysts are third party authors that include both professional investors and individual investors who may not be licensed or certified by any institute or regulatory body.
