Summary:
- Carnival Corporation & plc’s Resilience and Recovery: Carnival has exhibited impressive resilience and recovery, showcasing notable improvements in key financial metrics such as revenue, operating income, and net income margins.
- Strategic Financial Decisions: Diligent management of dilution factors and strategic financial decisions, including the reduction of long-term debt, contributes to a positive outlook for Carnival, enhancing its financial strength.
- Positive Market Outlook: Despite potential risks associated with market sentiment, Carnival’s robust performance in the face of economic challenges positions it favorably in the cruise industry.
- Compelling Fair Price Target: The comprehensive valuation analysis yields a compelling fair price target of $30.1, signaling a substantial 57% upside from the current stock price of $19.2.
- Strong Buy: A $30.1 fair price target, up 57% from the current $19.2 stock price and 36.38% higher than the previous estimate, underscores a compelling “strong buy” recommendation for Carnival.
robyvannucci/iStock Unreleased via Getty Images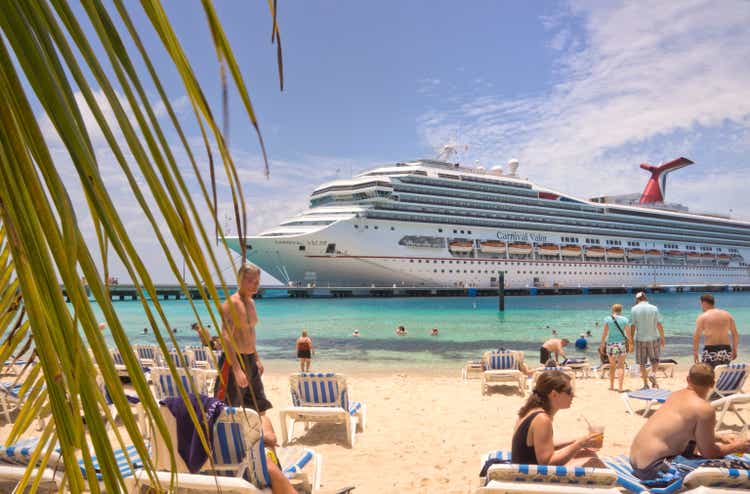
Thesis
In my previous article on Carnival Corporation & plc (NYSE:CCL), I detailed why the stock was a compelling buy. Despite dilution factors, I asserted that the stock had the potential to yield a robust 22% annual return through 2028.
Since that publication, the stock first experienced a decline, but it subsequently rebounded, currently boasting a gain of approximately 27.30%. In this article, I am revising Carnival’s fair price target, elevating it by 36.38% to $30.10, a notable increase from the previous $22.07. Furthermore, I am reiterating my “strong buy” recommendation for Carnival. I emphasize its enhanced financial condition and underscore that dilution factors remain a non-issue.
Overview
FQ4 2023
Carnival surpassed fiscal Q4 earnings estimates by $0.05, reporting a Q4 loss of -$0.07. When multiplied by the outstanding shares, this equates to a total loss of -$88.48 million. Additionally, Q4 revenue exceeded expectations, reaching $5.4 billion, surpassing estimates by $120 million.
Previous Estimates
In my previous estimates, the initial observation is the notable discrepancy in my forecast for FY2023 revenue. While I projected it to be $17.7 billion, the latest earnings release as of Q4 2023 reveals that Carnival has substantially exceeded this projection, reporting a full-year revenue of $21.59 billion, surpassing my estimate by $3.81 billion.
These projections were formulated by incorporating Carnival’s lower berth expansion projections, multiplying them by the average revenue generated per lower berth (which stood at approximately $19,874.44 at that time), and then aggregating the results to derive the full-year estimate.
| Lower Berths Projections | Revenue projections | Full Year | |
| Q1 2023 | 223000 | 4,432,000,000.00 | |
| Q2 2023 | 223,000 | 4,431,999,999.58 | |
| Q3 2023 | 223,260 | 4,437,167,353.84 | |
| Q4 2023 | 223,260 | 4,437,167,353.84 | 17,738,334,707.26 |
| Q1 2024 | 238,150 | 4,733,097,757.40 | |
| Q2 2024 | 241,150 | 4,792,721,075.78 | |
| Q3 2024 | 241,150 | 4,792,721,075.78 | |
| Q4 2024 | 241,150 | 4,792,721,075.78 | 19,111,260,984.74 |
| Q1 2025 | 241,150 | 4,792,721,075.78 | |
| Q2 2025 | 241,150 | 4,792,721,075.78 | |
| Q3 2025 | 245,470 | 4,878,578,654.25 | |
| Q4 2025 | 245,470 | 4,878,578,654.25 | 19,342,599,460.05 |
Updated Estimates
As mentioned earlier, Carnival significantly exceeded my full-year estimates for 2023. Consequently, an update is imperative. The initial step involves obtaining the current average revenue per lower berth and subsequently adjusting the previous model.
Upon scrutinizing the Q4 2023 earnings, it is evident that the revenue per lower berth was approximately $97,000. On a quarterly basis, this translates to $24,000, surpassing the prior lower berth revenue of $19,974.44 by $4,126. Armed with this updated figure, and multiplying it by Carnival’s anticipated lower berth projections, the resulting numbers are as follows:
| Lower Berths Projections | Revenue projections | Full Year | |
| Q1 2024 | 238,150 | 5,760.15 | |
| Q2 2024 | 241,150 | 5,832.71 | |
| Q3 2024 | 241,150 | 5,832.71 | |
| Q4 2024 | 241,150 | 5,832.71 | 23,258.26 |
| Q1 2025 | 241,150 | 5,832.71 | |
| Q2 2025 | 241,150 | 5,832.71 | |
| Q3 2025 | 245,470 | 5,937.19 | |
| Q4 2025 | 245,470 | 5,937.19 | 23,539.80 |
Market
The global cruising market is poised for a robust recovery, with anticipated growth rates of 19.76% in 2023-2024 and 13.11% in 2024-2025. Subsequently, revenue is projected to continue expanding, albeit at a slightly moderated pace, with an expected growth of 2.82% in 2025-2026 and 2.42% in 2026-2027.
Worldwide Cruise Industry Revenue Projections (Statista)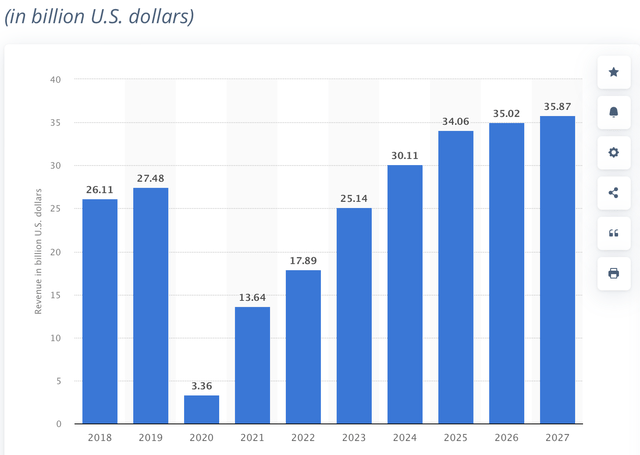
Financials (In millions of USD unless specified otherwise)
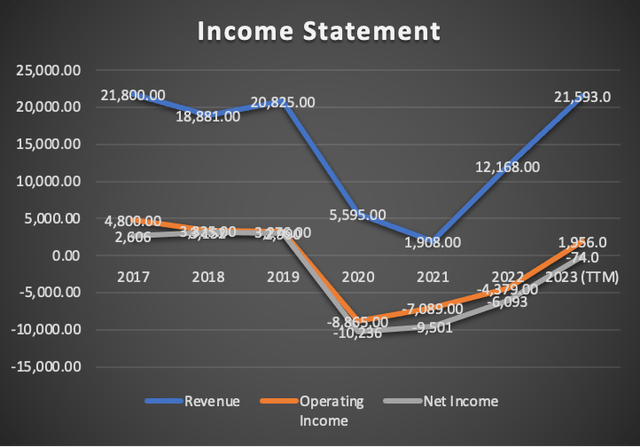
Carnival’s recovery has demonstrated significant strength. In my previous article, the trailing twelve months [TTM] revenue for Carnival was $17.48 billion; it has since surged to $21.59 billion, marking an impressive 23.51% increase.
Operating income has also experienced a notable uptick. In the earlier analysis, TTM operating income was -$1 billion, and now it has climbed to $1.95 billion. A parallel positive movement is evident in net income, which has shifted from -$3.46 billion to -$74 million.
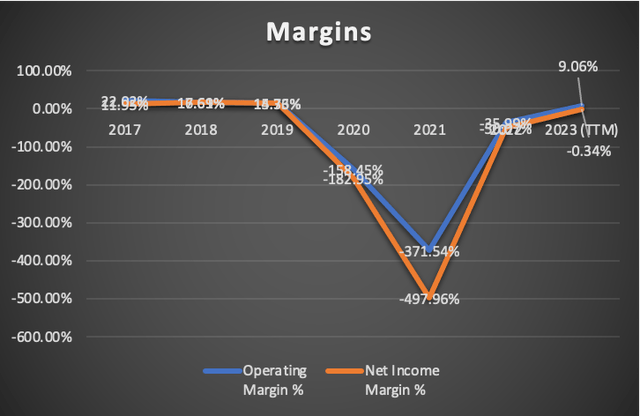
Margins have seen substantial improvement, with operating income margin rising from -5.96% to 9.06% and net income margin improving from -19.83% to -0.34%.
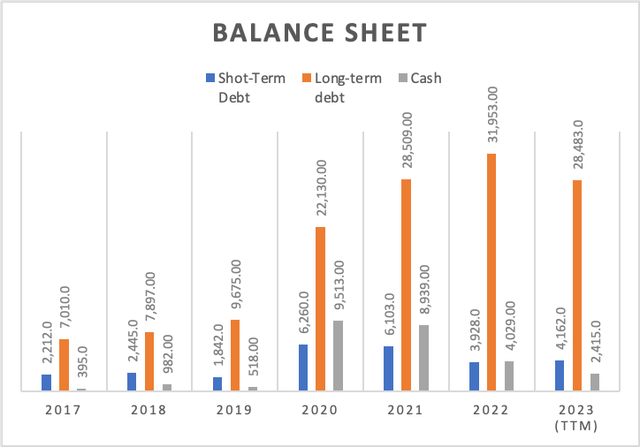
The balance sheet has witnessed modest improvement. Previously, long-term debt stood at $31.96 billion; it has decreased to $28.4 billion, indicating a debt reduction of $3.55 billion. However, this reduction came at the expense of a reduction in cash, which was $4.46 billion and now stands at $2.41 billion, reflecting a decrease of $2.05 billion.
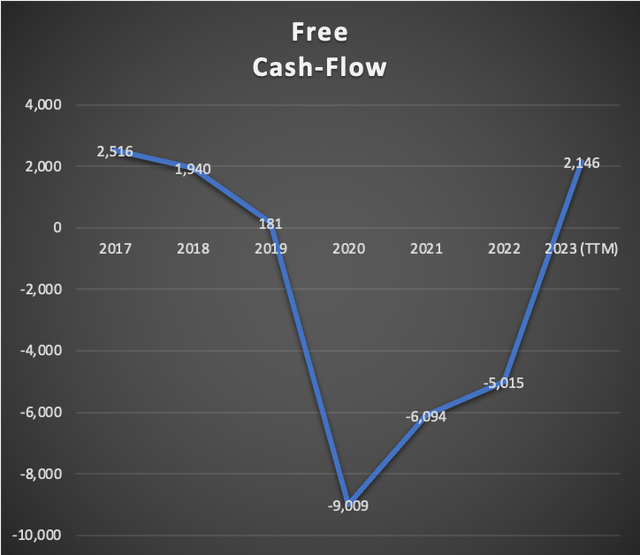
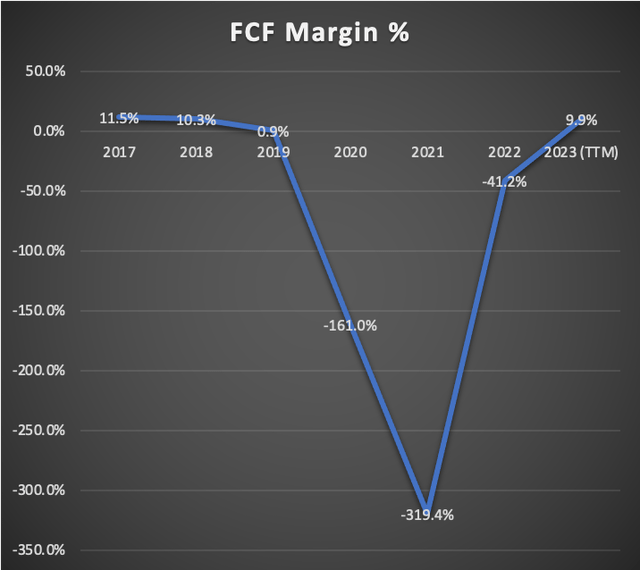
Carnival has successfully achieved positive cash flow, turning the free cash flow from -$495 million to $2.14 billion. This positive outcome has led to a notable improvement in the free cash flow margin, now standing at 9.9%, a substantial enhancement from the previous -2.8%.
Valuation (In millions of USD unless specified otherwise)
In this valuation analysis, I will employ a Discounted Cash Flow [DCF] models to gauge Carnival’s intrinsic value. This model will integrate my lower berth revenue estimates which go up to FY2025, and for calculating revenue beyond that point I will be using the expected market revenue growth of the Worldwide cruising industry.
The provided table encapsulates all current data pertinent to Carnival. Using this data, I will calculate the Weighted Average Cost of Capital [WACC] by factoring in Equity value, Debt value, and Cost of debt. Additionally, Depreciation and Amortization (D&A), Interest, and Capital Expenditures [CapEx] will be computed based on margins linked to revenue growth. This method ensures that as Carnival’s revenue expands, these expenses will also increase, providing a more pragmatic and coherent projection.
| TABLE OF ASSUMPTIONS | |
| (Current data) | |
| Assumptions Part 1 | |
| Equity Value | 6,960.00 |
| Debt Value | 32,645.00 |
| Cost of Debt | 6.33% |
| Tax Rate | 14.94% |
| 10y Treasury | 3.89% |
| Beta | 2 |
| Market Return | 10.50% |
| Cost of Equity | 17.11% |
| Assumptions Part 2 | |
| CapEx | 3,284.00 |
| Capex Margin | 15.21% |
| Net Income | -74.00 |
| Interest | 2,066.00 |
| Tax | -13.00 |
| D&A | 2,600.00 |
| Ebitda | 4,579.00 |
| D&A Margin | 12.04% |
| Interest Expense Margin | 9.57% |
| Revenue | 21,593.0 |
My Estimates
Commencing with this valuation analysis, I will first elaborate on the net income margins. The net income margins of 5.25% and 7.22% are derived from analysts’ estimates, obtained by dividing the EPS result by the expected revenue. Post-2025, I will incrementally increase the net income margin by 2%, aligning with the anticipated growth rate between 2024 and 2025, as indicated by analysts’ estimates.
| Net Income Margin | |
| 2024 | 5.25% |
| 2025 | 7.22% |
| 2026 | 9.22% |
| 2027 | 11.22% |
| 2028 | 13.22% |
| 2029 |
15.22% |
For revenue projections, I will utilize the new lower berth estimates (refer to the overview section). Given the anticipated market revenue growth of 19.76% for 2023-2024 and 13.11% for 2024-2025, I will adjust my full-year lower berths based revenue for 2024 and 2025 accordingly. Subsequent to 2025, when Carnival’s lower berths are not expected to grow, I will incorporate the market revenue growth rates of 2.82% for 2025-2026 and 2.42% for 2026-2027. Beyond 2027, I will employ the last growth rate of 2.42% for 2028-2029.
| Revenue | Net Income | Plus Taxes | Plus D&A | Plus Interest | |
| 2024 | $27,853.0 | $1,462.28 | $1,680.78 | $5,034.55 | $7,699.50 |
| 2025 | $26,612.0 | $1,921.39 | $2,208.49 | $5,562.25 | $8,227.20 |
| 2026 | $27,359.8 | $2,522.57 | $2,899.51 | $6,193.89 | $8,811.65 |
| 2027 | $28,021.9 | $3,144.06 | $3,613.86 | $6,987.96 | $9,669.07 |
| 2028 | $28,700.0 | $3,794.14 | $4,361.09 | $7,816.84 | $10,562.83 |
| 2029 | $29,394.6 | $4,473.85 | $5,142.36 | $8,681.74 | $11,494.19 |
| ^Final EBITA^ |
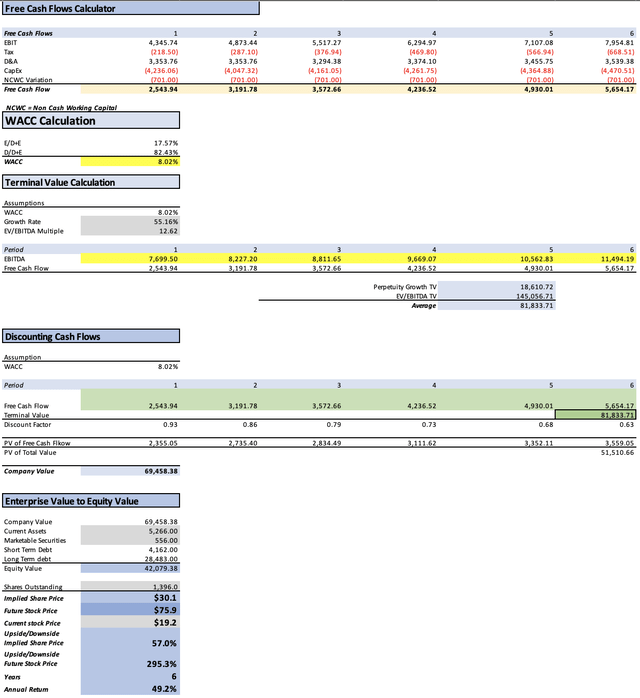
The Discounted Cash Flow [DCF] model reveals a fair price for Carnival of approximately $30.1, reflecting a 57% upside from the current stock price of $19.2. For 2028, the projected stock price is $75.9, representing a remarkable 295.3% upside and an annual return of 49.2% throughout 2029.
This revised target signifies a 36.38% increase from my previous fair price target of $22.07, compelling me to reiterate my “strong buy” rating on Carnival.
Risks to Thesis
The primary risk to consider in this scenario is market sentiment, as it holds the potential to keep the stock suppressed even if its fundamentals consistently improve.
I view this investment as exceptionally secure. Not only does the cruise industry face substantial barriers to entry, but it has also demonstrated resilience during economic downturns. As said in my article about the S&P 500 (SP500), I don’t expect the economy to fall into a profound recession, which means that for 2024, the stock could definitely, deliver strong gains.
Dilution factors, at present, seem inconsequential. For instance, if Carnival were to issue 1,000 new shares, multiplying this by the current stock price of $19.2 would result in $19.2 billion. If utilized to reduce long-term debt, it would bring it down to $9.18 billion. This would settle the annual returns that Carnival could give at 21.7% which is still decent.
Conclusion
In conclusion, Carnival has demonstrated remarkable resilience and recovery, showcasing substantial improvements in revenue, operating income, and net income margins. The company’s robust performance, particularly in the face of economic challenges, highlights its strength within the cruise industry. Notably, the diligent management of dilution factors and strategic financial decisions, such as reducing long-term debt, contribute to a positive outlook for Carnival.
The comprehensive valuation analysis, incorporating adjusted net income margins and revenue projections, culminates in a compelling fair price target of $30.1, representing a substantial 57% upside from the current stock price of $19.2. This revised target, indicating a 36.38% increase from the previous fair price target of $22.07, underlines the strong buy recommendation on Carnival Corporation & plc shares.
Editor’s Note: This article was submitted as part of Seeking Alpha’s Top 2024 Long/Short competition, which runs through December 31. With cash prizes, this competition — open to all contributors — is one you don’t want to miss. If you are interested in becoming a contributor and taking part in the competition, click here to find out more and submit your article today!
Editor’s Note: This article discusses one or more securities that do not trade on a major U.S. exchange. Please be aware of the risks associated with these stocks.
Analyst’s Disclosure: I/we have no stock, option or similar derivative position in any of the companies mentioned, but may initiate a beneficial Long position through a purchase of the stock, or the purchase of call options or similar derivatives in CCL, CUK, CUKPF over the next 72 hours. I wrote this article myself, and it expresses my own opinions. I am not receiving compensation for it (other than from Seeking Alpha). I have no business relationship with any company whose stock is mentioned in this article.
Seeking Alpha’s Disclosure: Past performance is no guarantee of future results. No recommendation or advice is being given as to whether any investment is suitable for a particular investor. Any views or opinions expressed above may not reflect those of Seeking Alpha as a whole. Seeking Alpha is not a licensed securities dealer, broker or US investment adviser or investment bank. Our analysts are third party authors that include both professional investors and individual investors who may not be licensed or certified by any institute or regulatory body.

