Summary:
- JPMorgan is reporting earnings on January 12, 2024, with a consensus estimate of $4.15 in EPS.
- JPM often exceeds estimates for both EPS and revenue because analyst estimates are consistently low.
- Insider selling is prevalent, while the bank’s steady buyback pace is factored into analyst forecasts.
Drew Angerer
JPMorgan (NYSE:JPM) is reporting earnings 1/12/2024 before the market opens. The consensus estimate is for $4.15 in EPS. In this article, I’ll go over analyst expectations, my EPS estimate, and potential ways to profit from this event.
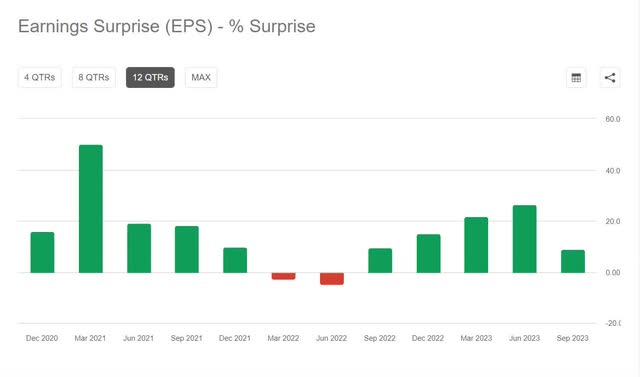
Like most companies, JPMorgan tends to exceed analyst estimates and surprise with better earnings per share than expected:
earnings suprises JPM (seekingalpha.com)
With JPMorgan, this is also true for revenue, although this tends to be more difficult because there is less accounting discretion.
Because it is just coming off a strong string of earnings and revenue surprises while the banking environment has improved chiefly since March 2023, I estimate the probability the bank beats again on EPS and revenue is very high (think 70%-80%).
The current consensus estimate of Wall Street analysts is $4.15 per share.
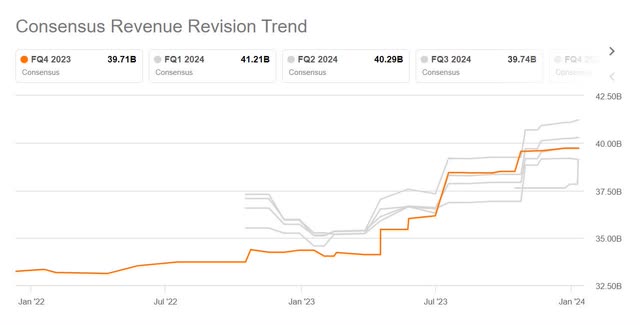
consensus revenue estimates (seekingalpha.com)
The consensus revenue estimate is $41.21 billion.
Earlier in the year, a prevailing view was that a recession was coming. Right now, the general feeling is we’re experiencing a soft landing. JPMorgan has been performing well throughout the year and analysts have mostly revised their forecasts upwards:
consensus revenue forecasts (seekingalpha.com)
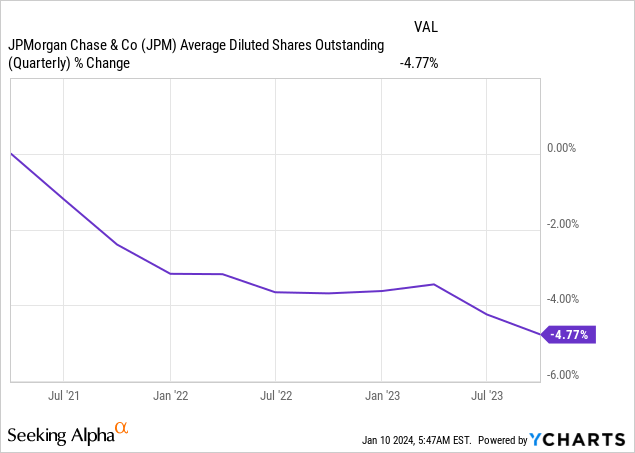
Something I like to look at as well is insider selling and it is prevalent. However, that’s mostly what insiders have been doing. It is usually during some kind of crisis with depressed share prices that we see headlines about Jamie Dimon stepping up and buying $100 million worth of shares. I guess he’s saving up. The bank also tends to retire a few shares on a quarterly basis, but I expect analysts have incorporated the steady buyback pace into their models.

The final thing I want to mention is that the lowest estimate is for EPS of $2.91 and the highest estimate is $4.98 in EPS. The actual number can easily fall outside of this range, although it will usually fall in between.
I’m experimenting with my own estimates based on a weighted average of several models. This includes time series models, the actual analyst estimates, and other factors. I can also fudge with it a little bit if I think there are factors that the models won’t capture very well. I’m still experimenting and improving my forecasting, so take my numbers with a grain of salt. At the same time, I’m engaging in these forecasts because I expect these should already be or ultimately be helpful.
| FQ4 2023 | EPS estimate per share $ | Revenue estimate ($ billions) |
| Wall Street Analysts | 3.61 | 39.71 |
| Bram de Haas | 3.72 | 40.38 |
I come out above the current consensus numbers but easily within the bands of high/low analyst estimates.
What’s much more important than what the number will be is how JPM’s price will react or whether there is another way to profit from this earnings event.
Here is the table showing the earnings surprise percentage and the price changes over the earnings event for the past 12 JPMorgan Chase earnings events:
| Date | Earnings Surprise (%) | Price Day Before | Price Day After | Price Change (%) |
|---|---|---|---|---|
| 2023-07-14 | 24.65 | 148.87 | 153.38 | 3.03 |
| 2023-04-14 | 26.64 | 128.99 | 139.83 | 8.40 |
| 2023-01-13 | 16.14 | 139.49 | 140.80 | 0.94 |
| 2022-10-14 | 16.56 | 109.37 | 115.86 | 5.93 |
| 2022-07-14 | -4.25 | 111.91 | 112.95 | 0.93 |
| 2022-04-13 | 2.67 | 131.54 | 126.12 | -4.12 |
| 2022-01-14 | 10.57 | 168.23 | 151.27 | -10.08 |
| 2021-10-13 | 24.82 | 165.36 | 163.47 | -1.14 |
| 2021-07-13 | 17.93 | 158.00 | 155.12 | -1.82 |
| 2021-04-14 | 48.22 | 154.09 | 152.17 | -1.25 |
| 2021-01-15 | 44.46 | 141.17 | 138.04 | -2.22 |
| 2020-10-13 | 31.18 | 102.44 | 100.22 | -2.17 |
This table includes the earnings surprise percentage and the corresponding share price change around each earnings report. The “Earnings Surprise (%)” column shows the percentage difference between the actual and expected earnings per share (EPS). The “Price Change (%)” column shows the percentage change in JPM’s share price between the day before and the day after the earnings report.
If I look back decades (including the financial crisis, etc.), I find that on average JPM stock slightly declines when it reports earnings. That’s also true if I look back 10 years (without the financial crisis). Interestingly, the price response is ever so slightly positive on average if I just look back 3 years. I think that’s probably a lucky period.
The options chain shows an implied volatility of 20.57%. There are quite a few puts being bought which is generally not a great sign. In aggregate, option traders do still seem positioned bullish.
It is possible for the share price to go down while the company beats on earnings and revenue because the market will also respond to forward-looking statements made by the company. These are actually more important. For example, a very bearish outlook from the CEO would imply multiple earnings events being impaired. Investors will adjust their expectations of future cash flow and the stock could fall. The options market isn’t extremely bearish but it is definitely not aligned with my expectations for beats on both counts. Perhaps the market expects macroeconomic changes to show up in JPM’s numbers first. In addition, the company generally goes down or barely moves on earnings (based on historical data), so perhaps buying puts isn’t a horrible position to begin with.
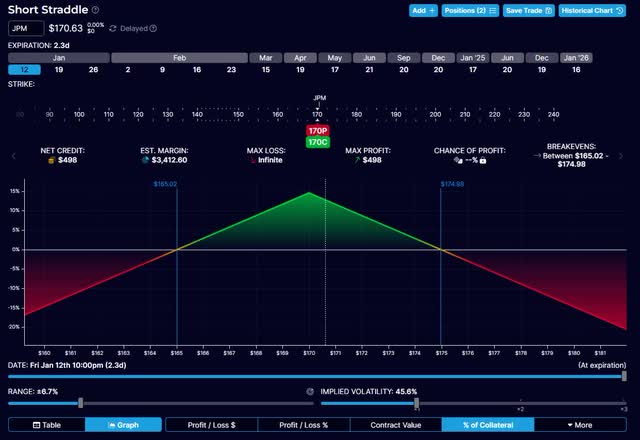
What seemed potentially interesting to me was to sell a straddle for January 12th with a strike of $170. The chart below shows the payoff profile for an option strategy where you sell both the $170 put and call.
short straddle payoff profile (optionstrat.com)
The strategy breaks even or is profitable as long as the price doesn’t go down more than 3.2% or goes up by 2.5% from the numbers I used here. In practice, the numbers will be different. The above also doesn’t factor in transaction costs. Wins will generally be small and losses potentially sizeable. When I looked at the last 12 earnings periods (day before until day after), the results were worse than 3.2% down 2x, and were better than 2.5% up 3x. The market doesn’t seem particularly volatile, and as I pointed out earlier, things have generally calmed down for banks during 2022. There was little in my earnings forecasting analysis that would make me sell my stock if I owned it or made me eager to buy it.
Analyst’s Disclosure: I/we have no stock, option or similar derivative position in any of the companies mentioned, and no plans to initiate any such positions within the next 72 hours. I wrote this article myself, and it expresses my own opinions. I am not receiving compensation for it (other than from Seeking Alpha). I have no business relationship with any company whose stock is mentioned in this article.
Seeking Alpha’s Disclosure: Past performance is no guarantee of future results. No recommendation or advice is being given as to whether any investment is suitable for a particular investor. Any views or opinions expressed above may not reflect those of Seeking Alpha as a whole. Seeking Alpha is not a licensed securities dealer, broker or US investment adviser or investment bank. Our analysts are third party authors that include both professional investors and individual investors who may not be licensed or certified by any institute or regulatory body.
Sign up here for a 14-day free trial of my weekly premium trade & investment ideas. Discover the best things I can find in this market. Unique and hard-to-find ideas, selected based on the presence of edge, outstanding risk/reward and being uncorrelated or being less correlated to the S&P 500.
