Summary:
- Netflix’s robust financials are marked by impressive revenue and net income growth, sound balance sheet management, and a 34.4% increase in free cash flow, reaching $5.9 billion on a TTM basis.
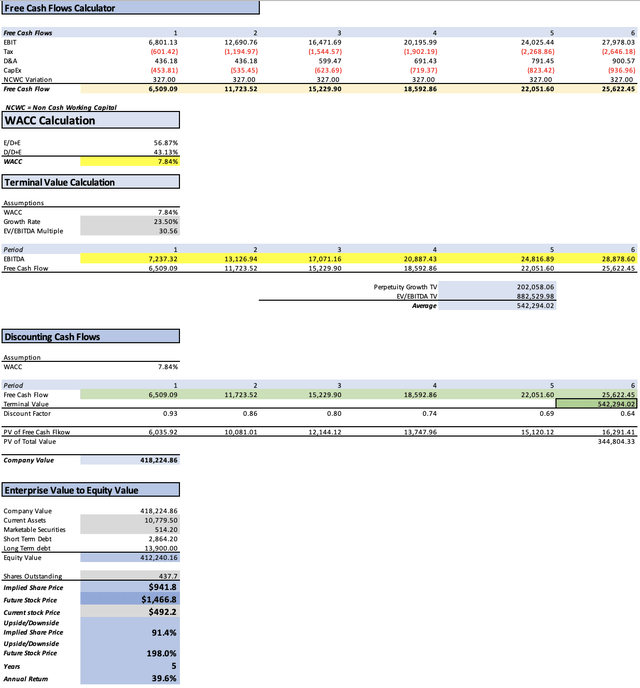
- DCF models project a 30.6% upside. I estimate a substantial 91.4% potential increase, setting a fair price at $941.8 and a future projection of $1,466.8.
- The Company’s capital-free revenue strategies, including password-sharing crackdown and ad-enabled plans, could potentially contribute $15.3 billion from ads by 2028.
- Intense content competition, exemplified by Disney’s consolidation into Disney+, poses challenges. Yet, Netflix’s adaptive strategies and the reversal of such decisions mitigate risks, minimizing valuation risks with an estimated 30.6% upside from analysts’ projections.
- Despite challenges, NFLX stands as a compelling investment with resilient financials, and the potential for substantial returns, positioning itself as a “strong buy”.
simpson33
Thesis
In my previous article on Netflix, Inc. (NASDAQ:NFLX), I computed a fair price per share at $829.3, factoring in potential earnings from advertising plans and the crackdown on account sharing. Since then, the stock has surged by 36.4%.
In this article, I will reassess my estimates, incorporating Netflix’s latest financial data to establish an updated target. I conducted two DCF models. The first, adhering to analysts’ projections, indicated an upside of approximately 30.6%. The second, relying on my own estimates derived from potential earnings from advertisements and the password-sharing crackdown suggested an upside of 91.4%. Consequently, the current fair price of the stock is positioned at $941.8, with a future price projection of $1,466.8. This unequivocally positions Netflix as a compelling buy.
Seeking Alpha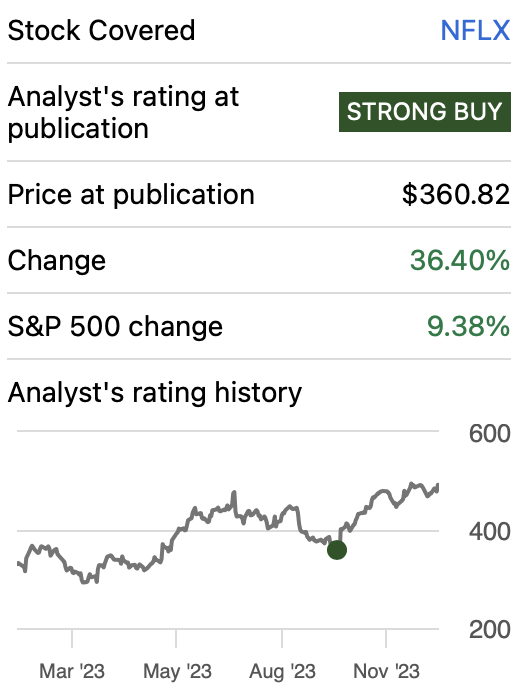
Overview
Market
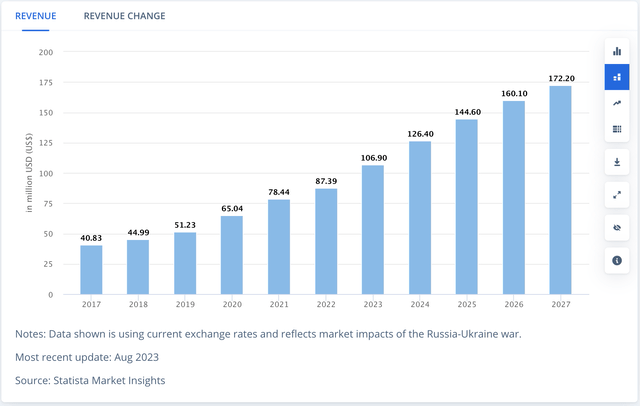
The global streaming market is projected to experience a robust Compound Annual Growth Rate [CAGR] of 12.66% from 2023 to 2027. This substantial growth rate also leaves room for Netflix to sustain its current pace, given that its forward revenue growth rate stands at approximately 8.75%.
Password-Sharing Crackdown
It is estimated that password sharing impacts a staggering 100 million passwords. This figure is notably significant because it suggests a vast number of individuals who share their login credentials. It’s important to recognize that password sharing doesn’t solely involve two individuals; it often extends to multiple family members, encompassing 3, 4, or even 5 people sharing a single account.
To put this in monetary terms, let’s assume that each of these 100 million passwords is shared with just one non-household member. This scenario results in 100 million non-paying users. If Netflix were to charge $7.99 for creating an additional slot for each non-household member, the potential revenue generated could amount to $799 million. However, it’s essential to note that this figure represents only approximately 2% of Netflix’s total revenue, making it a relatively modest contribution.
Financials
Netflix has demonstrated a remarkable revenue growth rate of 30%. From Q2 2023 to Q3 2023, Netflix saw a small 1.91% increase in its trailing twelve-month [TTM] revenue.
The upward trajectory continues with operating income, showing a robust growth rate of 102.7%. Over the period from Q2 2023 to Q3 2023, operating income increased by 6.80%. However, this pales in comparison to the remarkable annual growth witnessed in net income, soaring at approximately 118.3%. In the mentioned quarter-to-quarter span, net income increased by 6.57%.
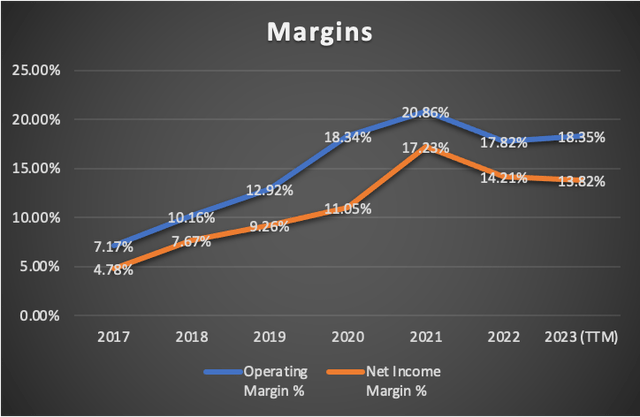
The net income margin stands at 13.82%, while the operating margin stands at 18.53%. Over the period from Q2 2023 to Q3 2023, margins increased by 0.6% and 0.84%, respectively.
Author’s Calculations Author’s Calculations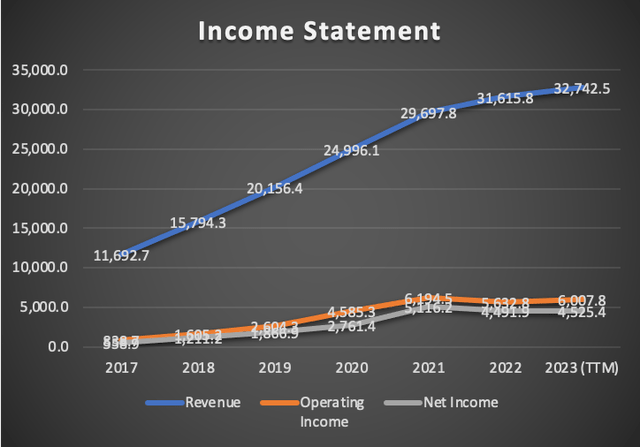
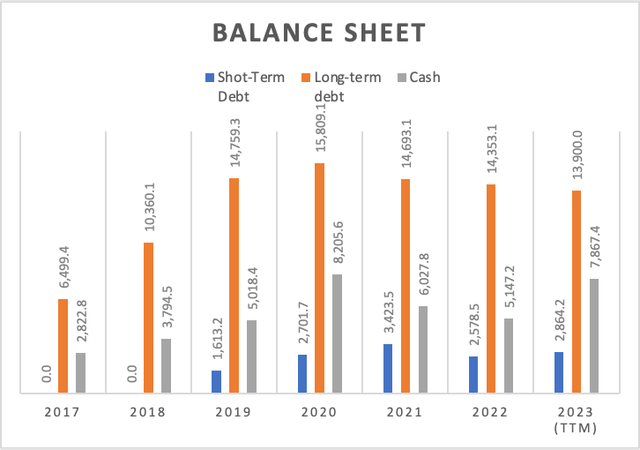
Netflix’s balance sheet remains in decent shape, with cash reserves covering around 46.9% of its total debt load. The cash reserves have exhibited substantial growth, with an annual rate of 29.8% since 2017. In contrast, total debt has grown at a modest annual rate of 26.3% since 2017. From Q1 2023 to Q4 2024, total debt decreased by $229.5 million, reflecting a 1.34% decrease, while cash surged by 2.67%, resulting in a nominal increase of $204.6 million.
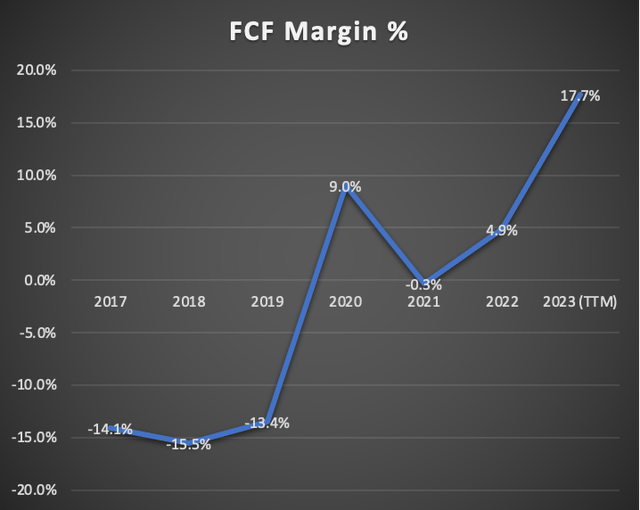
Netflix’s free cash flow continues to underscore its financial strength. Currently generating approximately $5.9 billion in free cash flow on a trailing twelve-month [TTM] basis, this reflects a noteworthy 34.4% increase from Q2 2023. Although the free cash flow margin remains robust at 17.7%. Despite this, the overall trend in free cash flow is positive, experiencing a robust growth rate of 75.4%.
Author’s Calculations Author’s Calculations Author’s Calculations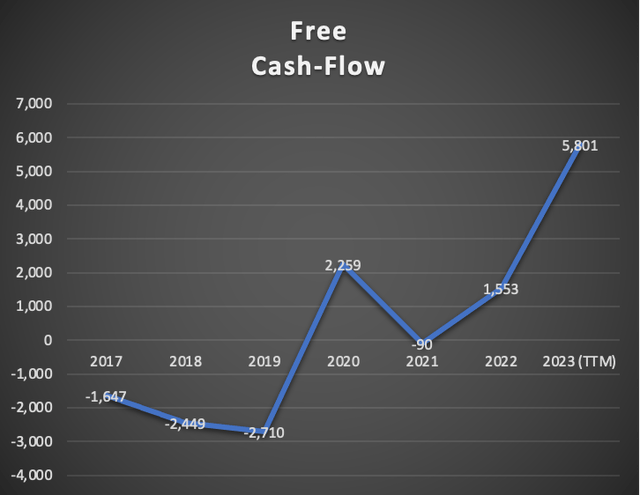
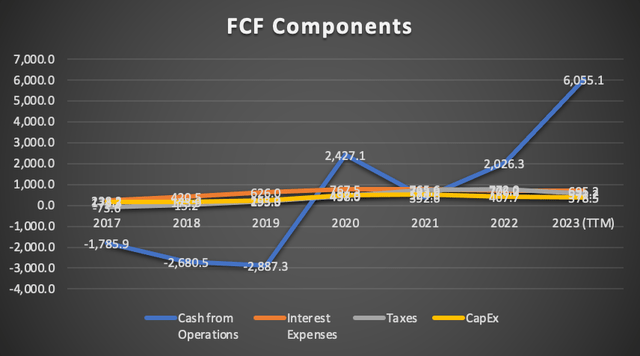
In conclusion, Netflix stands out as a robust company, showcasing impressive revenue and net income growth, maintaining a solid balance sheet, and exhibiting substantial free cash flow growth.
Valuation
To conduct this valuation, I’ll employ two DCF models. The first one will be based on estimates for revenue, EPS, revenue growth, and 3-5 year long-term EPS growth.
The second model will be based on the possible future revenue and net income that Netflix could have if they successfully implement their ad-enabled tier to the vast majority of their audience and if the password-cracking efforts yield the results I am expecting.
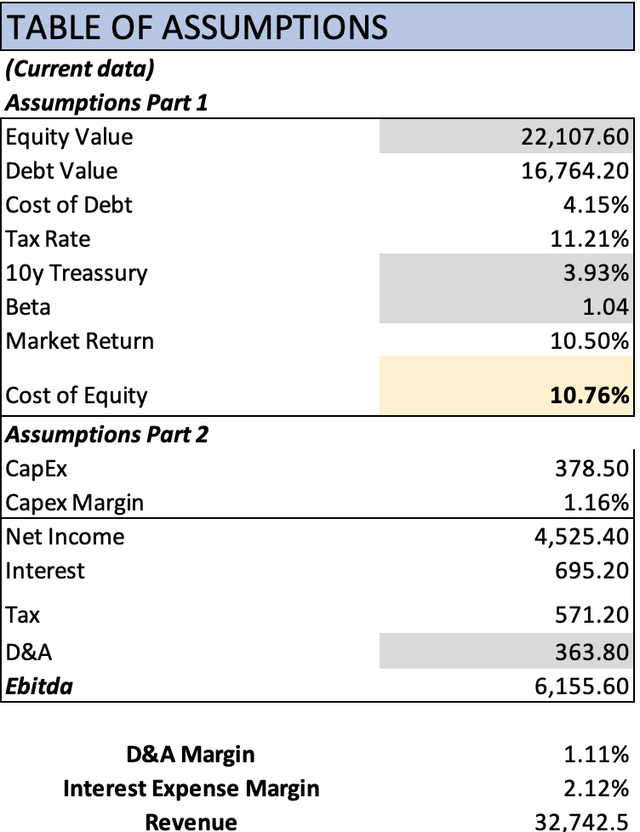
To initiate this analysis, I’ve gathered all the current financial data for Netflix on a trailing twelve-month [TTM] basis. This dataset will aid in the calculation of the Weighted Average Cost of Capital [WACC]. Notably, I have endeavored to project Depreciation and Amortization [D&A] as well as Interest expenses, with their margins intricately linked to revenues.
Analysts’ Estimates
In this preliminary model, I will evaluate Netflix based on current analyst estimates. Commencing with revenue, FY2023 projections indicate an expected figure of $33.6 billion, with analysts anticipating a subsequent increase to $38.19 billion for FY2024.
For EPS, forecasts are set at $12.26 for FY2023 and $15.93 for FY2024. When multiplied by the total number of shares outstanding, these estimates result in net incomes of $5.36 billion and $6.97 billion, respectively. This trajectory signals a significant upside of 29.93 from FY2023 to FY2024, reflecting a more than decent double-digit growth.
Analysts also project a forward revenue growth of 8.72%, which will serve as the basis for projecting revenues beyond FY2024. Additionally, a 3 to 5-year EPS growth rate of 23.5% is expected, providing a foundation for projecting net income in the model.
| Revenue | Net Income | Plus Taxes | Plus D&A | Plus Interest | |
| 2023 | $33,630.0 | $5,366.20 | $5,967.62 | $6,341.28 | $7,055.32 |
| 2024 | $38,190.0 | $6,972.56 | $7,754.01 | $8,127.67 | $8,841.71 |
| 2025 | $41,520.2 | $8,611.11 | $9,576.20 | $10,037.53 | $10,919.10 |
| 2026 | $45,140.7 | $10,634.72 | $11,826.61 | $12,328.16 | $13,286.61 |
| 2027 | $49,077.0 | $13,133.88 | $14,605.86 | $15,151.15 | $16,193.17 |
| 2028 | $53,356.5 | $16,220.35 | $18,038.24 | $18,631.08 | $19,763.96 |
| ^Final EBITA^ |
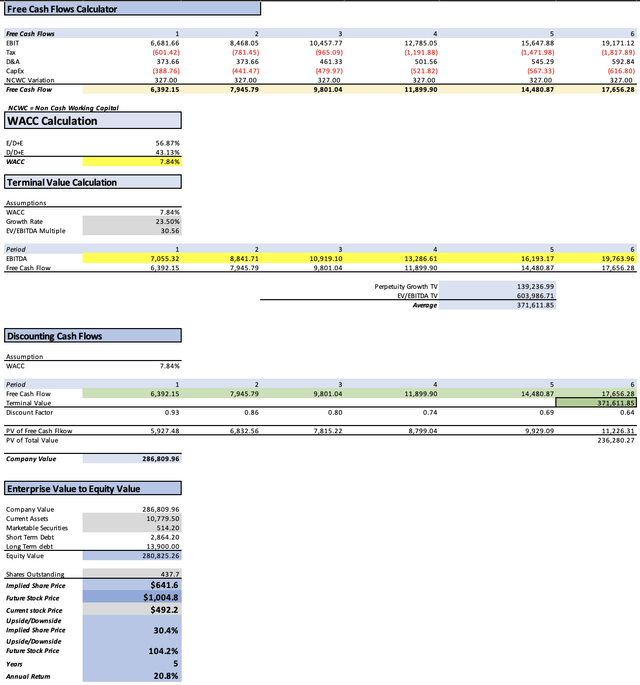
As evident from analysts’ estimates, Netflix continues to present a significant upside of approximately 30.4%. This equates to a fair price per share of $641.6. Moreover, projecting forward to 2028, the anticipated future price stands at $1,004.8, promising robust annual returns of 20.8%.
My Estimates
The impact of password cracking on Netflix’s revenue would, at most, result in a one-time increase of 3-4% in its revenue. This increase is relatively inconsequential in the context of Netflix’s overall valuation. However, the real value lies in advertising.
To project Netflix’s potential earnings from advertisements, I will use Hulu as a benchmark. Hulu has approximately 30 million subscribers from its base of 48 million, and these subscribers are enrolled in the ad-enabled plan, which is priced similarly to Netflix’s subscription. This 30 million represents about 62.5% of Hulu’s subscriber base. Applying the same proportion to Netflix’s 238 million subscribers, we can theoretically estimate that Netflix could have around 148.75 million subscribers with ad-enabled plans. Then I will assume that Netflix will add 24.76 million people annually to these plans which could either, come from already existing plans, or new subscribers. Then I multiply that by $103 which is what Hulu may be earning per subscriber when you divide their 2022 $3.1 billion ad revenue for 2022 by the 30 million subscribers enrolled for Hulu’s ad-supported plan. According to many surveys, the percentage of people willing to do so is over 30%. As of December 2023, Netflix has around 23 million users on its ad-enabled plan which indicates that adding 24.76 million users on the ad-enabled plan is possible.
These endeavors are essentially capital-free. Activities such as cracking down on password sharing and reducing subscription prices to incorporate advertisements entail minimal operating expenses, resulting in nearly pure profit. The minimal operating expenses lie in the infrastructure needed to deliver those ads which in the case of Netflix, is done by Microsoft Corporation (MSFT).
Nevertheless, we need to take into consideration that Hulu charges around $10-$30 per 1,000 views, while Netflix charges way more, around $39-$45, which could mean that Netflix could earn way more than what I am projecting.
| Netflix’s Revenue | Advertisements | Password Cracking | |
| 2022 | 31,615.8 | ||
| 2023 | 35,618.4 | 2,550.3 | 1,088.4 |
| 2024 | 40,127.6 | 5,103.7 | 1,088.4 |
| 2025 | 45,207.8 | 7,657.0 | 1,088.4 |
| 2026 | 50,931.1 | 10,210.4 | 1,088.4 |
| 2027 | 57,379.0 | 12,763.8 | 1,088.4 |
| 2028 | 64,643.2 | 15,321.3 | 1,088.4 |
The revenue for this projection will grow at the expected Streaming Market Revenue growth rate of 12.66%. The net income will be calculated using the average net income margin registered from 2017 to 2023 TTM, which is 11.14%. Subsequently, the revenue from advertisements and password cracking will be added to the net income. This implies that by 2028, Netflix is projected to achieve a net income margin of 28%.
| Revenue | Net Income | Plus Taxes | Plus D&A | Plus Interest | |
| 2023 | $39,257.0 | $5,366.20 | $5,967.62 | $6,403.80 | $7,237.32 |
| 2024 | $46,319.7 | $10,662.27 | $11,857.24 | $12,293.42 | $13,126.94 |
| 2025 | $53,953.2 | $13,781.57 | $15,326.13 | $15,925.61 | $17,071.16 |
| 2026 | $62,229.9 | $16,972.52 | $18,874.71 | $19,566.14 | $20,887.43 |
| 2027 | $71,231.2 | $20,244.18 | $22,513.04 | $23,304.49 | $24,816.89 |
| 2028 | $81,052.8 | $23,610.90 | $26,257.08 | $27,157.66 | $28,878.60 |
| ^Final EBITA^ |
As evident, the potential fair price for Netflix is estimated at $941.8, indicating a substantial upside of approximately 91.4%. Looking ahead to 2028, the model suggests a future price of $1,466.8, translating into impressive annual returns of 39.6% over the course of that year.
Risks to Thesis
The primary concern for Netflix consistently revolves around the fierce competition for content. The platform’s extensive library and ability to produce high-quality shows are pivotal for its survival. Notably, The Walt Disney Company (DIS) exacerbated this challenge during the onset of the pandemic by hoarding their shows into Disney+, delivering one of the most impactful blows Netflix could have faced. However, this decision has since been reversed as Bob Iger seeks to maximize every potential revenue stream.
Turning to the valuation aspect, the risk centers on Netflix potentially falling short of the optimistic targets I am outlining. While this could undoubtedly impact the valuation, I posit that it shouldn’t instill fear, especially considering the model based on analysts’ estimates indicates an upside of approximately 30.6% and annual returns of 20.8%. In my view, these figures provide ample leeway for any potential margin of error.
Conclusion
In conclusion, Netflix emerges as a robust contender in the streaming market, demonstrating remarkable revenue and net income growth, maintaining a solid balance sheet, and showcasing substantial free cash flow growth. The company’s upward trajectory is further underscored by a fair price per share of $941.8 and a future price projection of $1,466.8, reflecting an impressive upside of 91.4% and annual returns of 39.6% in 2028. Despite challenges such as intense content competition and past disruptions like Disney’s consolidation into Disney+, Netflix’s resilience is evident. The risks posed by potential shortfalls in achieving optimistic targets are mitigated by the model based on analysts’ estimates, projecting an upside of 30.6% and annual returns of 20.8%. As Netflix continues to adapt and innovate, the presented analysis positions it as an enticing investment opportunity in the evolving landscape of streaming services.
Analyst’s Disclosure: I/we have no stock, option or similar derivative position in any of the companies mentioned, but may initiate a beneficial Long position through a purchase of the stock, or the purchase of call options or similar derivatives in NFLX over the next 72 hours. I wrote this article myself, and it expresses my own opinions. I am not receiving compensation for it (other than from Seeking Alpha). I have no business relationship with any company whose stock is mentioned in this article.
Seeking Alpha’s Disclosure: Past performance is no guarantee of future results. No recommendation or advice is being given as to whether any investment is suitable for a particular investor. Any views or opinions expressed above may not reflect those of Seeking Alpha as a whole. Seeking Alpha is not a licensed securities dealer, broker or US investment adviser or investment bank. Our analysts are third party authors that include both professional investors and individual investors who may not be licensed or certified by any institute or regulatory body.

