Summary:
- We predict that Apple stock will continue to rise in 2024, with a year-end price target of $214-240/share.
- The analysis is based on our expected degree of institutional demand for US equities, which if we’re correct will mean Apple stock is lifted with the market overall.
- We are unenthused by fundamentals – the balance sheet is a fortress, but growth has been missing in action for a while now – that doesn’t change our price target.
- We rate at Hold.
davelogan/iStock via Getty Images
DISCLAIMER: This note is intended for US recipients only and, in particular, is not directed at, nor intended to be relied upon by any UK recipients. Any information or analysis in this note is not an offer to sell or the solicitation of an offer to buy any securities. Nothing in this note is intended to be investment advice and nor should it be relied upon to make investment decisions. Cestrian Capital Research, Inc., its employees, agents or affiliates, including the author of this note, or related persons, may have a position in any stocks, security, or financial instrument referenced in this note. Any opinions, analyses, or probabilities expressed in this note are those of the author as of the note’s date of publication and are subject to change without notice. Companies referenced in this note or their employees or affiliates may be customers of Cestrian Capital Research, Inc. Cestrian Capital Research, Inc. values both its independence and transparency and does not believe that this presents a material potential conflict of interest or impacts the content of its research or publications.
Leave Your iPhones At The Door
By Alex King
Let’s get to the punchline first. We believe Apple Inc. (NASDAQ:AAPL) stock can run up a little way yet, and we have a 2024 year-end price target in the range of $214-240/share. That’s 17%-31% up from today’s closing price. We rate the stock at Hold accordingly, because that’s not really enough upside to get excited about – so not an Accumulate rating – but we think the market will run up in 2024 and take AAPL stock with it – so not a Distribute rating.
Why own AAPL stock at this point? Well, speaking personally, I don’t. Not directly anyway, though my largest two personal account holdings are (TQQQ) and (UPRO), and AAPL is typically the largest underlying stock in those 3x index ETFs. We believe the Nasdaq and the S&P 500 will close the year meaningfully higher than today, a result of institutional demand for US equities at large, and that demand for equities will pull AAPL stock upwards with it. In short, if large account players want to build US equities exposure – and we think they do – then we believe AAPL stock will rise. Do we think there’s something special in Apple fundamentals supporting that bull logic? We do not. The company numbers look like a slowly atrophying oligopolist to our old, tired and cynical eyes, but the numbers have looked that way for a year or so now and that hasn’t stopped the stock from ripping up around 50% from the 2023 lows to the current price. As always, the price of a security is determined directly by the demand for and supply of that security, not by the number of phones sold, whether the issuer’s phones are better or worse than some other issuer’s phones or not, or the gross margin achieved, or any other such input factor.
Apple Fundamental Analysis
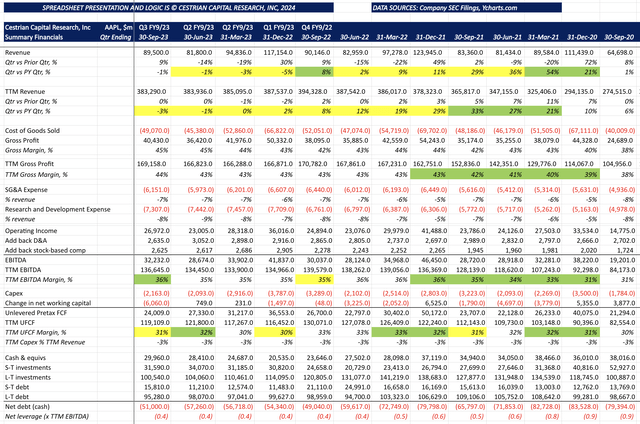
Let’s take a look at the numbers up to and including the September 2023 quarter.
AAPL Fundamentals (Company SEC Filings, YCharts.com, Cestrian Analysis)
First, the good.
- The balance sheet is stronger than that of any nation-state that springs to mind. $51bn of net cash. Even if suddenly all of Apple’s cash and cash equivalents, long- and short-term investments disappeared into nothingness, it would still be less than 1x TTM EBITDA or 1x TTM unlevered pretax FCF levered. That’s the margin of safety right there.
- EBITDA and cash flow margins are strong at 36% and 31%, respectively, both on a TTM basis, and even better, those two margins are pretty similar, a function of Apple not wasting much capex (it’s just 3% of revenue) and not letting cash leak out the door by getting sloppy with working capital management.
Then the bad.
- Growth. There isn’t any. And hasn’t been since the September 2022 quarter. At some point, this will matter, but it didn’t matter from September 2022 to today and we don’t think it will matter for a little while yet.
Valuation?
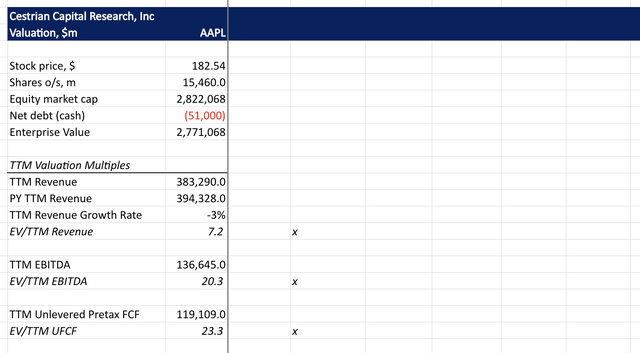
Apple Stock Valuation Analysis
Sort of a nothingburger really. Not expensive and not cheap on cash flow, revenue multiple looks punchy vs. the growth rate, but that’s an arithmetic function of the high margins rather than the market being blind to the lack of growth.
AAPL Valuation Analysis (Company SEC Filings, YCharts.com, Cestrian Analysis)
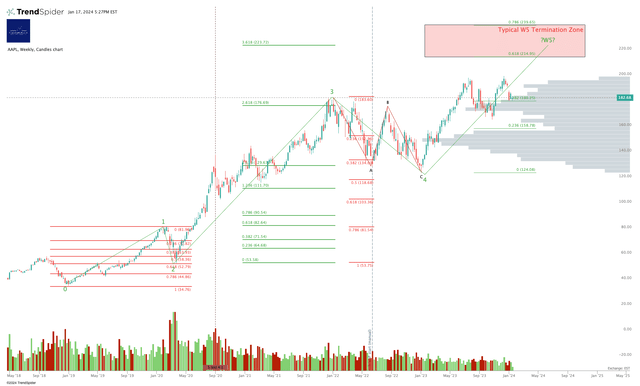
The real story of AAPL stock for us lies in the chart. Here’s our take.
Apple Stock Technical Analysis
AAPL Chart (TrendSpider.com, Cestrian Analysis)
This is a very pretty chart if you care to use the Elliott Wave / Fibonacci extension/retracement method of pattern recognition. There are many other excellent forms of chart analysis but this one works for us. We like to add in the volume x price profile – that’s the gray bars on the right-hand side of the chart – to help us form a view on institutional accumulation vs. distribution behavior.
Here’s the story of AAPL stock since 2018 looking through this particular technical lens.
- From the lows at the end of 2018, when the Fed switched tack from tight to loose monetary policy, AAPL runs up from around $36/share to $82/share, split-adjusted, peaking right before the COVID crisis hits to put in a Wave 1 high.
- Along comes the COVID dump and AAPL finds support at precisely the .618 Fibonacci retracement of that Wave 1 up. The Wave 2 low is in at around $53/share in late March 2020.
- We then see Wave 3 peaking slightly above the 2.618 Fib extension of Wave 1 placed at the Wave 2 low. Or in short, a big ole bull run up.
- The 2022 rate hike cycle kicks in, but AAPL proves highly resilient, falling only to somewhere between the .386 and the .5 retracement of that giant Wave 3 up. The Wave 4 low is in during January 2023 at around $125/share.
If you knew nothing about iPhones or EBITDA or anything else, but you were handy at pattern recognition, you would say, well, this pattern often ends with a final Wave 5 up terminating at between the .618 and the .786 extension of the Wave 1-3 combined. Sound complicated? It isn’t. Measure the stock price change from the Wave 1 low at the end of 2018 to the Wave 3 high in late 2021/early 2022. Multiply that number, we’ll call it X, by .618 and add the number you get to the stock price at the Wave 4 low. That’s the low end of the typical Wave 5 termination zone. Now multiply X by .786 and add the number you get to the stock price at the Wave 4 low. That’s the high end of the typical Wave 5 termination zone. Sound dumb? We agree. Does it work more often than you might think? It does. Why? Because large accounts trade to these patterns. (Or something to do with seashells and the Earth’s magnetic field, you choose).
Is Apple Stock A Buy, Sell, Or Hold For 2024?
So, in short, we think the market will likely close 2024 up materially from here, and we think AAPL stock will continue to be a hugely important index constituent. So if demand for US equities is up so too will be demand for AAPL stock, and we think that is a perfect setup to measure with Fib extensions, because market bigs are at the wheel here, not fundamentalists or hobbyists. Which says to us, a year-end target of $214-240 range, rating, Hold.
Cestrian Capital Research, Inc, 17 January 2024.
Analyst’s Disclosure: I/we have a beneficial long position in the shares of TQQQ, UPRO either through stock ownership, options, or other derivatives.
Business relationship disclosure: See disclaimer text at the top of this article.
Cestrian Capital Research, Inc staff personal accounts hold long positions in TQQQ and UPRO, each of which are likely to benefit from a rise in AAPL stock.
Seeking Alpha’s Disclosure: Past performance is no guarantee of future results. No recommendation or advice is being given as to whether any investment is suitable for a particular investor. Any views or opinions expressed above may not reflect those of Seeking Alpha as a whole. Seeking Alpha is not a licensed securities dealer, broker or US investment adviser or investment bank. Our analysts are third party authors that include both professional investors and individual investors who may not be licensed or certified by any institute or regulatory body.
GET INSTITUTIONAL GRADE BUYSIDE RESEARCH FROM CESTRIAN CAPITAL RESEARCH
We provide investment research prepared to institutional investor quality, presented in a way anyone can understand. Our work allows you to make sense of company fundamentals and stock technicals without resort to jargon or esoterica. We offer Free, Basic and Full membership tiers in our “Growth Investor Pro” service here on Seeking Alpha. Join us! Click HERE to learn more.

