Summary:
- Microsoft Corporation has invested heavily in research and development and acquisitions, totaling almost $172 billion and $75 billion respectively over the past decade.
- The company believes that generative AI will have a transformative impact on business productivity and is positioning itself to be a leader in this field.
- Microsoft’s strategic priorities include maintaining its position as the top commercial cloud provider, leading the AI platform wave, and aligning its cost structure with revenue growth.
- My scenario for Microsoft is for high revenue growth, high operating margins and high reinvestment requirements which are all contributing to an intrinsic value similar to the current market price.
Chris Hondros
Business Overview
Microsoft Corporation (NASDAQ:MSFT) started life as a technology leader. It has grown its revenues by developing technologies in-house through investments in research and development and by the acquisition of other innovative companies.
Over the last 10 years, Microsoft has invested almost $172 billion in research and development (13% of revenues) and $75 billion in acquisitions (almost 6% of revenues).
New Age of Generative AI
Microsoft apparently believes that the next generation of Artificial Intelligence (AI) will reshape every software category and every business. This is potentially a fundamental technology shift. Over the years, the technology sector has undergone a series of step-change transitions, such as from PC / Server to Web / Internet and to Cloud / Mobile.
Generative AI has the potential to fundamentally transform productivity for every individual, organization, and industry.
There are suggestions that Microsoft was slow to embrace the changes that took place in historical technology sector transitions – the step changes that took place in search and in mobile.
Current management has indicated it wants to be at the front of the AI technology transition, and as a result the company appears to be going all out to ensure that it becomes a Generative AI leader.
Strategic Priorities
Microsoft has identified 3 priorities:
- Maintain its lead as the top commercial cloud provider.
- Invest to lead the AI platform wave across the Microsoft solution areas.
- Drive operating leverage by aligning its cost structure with revenue growth.
Microsoft has used its financial size to drive its technology leadership, and this is demonstrated by the following chart which shows the historical level of annual investment that the company has made to support its strategy:
Author’s compilation using data from Microsoft’s 10-K filings.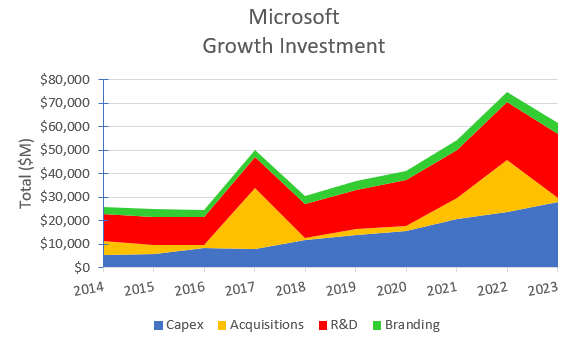
OpenAI Investment
The key to Microsoft’s AI strategy is its investment in OpenAI.
Open AI’s founders formed the company in 2015 as a not for profit AI research company. As the company expanded its research initiatives, it required more capital than many of its founders were willing to provide. In FY2019, Microsoft made its initial investment of $1 Billion in OpenAI.
OpenAI is not a public company and, therefore, it is not obligated to make any public disclosures about any changes in its shareholders’ holdings.
There have been media reports that Microsoft made a further investment in April FY2023 and that its total investment may now be about $13 Billion. It is rumored that this investment gave Microsoft a 49% shareholding in OpenAI but it is not entitled to board representation.
According to OpenAI’s web site, it has recently changed its corporate status from a not-for-profit company to a “capped-profit” model where shareholders have agreed to a defined exit multiple for their investments.
Microsoft claims that its OpenAI investment benefits are:
- A perpetual right to use the OpenAI intellectual property.
- The ability to independently commercialize the resulting AI technologies.
- To be the exclusive cloud provider to OpenAI.
Microsoft discloses very little about its OpenAI investment in its 10-K filings. There is no disclosed balance sheet entry for the investment, and there are no cash flow entries showing annual payments (additional capital) to OpenAI.
I am surprised that more questions are not asked by the investment community, particularly in order to better understand whether the OpenAI investment is material to Microsoft’s valuation.
Microsoft’s Operating Divisions
Microsoft’s CEO, Satya Nadella, many years ago defined Microsoft as a technology company aiming to build the best-in-class platforms and productivity services for a mobile-first, cloud-first world. The current divisional structure reflects that ambition and has been in place since FY2016 (with financials going back to FY2014):
Productivity & Business Processes Division
This division comprises a broad portfolio of productivity, communication, and information services that span devices and platforms. The cornerstone product suites of this division are Office 365, Microsoft 365, LinkedIn, and Dynamics.
The division’s historical revenues and reported operating margins are:
Author’s compilation using data from Microsoft’s 10-K filings.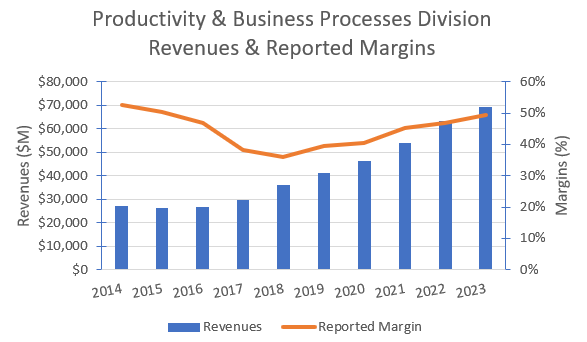
The vast bulk of the division’s revenues come from subscriptions. The chart shows that the division is exhibiting very steady revenue growth and was not impacted by the COVID pandemic. The trailing 12-month (TTM) growth rate peaked during Q3 FY2022 and had been declining until recently. The TTM growth rate appears now to be steady at around 10%.
Intelligent Cloud
This division predominantly comprises server products and cloud services such as Azure, SQL server, Windows server, enterprise services and some of the recent acquisitions Nuance and GitHub.
The division’s historical revenues and reported operating margins are:
Author’s compilation using data from Microsoft’s 10-K filings.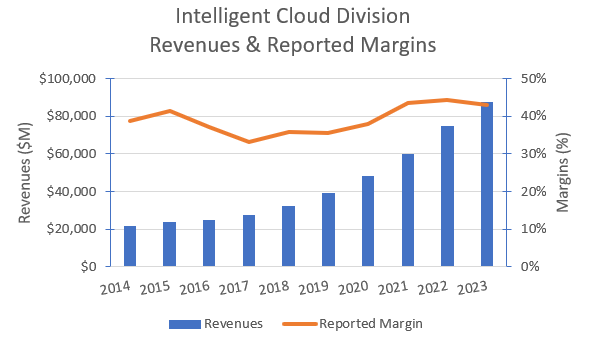
This division will be Microsoft’s future growth engine. The division’s 5-year revenue compound annual growth rate (CAGR) at the end of Q1 FY2024 was 22%, but it should be noted that the current TTM growth rate is 17%. The division’s TTM growth rate peaked at the end of Q3 FY2022 and has been declining each quarter ever since.
At the end of FY2022 the size of the cloud infrastructure services market has been estimated by industry consulting company GlobeNewsWire to be $113 billion. They estimate that this market will grow at 18% per year for the next 10 years.
Statista estimates that at the end of FY2022, Microsoft’s market share in the cloud infrastructure market was 23% with the market leader being Amazon AWS with 32%.
Personal Computing Division
This division predominantly comprises revenues from Windows’ product subscriptions, sales of hardware devices, sales of gaming consoles and game subscriptions, and the sales of digital advertising and search engines.
The division’s historical dividends and margins are:
Author’s compilation using data from Microsoft’s 10-K filings.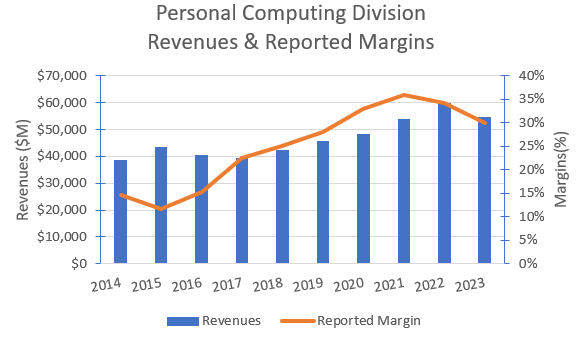
The chart indicates that this is Microsoft’s most volatile division. All the product groups in the division are volatile but particularly devices. The division’s long-term annual revenue growth rate has been around 4%.
Microsoft’s Historical Financial Performance
Revenues and Adjusted Operating Margins
The following chart shows Microsoft’s reported aggregated sales and adjusted operating margins for the last 10 years:
Author’s compilation using data from Microsoft’s 10-K filings.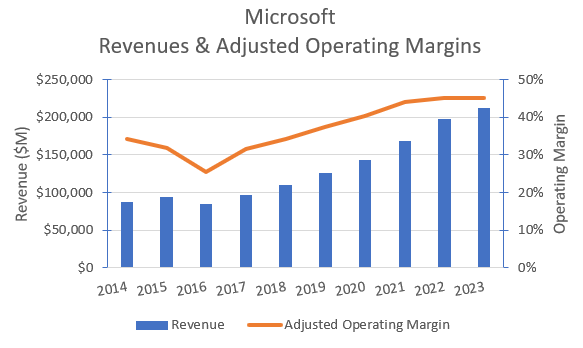
Readers should be aware that I have made 2 adjustments to Microsoft’s reported Income Statement to better represent its true operating costs and the investments required to support the company’s growth:
- Research & Development (R&D) is a long-term investment, so I have turned the reported R&D expense into a capital item with a 3-year and added an amortization expense to the restated Income Statement.
- Branding is also a long-term investment, so I have assumed that 20% of the Marketing expense is a capital item with a 3-year life.
My adjustments have increased Microsoft’s reported operating margins by approximately 3% (note that the earlier charts showing divisional margins were as reported by Microsoft with no adjustments).
Aggregate revenues had been growing strongly for several years and the TTM revenue growth peaked at 20% during Q2 FY2021. More recently revenue growth has been slowly declining and was 8% at the end of Q1 FY2024.
Margins have also increased significantly during this period and at Q4 FY2023 margins reached their highest levels at 45.3%.
Typical technology sector reported margins are 8% but this reflects the broad range of companies in the sector. I estimate that Microsoft’s margins are in the sector’s highest decile.
Cash Flows
The following table summarizes Microsoft’s cash flows for the last 10 years:
Author’s compilation using data from Microsoft’s 10-K filings.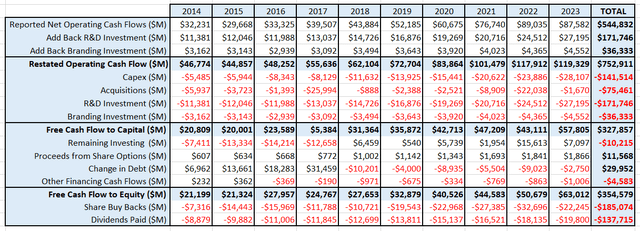
This table helps to explain the approach that I have taken to restating Microsoft’s Income Statement.
Over the last 10 years $208 billion of investments were expended through the Income Statement and $216 billion was spent on “traditional” reinvestment (capex and acquisitions).
Microsoft’s level of expensed investment as a percentage of revenues has been reasonably steady for the last 10 years at between 12% to 14%.
Microsoft is a spectacular generator of free cash flow. By my analysis, there are very few companies that generate more free cash flow per unit of revenue.
A high-level summary of Microsoft’s cash flows for the last 10 years is:
- The business generated adjusted operating cash flows of $753 billion.
- It reinvested $328 billion back into the business.
- Additional debt of $30 billion was taken on.
- A total of $323 billion was returned to shareholders in a combination of dividends and share-buybacks.
The dividend has increased every year since FY2004, and based on the current cash flows I see no reason why that trend won’t continue into the foreseeable future.
Capital Structure
The following chart shows the history of Microsoft’s capital structure over the last 10 years:
Author’s compilation using data from Microsoft’s 10-K filings.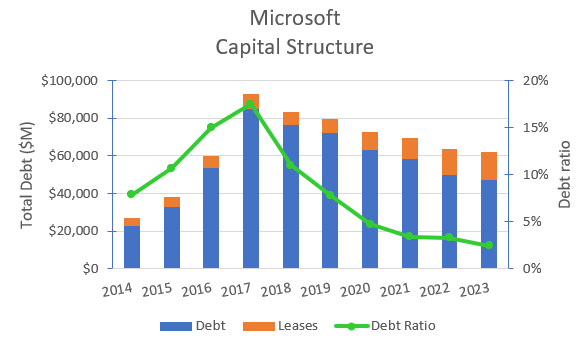
Microsoft’s debt ratio is currently 3% and the sector’s median ratio is 4%.
Interestingly since FY2017, Microsoft has been reducing its debt load (which causes its cost of capital to increase). The company appears to have been reluctant to veer from the typical technology sector’s debt ratio even though its cash flows could easily support higher debt levels.
Return on Invested Capital
The following chart shows the history of Microsoft’s return on invested capital over the last 10 years:
Author’s compilation using data from Microsoft’s 10-K filings.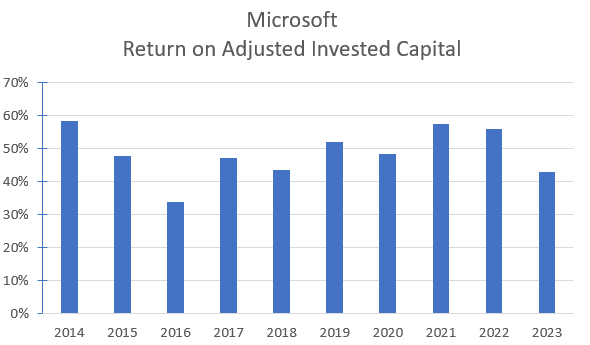
Readers should note that my calculated return on invested capital (ROIC) will be lower than that reported because of the adjustments that I made to the Income Statement to account for the expensed investments.
Microsoft’s ROIC has been reasonably stable and is excellent. The technology sector’s ROIC has a wide range of values because of the diversity of the companies within the sector (from profitless start-ups to extremely profitable companies). The sector’s median ROIC is currently 16%.
My Investment Thesis for Microsoft
At the time of writing this report, the FY2024 2nd quarter has finished, but Microsoft is not due to publish their updated financial statements for another 2 weeks.
At the end of Q1, Microsoft’s trailing 12-month (TTM) revenues were $218,310 M (7.5% higher than the prior year) and the TTM operating margin is still rising.
The current consensus revenue forecast for FY2024 is $243,310 M and it is projected that FY2025 revenues will be $277,470 M. This equates to a 14% annualized growth rate.
The current macroeconomic signals for the U.S. are mixed. The bond market is forecasting significantly lower inflation and lower interest rates for FY2024. In my opinion this appears to be indicating a slowing economy.
My scenario for Microsoft is:
Growth Story
The optimism for Microsoft’s future is associated with its developments in the Generative AI space. I believe that Microsoft’s Intelligent Cloud division can comfortably grow revenues at 20% per year for the next 6 years (slightly above the predicted market cadence due to its superior product offering).
Similarly, I think that the Productivity & Business Processes Division can continue to grow revenues by 15% per year for the next 6 years. The subscription revenues are very sticky and unless there is a major long-term slump in employment, I see little reason for this division not to be able grow volumes and prices into the future.
The Personal Computing division is more problematic than the others. Revenues will get a near-term boost from the recent Activision acquisition, but over the long term I am forecasting divisional revenue growth of 5% per year for the next 6 years.
Margin Story
Microsoft’s operating margins are already very high relative to its sector competitors. I see no reasons why this should change over the forecast period. Remember that I use an adjusted operating margin which is up to 3% higher than the reported margin.
The biggest unknown in this valuation is where the long-term operating margin for the Intelligent Cloud division will finish. Management has been cautioning that near-term margins may decline during the product development stage. Over the longer term, I suspect that margins for this division may remain at their current levels or at best slightly higher as a result of market competition.
The Productivity & Business Processes division’s margins should continue to increase as the product suite continues to mature and requires less product development.
I am forecasting that the Personal Computing division’s margins will remain relatively flat over the forecast period.
Growth Efficiency
Microsoft’s total reinvestment back into its business has doubled over the last 5 years, and there appear to be indications that recent levels may need to be maintained for some time into the future to support the product development associated with Generative AI.
I measure capital efficiency for growing companies as revenue / invested capital. Microsoft’s historical ratio was for many years around 1.5 (every $1 of investment generated $1.5 in revenues). The sector’s global median ratio is 1.2 (less revenues are generated per unit of investment).
Over the last couple of years, Microsoft’s ratio has been trending lower towards the sector’s global median, and for my scenario I have used the global ratio in order to reflect the higher level of reinvestment required to support the expected growth.
Risk Story
I have created a very optimistic scenario for Microsoft.
Readers should be aware that historically Microsoft’s revenues and margins appear to have been reasonably sensitive to the strength of the global economy and particularly the level of unemployment.
If the global economy slows down and enters a significant recession over the coming months, then I would expect that Microsoft’s business would also be impacted.
Microsoft is entering the next part of the economic cycle with a very strong balance sheet and a debt ratio lower than the sector average. For these reasons, I estimate that Microsoft’s current cost of capital is around the sector median, which due to its low debt levels is probably higher than the typical U.S.-listed company.
Over the long term, I have forecast that Microsoft’s cost of capital will decline to the median level of all U.S.-listed companies as management accepts that a mature company can increase its debt ratio.
Competitive Advantages
Microsoft’s operating model is clearly superior to its sector competitors, as demonstrated by its historically high revenue growth, high operating margins, and high returns on capital.
There is strong evidence to suggest that Microsoft has a sustainable competitive advantage which will allow its terminal ROIC to remain above its cost of capital at around 12%.
Valuation Assumptions
The following table summarizes the key inputs into the valuation:
Author’s valuation model assumptions.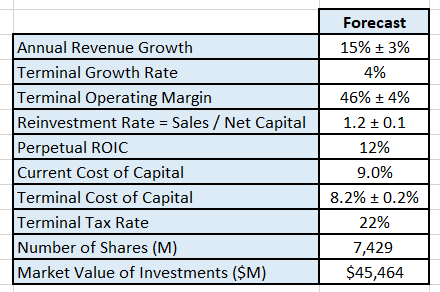
A couple of technical issues to be noted with the valuation inputs:
- I have assumed that Microsoft’s effective tax rate progressively increases over time to the U.S. marginal tax rate.
- I have converted the book value of equity investments on Microsoft’s balance sheet to an estimated market value by multiplying by the sector’s current median price to book ratio (3.98). The key component here is the valuation of Microsoft’s 49% holding in OpenAI.
Discounted Cash Flow Output
The output from DCF model is in $USD:
Author’s DCF model output. Author’s DCF model output.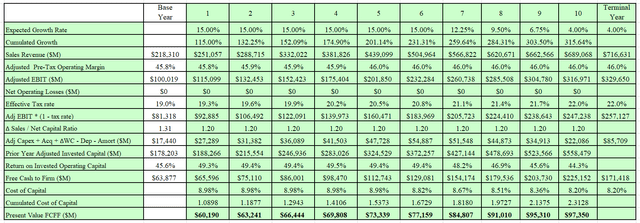
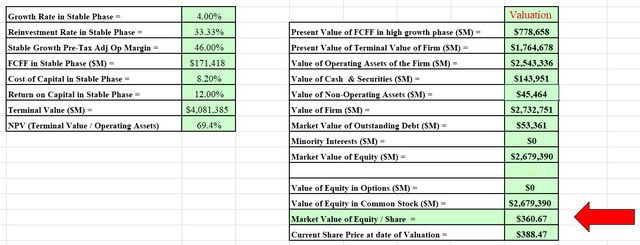
I also developed a Monte Carlo simulation for the valuation based on the range of inputs for the valuation. The output of the simulation was developed from 100,000 iterations:
Author’s DCF model Monte Carlo simulation output.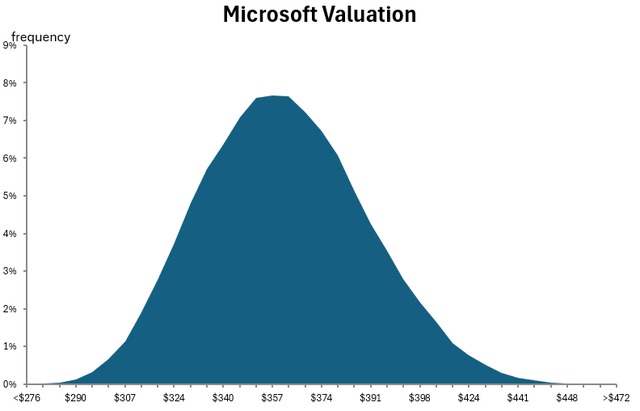
The simulation can help us understand the major sources of sensitivity in the valuation. In my scenario, the valuation is very sensitive to the expected revenue growth and to a lesser degree the operating margin. These two inputs represent the greatest source of risk in the valuation.
The simulation indicates that at a discount rate of 8.2%, the intrinsic value for Microsoft’s equity per share is between $276 and $472 with an expected value of $361.
Based on my scenario, Microsoft is currently priced within its fair value range.
Final Recommendation
The report has highlighted that Microsoft Corporation appears prepared to make the appropriate financial investments to ensure that it becomes one of the leading companies in the Generative AI market.
The company’s leadership apparently is committed to not missing out on the technology transition that AI may bring to all aspects of the commercial and social environment. This commitment is demonstrated by the quantum of capital being reinvested back into the business.
My call is that Microsoft is currently a HOLD.
What are the investment risks going forward?
The valuation has highlighted that the major influence on the company’s intrinsic value is the projected revenue growth rate.
A large component of future growth is the successful uptake of the generative AI developments. If the AI market failed to achieve its expected market size or Microsoft failed to maintain its Cloud market share, then the stock price could take a sizable hit.
The other risk which should not be ignored is the impact that a potential global recession may have on the near term for Microsoft’s existing business. Microsoft’s almost annuity-like subscription business would be significantly impacted if global corporate employment levels were significantly lowered.
What should existing shareholders be doing?
Microsoft’s shareholders have been extremely well rewarded, as shown in the following table:
Author’s compilation using data from Yahoo Finance.
There is a possibility that long-term holders of the stock may be very overweight Microsoft within their portfolio because of how well the stock has performed.
The current price action for the company remains reasonably bullish. At some point, it seems inevitable the current rising trend will break down. At that point, I recommend that holders:
- Ensure that their allocation is not overweight.
- Make the appropriate adjustments to bring the holding back to a maximum of the target allocation.
- Do not add to your holding at these prices.
- If the stock has a significant pull-back then I would be buying it aggressively.
Analyst’s Disclosure: I/we have no stock, option or similar derivative position in any of the companies mentioned, and no plans to initiate any such positions within the next 72 hours. I wrote this article myself, and it expresses my own opinions. I am not receiving compensation for it (other than from Seeking Alpha). I have no business relationship with any company whose stock is mentioned in this article.
Seeking Alpha’s Disclosure: Past performance is no guarantee of future results. No recommendation or advice is being given as to whether any investment is suitable for a particular investor. Any views or opinions expressed above may not reflect those of Seeking Alpha as a whole. Seeking Alpha is not a licensed securities dealer, broker or US investment adviser or investment bank. Our analysts are third party authors that include both professional investors and individual investors who may not be licensed or certified by any institute or regulatory body.
