Summary:
- Home Depot and Lowe’s look similar at first. The deeper we dig, the more hints we find that HD is of higher quality.
- HD outperformed LOW every single year except 2020 regarding same-store traffic growth.
- The balance sheets are better than many people think, although there are some concerns for LOW.
- Both companies generate high returns on capital but only HD grows the capital base (Capital Employed).
- My valuation analysis leaves me to assume that HD is a bit overvalued while LOW is undervalued at current prices.
Joe Raedle/Getty Images News
Introduction
Over the past two months, I wrote several articles covering what I would call “retail” or “brick and mortar” businesses, including Starbucks (SBUX), Dollarama Inc. (TSX:DOL:CA)(OTCPK:DLMAF), Costco Wholesale (COST) and Walmart (WMT).
As a (early disclosure) shareholder of Home Depot (NYSE:HD), I want to keep up my coverage of these retail-type businesses and share my opinion on HD and its major competitor Lowe’s Companies (NYSE:LOW) in this article.
I will skip a separate section for an overview of these two businesses and will give a quick overview here instead. HD and LOW are the two major home improvement retailers in the United States. As of right now, HD operates 2,333 stores in the U.S. while LOW operates 1,746 stores. HD also operates 182 stores in Canada and 137 stores in Mexico. LOW on the other hand ceased its operations in Mexico in 2019 and Canada in 2022 (more on that later) and solely operates in the U.S. at this point. In conclusion, HD and LOW are simple, predictable businesses that offer everything around “home improvement”, something that will probably be in demand forever.
As I already wrote past articles, the key metrics we need to look out for when looking at a retailer are (1) Footprint growth (=store growth), (2) Traffic growth and (3) Pricing growth. The combination of (2) and (3) is usually referred to as “Comparable store sales growth” or “same-store-sales growth” which is one of the key reporting metrics for these types of businesses.
I will start this article by going over the aforementioned key metrics (and the conclusion we can derive from these) before going over the financials for both companies, including a discussion of the balance sheet, reporting/accounting, the main earnings metrics and some other things. I will then finish as I always do, with a section for valuation, risks and a conclusion.
Footprint Growth
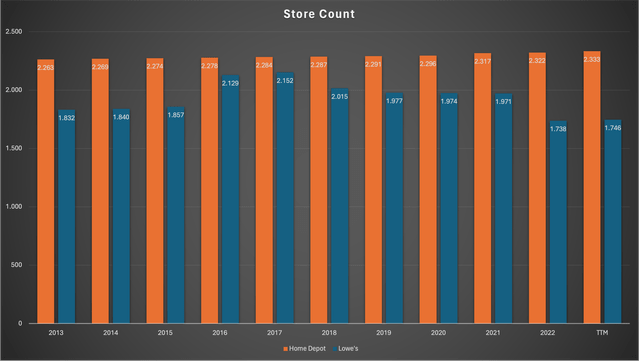
Let’s start with footprint growth, described as the growth in the number of operated stores. Here is a chart showing the total store count for both companies since 2013:
Store Count (Company reports – Compiled by Author)
Here we can see that HD store count has been nearly flat since 2013. Total store growth since 2013 was only 3.1%. Here are some additional numbers for HD:
| Region | Stores 2013 | Stores now | Change |
| United States | 2,263 | 2,333 | 1.9% |
| Canada | 180 | 182 | 1.1% |
| Mexico | 106 | 137 | 29.2% |
So the little store count growth that took place was nearly solely attributable to Mexico.
LOW total store count has also been nearly flat since 2013. The total store count for LOW declined by 4.7% since 2013, after rising a bit in 2016/2017 due to the expansion into Canada. Here is the same table for LOW:
| Region | Stores 2013 | Stores now | Change |
| United States | 1,789 | 1,746 | -2.4% |
| Canada | 35 | 0 | n.a. |
| Mexico | 8 | 0 | n.a. |
After entering aggressively into Canada in 2016 (2015: 42 Canada stores, 2016: 299 Canada stores), LOW decided to end operations there in 2022. LOW already ceased operations in Mexico in 2019.
There are some straightforward conclusions to make here:
(1): While HD has been able to successfully operate in Canada and Mexico, LOW’s failed to expand into these two regions. This begs the question “Why?” and at the very least makes me question LOW management compared to HD.
(2): Since LOW now solely operates in the U.S. where store growth has been non-existent and HD store growth is non-existent as well (besides Mexico, a region that is too small for HD to be meaningful in any way) we should assume zero store growth for both companies in the future. This will come into play later when we value both companies.
Comparable Sales Growth
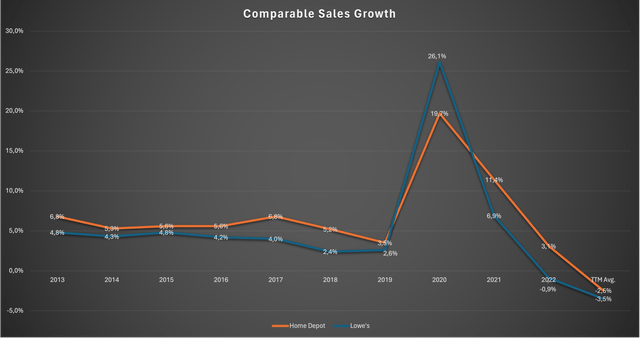
So the first part regarding footprint was not that exciting. I can assure you though that the following part is more interesting. I will start with a chart showing overall comparable sales growth for both companies:
Comparable Sales Growth (Company reports – Compiled by Author)
Here we can see that HD consistently outperformed LOW every single year except for the pandemic year 2020. The average outperformance was 130 basis points while the median outperformance was 140 basis points. If we were to exclude the extraordinary year 2020, these numbers would be 210 basis points (average) and 170 basis points (median) instead. So after the first hint we saw earlier (the fact that HD manages to operate successfully outside of the U.S. while LOW can’t), we now have a second hint that HD might be of higher quality compared to LOW.
What stands out though is the huge spike in 2020, with LOW comparable sales growth outpacing HD by 640 basis points. So let’s look into the two sub-metrics for comparable sales, starting with pricing (HD and LOW call it “comparable average ticket”):
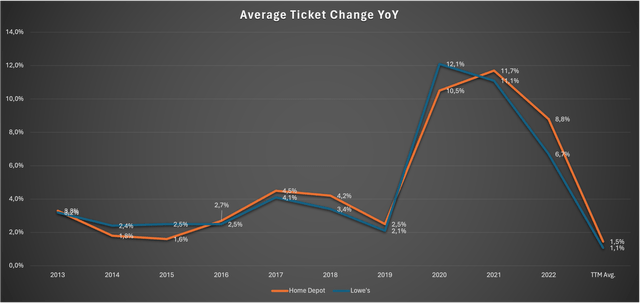
Comparable Average Ticket (Company reports – Compiled by Author)
Here we can see that pricing-wise, both companies pretty much acted equally. On average, HD increased prices 20 basis points more than LOW over the past decade, a negligible number. We can see that HD increased prices a bit less in 2020 which is one reason for LOW outperformance in 2020 comparable sales growth. HD caught up with price increases in 2021 and 2022 before both companies were again nearly equal for the average of the trailing twelve months (TTM).
So when both companies handled pricing nearly equally (as is to be expected for retailing competitors), HD’s outperformance has to come from the second part of comparable sales which is traffic. Here is the last chart showing traffic growth (the companies call this “comparable customer transactions”):
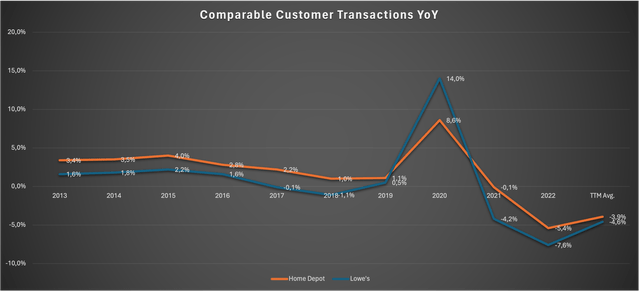
Comparable Customer Transactions (Company reports – Compiled by Author)
Here we can see that this was the case. HD’s outperformance regarding traffic growth came in at 120 basis points (average) or 180 basis points (median) since 2013. If we were to exclude the extraordinary year 2020, both numbers come in at 180 basis points.
So it seems like HD and LOW have the same pricing power. This was to be expected because the products these companies sell don’t have a built-in moat or anything similar to that. We can also compare both company’s increase in average tickets to the U.S. CPI (Consumer Price Index). I will use the mean of both company’s increase in average tickets to make this easier:
| Ticket % | 3.3 | 2.1 | 2.1 | 2.6 | 4.3 | 3.8 | 2.3 | 11.3 | 11.4 | 7.8 | 1.3 |
| CPI % | 1.5 | 1.6 | 0.1 | 1.3 | 2.1 | 2.4 | 1.8 | 1.2 | 4.7 | 8.0 | 3.5 |
| +/- | 1.8 | 0.5 | 2.0 | 1.3 | 2.2 | 1.4 | 0.5 | 10.1 | 6.7 | -0.3 | -2.2 |
It seems that over the long run, HD and LOW have been able to increase prices well above inflation. This seems odd because gross margins have been flat for both HD and LOW. This indicates that price increases were in line with input costs (materials, costs of sales). However, EBIT margins (= Operating margins) increased a lot over the past decade. In conclusion, it looks like HD and LOW increased margins by raising prices in line with input costs (materials, costs of sales) while only raising wages in line with or a bit above “normal inflation”, expressed as the CPI. The result of this is higher EBIT margins. I thought about this for some time and I think this is reasonable. It is not the job of these companies to raise wages in line with material costs. One could argue that to be fair, HD/LOW should account for the slower rise in wages by reducing the rate at which they increase prices. As a customer, I would agree to this. As an investor, not so much.
Another thing that led to increasing EBIT margins is the increase in traffic (or “comparable customer transactions”). As I already noted in past articles, if a company raises prices in line with costs while traffic at the same store increases, we will always see increasing margins for that store. Here is an example: If store A generates $100 in revenue and has a margin of 20%, profits amount to $20. Now if the store increases prices by 10%, in line with operating costs, the new revenue is $110 and the new costs are $22, again for a margin of 20%. This assumes an unchanged number of transactions. If transactions increase, the revenue will increase more than 10% while the costs will only increase at a rate of 10%, ultimately making this store more profitable. This is why traffic growth is such a crucial growth driver for retail businesses.
So now let’s turn to the “traffic” side. HD was able to outperform LOW regarding traffic growth in every year except 2020. To be honest, I have no idea why that could be the case (you might know this better than I do). I can just make some assumptions: As for the large outperformance by LOW in 2020, the only reason I can think of is that LOW might have handled pandemic restrictions far better than HD. If you have any first-hand insight regarding this, feel free to write a comment. As for the overall better traffic performance by HD, I can only guess that HD simply delivers a better customer experience. Feel free to share your thoughts on this in the comments as well.
For now, let me summarize what we have seen so far:
- HD successfully operates in Canada and Mexico while LOW tried to do so and had to cease operations in Mexico in 2019 and Canada in 2022.
- Except for 2020, HD outperformed LOW every year since 2013 regarding traffic growth. The average and median outperformance, excluding the extraordinary year 2020, was 180 basis points.
- Both companies seem to be able to increase prices in line with material costs while only increasing wages in line with or a bit above CPI, resulting in improving operating margins. This is a trend that might continue in the future.
Financials
I will try to make this a bit more structured by dividing this chapter into the following four sub-chapters:
- Balance sheet
- Accounting / Earnings Metrics
- Returns on Capital
- Cash returns to shareholders
Balance Sheet
I normally just use a screenshot of the latest available balance sheet. Since we are looking at two companies simultaneously here, I will use tables with the most important metrics and limit this to the last five years. I will focus on three things: (a) Goodwill, (b) Equity and (c) the debt situation.
Let’s start with Goodwill (numbers in $ million):
| FY | 2018 | 2019 | 2020 | 2021 | 2022 | TTM |
| HD Goodwill | 2,252 | 2,254 | 7,126 | 7,449 | 7,444 | 7,937 |
| LOW Goodwill | 303 | 303 | 311 | 311 | 311 | 311 |
The Goodwill on the balance sheet accounts for the difference between the purchase price and the book value of the acquired assets when performing M&A deals. In the optimal case, there is no Goodwill at all because the company can grow 100% organically without the need for acquisitions. For LOW, we can see that (1) Goodwill is negligible and (2) there haven’t been any additions in the recent past. HD on the other hand added around $5 billion of Goodwill in 2020. HD acquired HD Supply Holdings in 2020 for a total enterprise value of around $8 billion. HD Supply describes itself as:
a leading wholesale company serving customers and their communities across the Multifamily, Institutional, Hospitality, Trades, Government Housing, Healthcare, Building Services and Education industries through an expansive network of over 100 distribution centers across the U.S. & Canada.
With total assets of $75.5 billion on Home Depot’s balance sheet, the Goodwill position is not negligible (10% of total assets) but not concerning either. So there is nothing to worry about here for both companies.
Now let’s look at the shareholders’ equity:
| FY | 2018 | 2019 | 2020 | 2021 | 2022 | TTM |
| HD Equity | -1,878 | -3,116 | -3,299 | -1,696 | 1,562 | 1,430 |
| LOW Equity | 3,644 | 1,972 | 1,437 | -4,816 | -14,254 | -15,147 |
This looks very concerning at first glance. HD has nearly no equity right now and had negative equity in the past while LOW’s equity is deep in the red. It isn’t as bad as it looks though. Both companies own 89% of the operated stores so the land and the buildings are accounted for on the balance sheets. At the end of FY2022, accumulated depreciation amounted to $17,344 million for LOW and $26,444 million for HD. Now these depreciation expenses are not 100% related to the buildings (land is not depreciated because it is supposed to have an indefinite useful life) because there are also some depreciation expenses for furniture and equipment but even if we just assume that 50% of these depreciation expenses are attributable to buildings, the true equity should be a lot higher for both companies. This also assumes that the buildings today have the same value as they did when they were purchased (mostly more than a decade ago), something that will most likely not be true at all.
But how can the equity on the balance sheet become so negative when HD and LOW generate net income every year? I will come back to this in more detail later but the short answer is that LOW and HD returned more cash to shareholders through dividends and share repurchases than they generated in net income. This is especially the case at LOW as we will see later on. Dividends and share repurchases are accounted for as a reduction of equity.
Now the last part is the debt situation. In the case of these two companies, this is something that is often misunderstood by investors and fellow analysts alike. Let me show you what I mean. To start, here is a chart showing the net debt for both companies since 2013:
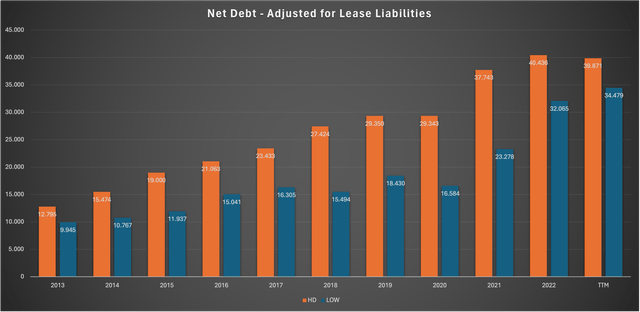
Adjusted Net Debt (Balance Sheets and SA Financials)
Please note that I excluded the lease liabilities for this calculation. So here we can see that in absolute numbers, the net debt position is very high for both companies. Couple that with what we saw earlier (negative/zero equity) and people tend to say that the balance sheets are very weak.
Now let me show you something else:
| Home Depot | Lowe’s | |
| Adjusted Net Debt FY22 | 40,436 | 32,065 |
| Interest Expense FY22 | 1,617 | 1,123 |
| Debt Cost FY22 as a % | 4.00% | 3.50% |
Now this isn’t 100% accurate but it does the job of showcasing that the balance sheets can’t be as bad as it seems. Why else would the market allow HD and LOW to borrow at such low-interest rates? As we will see later in the valuation section, equity costs for HD (expressed at the normalized free cash flow yield (FCF-Yield)) are a bit higher or at least equal to the costs for debt. Besides that, interest can be deducted from taxable income. So it makes sense for both companies to load up on debt and buy back shares.
All of this is of course only true when they can easily service this debt. For this purpose, let’s look at the most commonly used metric Net Debt/EBITDA:
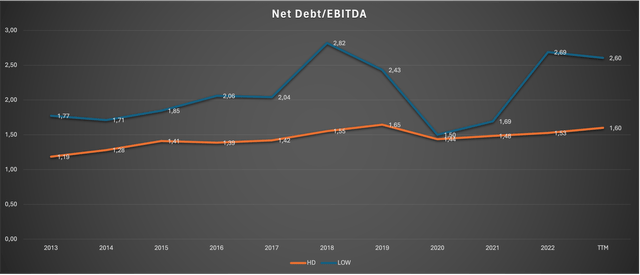
Net Debt/EBITDA (Company Reports and SA Financials)
Please note that I used GAAP EBITDA for LOW instead of adjusted numbers (more on that soon). Here we can see that HD is in good shape while LOW is a bit more concerning but still okay. I generally consider everything below 3 okay, below 2 good and below 1 very good.
Another quick summary of the key takeaways from this balance sheet analysis:
- HD has higher equity than LOW even when accounting for depreciation expenses on owned buildings.
- HD has a history of running a much more stable and lower debt position in relation the earnings power expressed as GAAP EBITDA.
Accounting / Earnings Metrics
As I usually do, I have to lose some words on accounting beforehand. For HD, there are no problems at all. HD only reports US-GAAP numbers with zero adjustments. As I have said in some of my prior articles, this is what we want to see because (a) the management team seems to see no need to make earnings look better than they are and (b) the best companies in the world usually don’t need to make any adjustments (just some examples from companies I covered earlier that make no adjustments: Costco Wholesale, Dollarama Inc. and Hermès).
For LOW, on the other hand, there have been many adjustments over the past decade. If companies use adjustments to GAAP numbers it is usually an effort to exclude one-time or extraordinary items. This can be gains/losses on investments (an adjustment that makes a lot of sense) or expenses for “business restructuring” (something that usually makes no sense). We always need to evaluate if a given adjustment makes sense or not. Here is an overview of all of the adjustments LOW made to the GAAP EBIT since 2013:
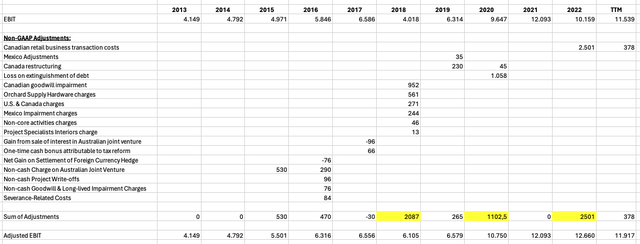
LOW Non-GAAP Adjustments since 2013 (Company reports – Compiled by Author)
We can see that there were a lot of adjustments over the past decade. The total sum of all adjustments since 2013 amounts to $7.3 billion which is nearly one year of earnings. We can see that the highest adjustments took place in 2018 (Canada & Mexico impairment), 2020 (Loss on extinguishment of debt) and 2022 (Canada exit). Remember what I wrote in the beginning. LOW tried to expand into Canada and Mexico but wasn’t able to do so. So are the 2018 and 2022 charges one-time items? Yes. Is it still a cost to the shareholders? Yes.
My main point is that we should not compare LOW’s adjusted numbers to HD’s GAAP numbers because we would be comparing apples to oranges. So going forward, all earnings numbers will be US-GAAP numbers.
I want to look at gross and EBIT margins, revenue, EBIT and net income. Since FCF is volatile due to the nature of these two businesses (mainly working capital movements), I will exclude it for now. I will start with HD:
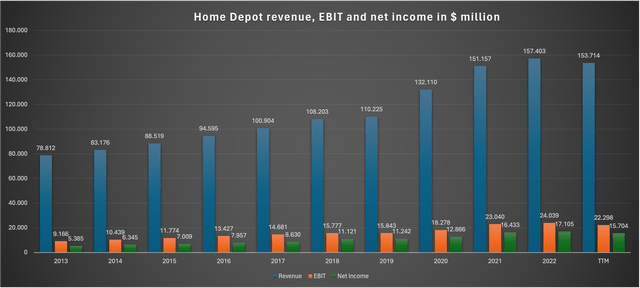
Home Depot Earnings Metrics (Company reports – Compiled by Author)
Here we can see that HD has generated significant growth over the past decade. FY23 will be the first year in a long time where HD’s revenue, EBIT and net income will decline. A long-term upward trend is what we want to see.
Now here is the same chart for LOW:
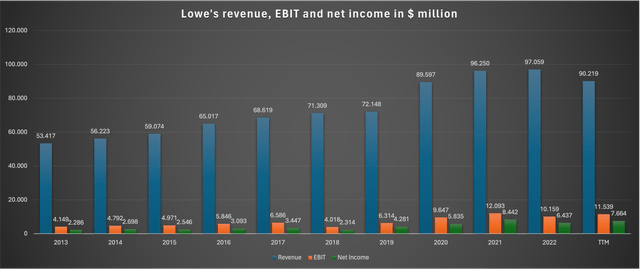
Lowe’s Earnings Metrics (Company reports – Compiled by Author)
LOW has the same upward trend but the journey has been more volatile. There are years like 2018 and 2022 where earnings took a hit due to the items that LOW “adjusted” from their earnings as one-time items. We can also see LOW’s revenue is currently unchanged from FY20 unlike HD because LOW’s took a hit due to the exit from Canada in 2022.
Overall, I get the feeling that we are seeing a pattern here. LOW and HD look very similar at first glance but the deeper we dig, there are several signs that HD is of much higher quality than LOW.
Now on to margins. I mentioned earlier that it looks like HD and LOW were raising prices in line with material costs while “only” raising wages in line with CPI. Increasing same-store traffic also attributed to margin increases.
Since revenues grew much slower than profits over the past decade (for both companies), this seems to be true. Here is a chart showing both companies gross margins:
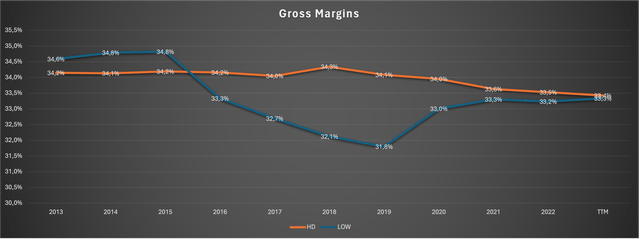
Gross Margins (Company reports – Compiled by Author)
And again, HD’s gross margins have been much more stable than those of LOW. However, both companies gross margins hovered around 33-34% over the past decade (with more volatility at LOW). This is a sign that they indeed raised prices in line with material costs or “cost of sales”.
Here are the EBIT margins:
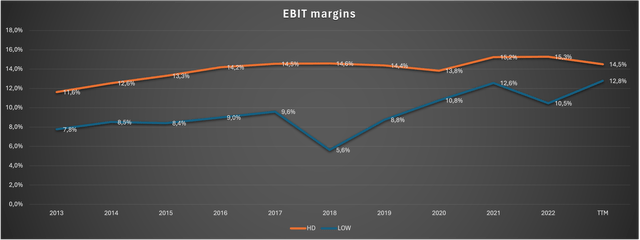
EBIT Margins (Company reports – Compiled by Author)
As we can see, EBIT margins expanded 290 basis points for HD and 500 basis points for LOW. Can this trend continue? As long as HD and LOW can keep raising prices in line with material costs and increase same-store traffic, sure. It also comes down to how much they will raise wages in the future. With their Q4 FY22 earnings release, HD announced that it planned to invest $1 billion in annualized compensation for frontline, hourly associates. I think the key going forward will be to find a balance between fair wage increases and possible profitability improvement. I ultimately think that further margin increases are still in the cards even if the rates of improvement may come down going forward.
Returns on Capital
If you have read some of my prior works you might recall that I highly value high returns on capital, in my case in the form of a high return on capital employed (ROCE). If the ROCE is consistently higher than the cost of capital, the company generates value for you while you hold it. If the ROCE is below the cost of capital, it destroys value while you hold it.
My formula for ROCE is Operating profit / Capital Employed where Capital Employed = Shareholders’ equity + long-term Liabilities – net cash if there is any. This formula has never let me down and usually yields reasonable results. We ultimately want (1) a very high ROCE coupled with (2) a steady rise in Capital Employed. If the Capital Employed is increasing, this shows that the company has good reinvestment opportunities. If it stagnates, it indicates that the company has very few reinvestment opportunities.
I want to start with a simple chart showing the ROCE for both companies:
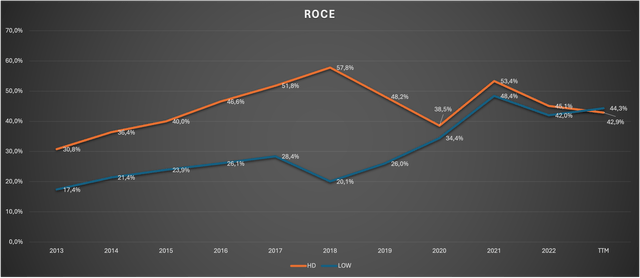
ROCE (Calculated by Author using company reports)
Here we can see that the returns on capital have increased for both companies and that LOW caught up to HD over the past decade. Additionally, both companies generated very high returns on capital in the past which is a very good sign. So both companies pass test (1) by having a very high ROCE.
Here is the chart showing the development of the Capital Employed as described above:
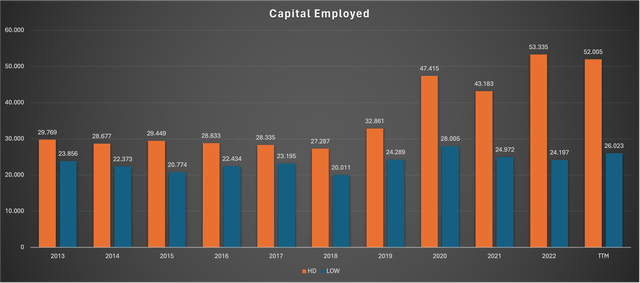
Capital Employed (Calculated by Author using company reports)
And again, as soon as we dig a bit deeper we find another hint that HD is of higher quality than LOW. While HD has been able to meaningfully increase capital employed, mainly due to the HD supply acquisition in 2020 and the little store growth that took place, LOW nearly wasn’t able to increase it at all. This is because LOW exited its operations in Mexico and Canada.
Now if we bring everything together, this makes sense. It all comes down to reinvestment opportunities. HD was able to add a few stores in Mexico and expand further into the PRO market with the HD supply acquisition while LOW tried to expand into Mexico and Canada but had to exit again because it simply didn’t work out as planned.
This begs the question: If LOW didn’t grow the capital base, where did the money go? And this leads me to the last chapter of this Financials section.
Cash Return to Shareholders
This is a very interesting topic in the case of these two companies. I will use what I will call the “Total Payout Ratio”. I define this as the percentage of FCF that is paid out to shareholders. My definition of total payout consists of Dividends + Share Repurchases – Share Issuance – Stock-Based Compensation Expenses.
Here are the numbers:
| Home Depot | Lowe’s | |
| Free Cash Flow FY16-FY22 | 79,757 | 39,532 |
| Total Payout FY16-FY22 | 89,543 | 55,870 |
| Total Payout Ratio | 112.3% | 141.3% |
HD paid out 112% of FCF to shareholders while LOW paid out 141%. So here we have the answer to my question above. Since LOW had fewer reinvestment opportunities, they just bought back stock. A lot of stock. From FY13-FY22, HD reduced its share count at a rate of 3.66% per year while LOW reduced it by 5.61% per year.
Can this go on going forward? To be honest, I think it can, albeit probably at a slower pace. HD and LOW are what some people refer to as cannibal stocks because they repurchase shares while using debt to accelerate this process, ultimately leading to what people perceive to be a “weak balance sheet”, a myth that I already debunked earlier.
What they are doing is very simple. If company A generates $100 million in FCF and has $300 million net debt, the net debt stands at 3x FCF. When the FCF grows to $110 million the following year and the company just pays out all the FCF to shareholders, it will still have $300 million in net debt but an FCF of $110 million. So the following year, net debt is only 2.73 times FCF. If the company now borrows an additional $30 million, the net debt will keep sitting at 3x FCF (the balance sheet doesn’t get weaker!) while the company can pay out 130% of FCF instead of “only” 100%. So it ultimately comes down to (a) the relation of net debt to earnings/FCF and (b) the organic FCF growth rate. This will be important later when we try to value both companies, so keep this in mind.
Near-Term Outlook
I usually don’t care about the near-term outlook because long-term results are what matters most but in the case of HD and LOW we should at least take a quick look at it. After all, FY23 was, as we have seen earlier, the first bad year for both companies in a very long time. I will just use estimates from Seeking Alpha and Tikr.com. Here is a small table showing EPS estimates until 2025:
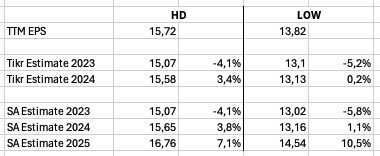
EPS Estimates until 2025 (Seeking Alpha / Tikr Estimates)
So Analyst estimates expect both companies to see some more decline in EPS for Q4 23. For FY24, LOW is expected to report flat YoY EPS while HD is expected to recover slightly. Thereafter, Seeking Alpha estimates expect EPS growth in the low double-digits for LOW and high single-digits for HD over the next few years.
The main conclusion here is that we should not bet on a short-term rebound following the mediocre FY23 numbers. The outlook given in the next earning calls will be something to look out for.
Valuation
I will start this section with a simple table showing the most important valuation factors:
| Home Depot | Lowe’s | |
| Price per share | $355.30 | $211.98 |
| Outstanding shares (diluted) in million | 999 | 577 |
| Market Cap in $billion | 354.9 | 122.3 |
| TTM Net Earnings in $million | 15,704 | 7,663 |
| P/E Ratio | 22.60 | 15.96 |
Here we can see that HD is trading at close to a 50% premium compared to LOW. Is this temporary? Let’s look at the historic valuation multiple:
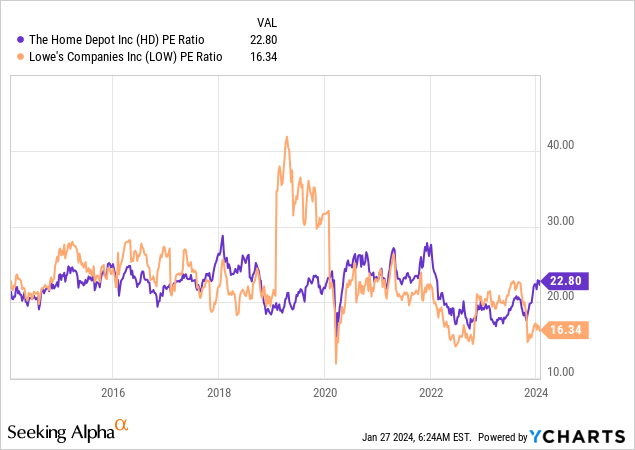
Here we can see that, excluding some extraordinary spikes for LOW, both companies were valued very close to each other in the past. While HD currently trades in line with past valuation levels, LOW looks cheap on a historical valuation basis.
So we need to ask ourselves why this might be the case and I see two possible reasons: (1) The market estimates LOW earnings to be flat YoY in 2024, justifying a discount, and (2) as I have shown earlier, LOW’s balance sheet weakened significantly over the past few years (negative equity even when accounting for depreciated buildings, 10-year high net-debt/EBITDA). While I still think that LOW’s balance sheet is not necessarily concerning, this might warrant a valuation discount.
To be honest, I am pretty surprised by this historic valuation chart. Normally, a company that shows several signs of higher quality, as HD does here (better balance sheet, more consistent margins/return on capital, steady outperformance regarding comparable sales growth), trades at a clear premium to peers in the same sector.
Now let’s try to value both companies. I always say I think that the long-term return potential for any stock should be the sum of (1) the FCF Yield and (2) the FCF growth rate.
Let’s start with (2), the FCF growth rate. As I discussed at the beginning of this article, we shouldn’t factor in any store growth. So growth should come from traffic and pricing.
As I have shown throughout this article, both companies were able to increase prices at the same rate, well above inflation expressed by the CPI. The inflation target in the U.S. is 2%. I will just assume 2% pricing growth for now, in line with the inflation target. This seems rather conservative.
The last growth driver will be traffic or “comparable customer transactions”. Pre-pandemic, traffic growth hovered between 1 to 4% for HD and -1 to 2% for LOW. The difference between these two ranges is 200 basis points, nearly in line with the average and median difference of 180 basis points for FY13-FY22 excluding the pandemic year 2020.
I repeated throughout this article that I think margin increases should still be in the cards for both companies, albeit at a slower pace than we have seen in the past. So I will just add 150 basis points for margin increases/operating leverage.
In conclusion, I will assume the following growth rates:
| Home Depot | LOWE | |
| Pricing | 2% | 2% |
| + Traffic | 2.5% | 0.5% |
| + Operating Leverage | 1.5% | 1.5% |
| = Total | 6% | 4% |
So this was the growth rate part. Now let’s take a look at the FCF Yield. First of all, due to movements in working capital, FCF is volatile for both companies. I will solve this problem by using the longer-term cash conversion rates. I divided the cumulative FCF generated since FY13 by the US-GAAP net income in the same timeframe. Here is my calculation (numbers in $million):
| Home Depot | Lowe’s | |
| Cumulative FCF since FY13 | 117,354 | 55,185 |
| Cumulative US-GAAP Net Income since FY13 | 119,797 | 49,043 |
| Cash-Conversion Rate | 98.0% | 112.5% |
We can now apply these rates to the current net income for the TTM to gauge what I call the “normalized FCF” (numbers in $million):
| Home Depot | Lowe’s | |
| TTM US-GAAP Net Income | 15,704 | 7,664 |
| x Cash-Conversion Rate | 98.0% | 112.5% |
| = Normalized FCF | 15,384 | 8,624 |
With these numbers, the normalized FCF Yield is currently 4.33% for HD and 6.27% for LOW. The difference between the two is nearly exactly 200 basis points. Isn’t that interesting? That’s nearly exactly the 200 basis point traffic underperformance by LOW compared to HD. This underperformance is now leading to a valuation discount in the same range.
If we were to use the numbers that we gathered so far, long-term return potential should look like this:
- HD: 4.33% FCF Yield + 6% FCF growth = 10.33%
- LOW: 6.27% FCF Yield + 4% growth = 10.27%
So both companies’ long-term potential looks similar.
The last piece missing is what I mentioned earlier to be important for valuing these companies: The fact that both companies pay out more than 100% of FCF by taking on new debt while keeping the debt ratio unchanged.
In an earlier chart, I showed you the Net debt/EBITDA for both companies. Net debt/EBITDA hovered around 1.5x for HD and 2x for LOW. So I will do the math example I used earlier to calculate how much FCF these companies might actually pay out to us:
| Home Depot | Lowe’s | |
| TTM EBITDA | 24,910 | 13,236 |
| x Assumed growth | 6% | 4% |
| = Added EBITDA | 1,495 | 529 |
| x Leverage | 1.5x | 2x |
| = Added debt (unchanged Leverage) | 2,242 | 1,059 |
| as a % of normalized FCF | 15% | 23% |
So HD should be able to pay out 115% of FCF without increasing leverage while LOW should be able to pay out 123%. This boosts the return potential a bit (maybe 60 basis points) for HD and a lot (maybe 130 basis points) for LOW.
Summing everything up, both companies should be able to deliver total returns in the low double-digits as long as they can grow traffic at a reasonable rate.
DCF Valuation
All of the above assumes no changes in valuation. To gauge possible headwinds/tailwinds from valuation changes we need to perform a supplemental DCF valuation. Note that valuation levels become less relevant the longer we intend to hold a stock.
Here are the input metrics I will use:
| Home Depot | Lowe’s | |
| Normalized FCF per share | $15.40 | $14.94 |
| + Added Payout through new debt | $2.31 | $3.44 |
| = Actual Payout to Shareholders | $17.71 | $18.38 |
| 10Y growth rate | 6% | 4% |
| Perpetual growth rate | 3% | 2% |
| Discount rate | 10% | 10% |
Here are the results:
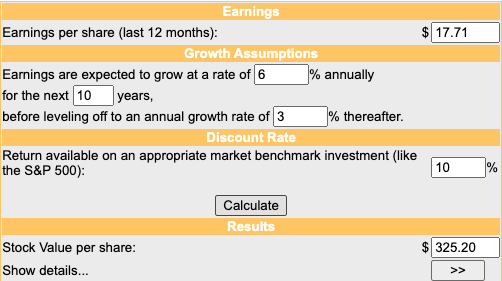
Home Depot DCF Valuation (moneychimp.com)

Lowe’s DCF Valuation (moneychimp.com)
So at current prices, HD looks a bit overvalued while LOW looks significantly undervalued. This also fits the picture of the historic valuation ranges we saw at the beginning of this chapter. From a historical multiple and a DCF approach, LOW looks cheap at current prices. This might also have specific reasons which I will discuss in the next section.
Risks
There are some risks for both companies and some more for LOW.
(1) Debt
Current debt levels, especially Net debt/EBITDA, don’t concern me for HD but they do a bit for LOW. If we were to exclude depreciation expenses for buildings and value the buildings at market value, shareholders’ equity for both companies would be way higher than it currently is. However, the extent of the negative shareholder equity we are seeing at LOW seems excessive. This can also be seen in the way higher Net debt/EBITDA levels of 2.6x compared to HD’s 1.6x. In my valuation analysis, I assumed that LOW would keep paying out more FCF than it generates by issuing new debt and keeping debt levels stable. If LOW decides to lower the leverage ratio instead (maybe get Net Debt/EBITDA down to the 1.5x level), this should be a headwind to total returns. This doesn’t seem unlikely.
(2) Possible margin headwinds
As I have shown in this article, both companies were able to increase prices in line with the costs of sales, ultimately leading to an unchanged gross margin. At the same time, EBIT margins expanded due to operating leverage and the fact that wages were only increased in line with the CPI. There is a possibility that customers won’t take these price increases in the future, ultimately leading to decreasing traffic numbers.
HD and LOW would only have two options in this scenario: (1) Lower price increases or (2) keep the historic price increases and accept lower traffic numbers. Both would be a significant headwind to the top line.
(3) The effect of declining Traffic
Decreasing or slowing traffic (or comparable customer transactions) is the major risk for both companies for two reasons: (1) It is one of the two growth drivers (besides pricing) and (2) it is the main driver for margin improvement. As I mentioned earlier, improving margins is tied to increasing same-store traffic. If traffic remains flat or declines, this would have a significant negative impact on the top and bottom lines. I see this as a much higher risk for LOW because they have shown weaker traffic numbers in the past. I calculated the same operating leverage improvements for both companies. This might prove way too optimistic for LOW because they have a history of underperforming regarding traffic growth, the main driver for profitability improvement.
Conclusion
This was probably the longest article I have written so far but there was quite some ground to cover. Let me try to summarize everything:
- HD and LOW look similar at first. The deeper we dig into the businesses, the more hints indicating that HD is of higher quality than LOW we find.
- HD outperformed LOW every year except 2020 regarding traffic growth, the most important growth driver for these two businesses.
- Both balance sheets are okay but HD’s balance sheet looks stronger than LOW’s. The Net debt/EBITDA has also been much more stable for HD.
- Both companies generate high returns on capital but only HD manages to grow the employed capital, indicating that LOW doesn’t have that many reinvestment opportunities. Instead, LOW returns much more cash to shareholders than HD.
- HD trades at a premium to LOW, probably due to the aforementioned bullet points.
- My DCF calculation leaves me to assume that HD is slightly overvalued and LOW is undervalued.
Please keep in mind that a DCF calculation gets less important the longer we intend to hold a stock. I think that LOW has much more risk than HD (especially regarding traffic growth). This could be the reason for the valuation discount.
Summing it all up, I currently rate HD a hold and LOW a buy. I wouldn’t overweight LOW though because of the risks described throughout this article and because I think that HD is still fundamentally the superior business.
Analyst’s Disclosure: I/we have a beneficial long position in the shares of HD either through stock ownership, options, or other derivatives. I wrote this article myself, and it expresses my own opinions. I am not receiving compensation for it (other than from Seeking Alpha). I have no business relationship with any company whose stock is mentioned in this article.
Disclaimer: Any material in this article should not be relied on as a formal investment recommendation. Never buy a stock without doing your own thorough research.
Seeking Alpha’s Disclosure: Past performance is no guarantee of future results. No recommendation or advice is being given as to whether any investment is suitable for a particular investor. Any views or opinions expressed above may not reflect those of Seeking Alpha as a whole. Seeking Alpha is not a licensed securities dealer, broker or US investment adviser or investment bank. Our analysts are third party authors that include both professional investors and individual investors who may not be licensed or certified by any institute or regulatory body.
