Summary:
- About seven months ago we said Toyota looked like a more attractive investment than Tesla based on SA quant ratings driven by valuation and momentum factor grades.
- Toyota’s stock price has beaten Tesla’s by around 57% since the article’s publication on 6/23/23.
- In the wake of the EV giant missing earnings for the second quarter straight, and slides in Quant Factor Grades, our rating remains at Hold on Tesla.
- This article will look at how Tesla’s recent earnings miss impacts its SA quant rating and where the EV carmaker now stands versus Toyota.
Birdlkportfolio
In the SA Quant Team’s initial coverage comparing Toyota Motor Corporation (TM) to Tesla, Inc. (NASDAQ:TSLA), the Japanese carmaker’s stock was more attractive due to A+ Grades in key Quant Factors including Valuation, Profitability, & EPS Revisions. Over the seven months since our recommendation, Toyota has outperformed Tesla by around 57%.
TSLA vs. TM Stock Performance 6/23/23-1/30/24
TSLA vs. TM Stock Performance (SA Premium)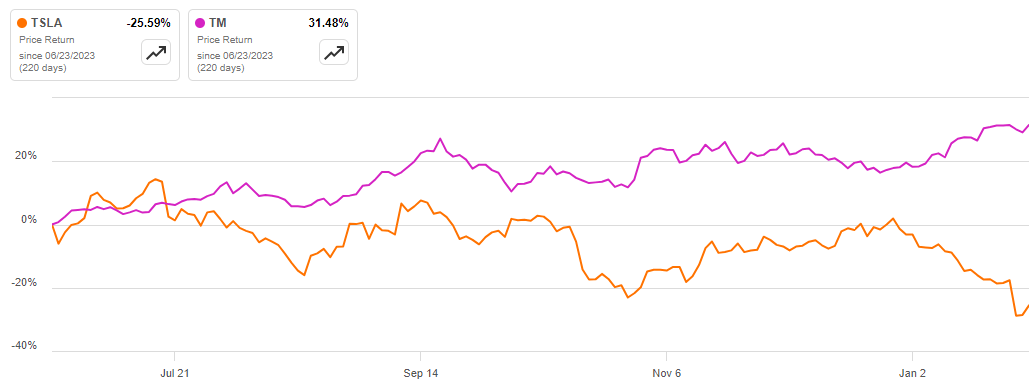
Tesla’s stock plunged after missing Q423 earnings and projecting slower growth. The next sections dig further into how the quant scores moved in the wake of these developments and the downward slide in Factor Grades since last June.
Tesla, Inc. (NASDAQ:TSLA)
-
Market Capitalization: $608.07B.
-
Quant Rating: Hold.
-
Quant Sector Ranking (as of 1/30/24): 189 out of 526.
-
Quant Industry Ranking (as of 1/30/24): 15 out of 32.
Tesla designs, develops, manufactures, leases, and sells electric vehicles (EVs), and energy generation and storage systems in the United States, China, and internationally. Tesla has over 127,000 employees and delivered over $95 billion in revenue in the past 12 months. Tesla is in the middle of the pack of 32 SA quant-rated Automobile Manufacturing Stocks with a Hold rating of 3.18, down 7% from where it was last June (3.42). Tesla currently also has Hold Ratings from both SA Analysts and Wall Street Analysts.
Tesla Stock Hold Ratings
TSLA Ratings Summary (SA Premium)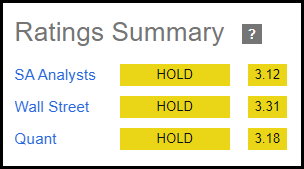
Tesla’s Quant score is based on grades in five categories. Tesla’s current Factor Grades include an F in Valuation, B- in Growth, A+ in Profitability, D in Momentum, and D+ in EPS Revisions. As the below visual indicates, two of Tesla’s Quant Factor Grades have slipped in the past six months: Growth fell from an A- to a ‘B-‘ and Momentum from an ‘A-‘ to a D.
TSLA Quant Factor Grades (SA Premium)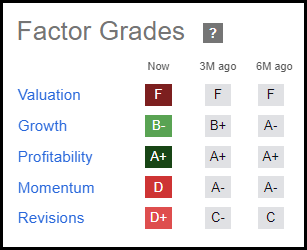
The most recent development impacting Tesla’s quant rating is the Q4 earnings results. Tesla’s SA quant factor grades edged lower after the announcement.
Tesla’s Q324 Results: Quant Impact
Tesla’s stock price plunged over 12% after the company missed earnings for the second consecutive quarter and signaled that the volume growth rate would be “notably” lower in 2024 as it focuses on launching the next-generation vehicle. Tesla stock is down over 20% YTD, underperforming Toyota and other large market cap automakers.
Tesla underperforms Toyota and its industry peers
TSLA Stock Performance Vs. Peers (SA Premium)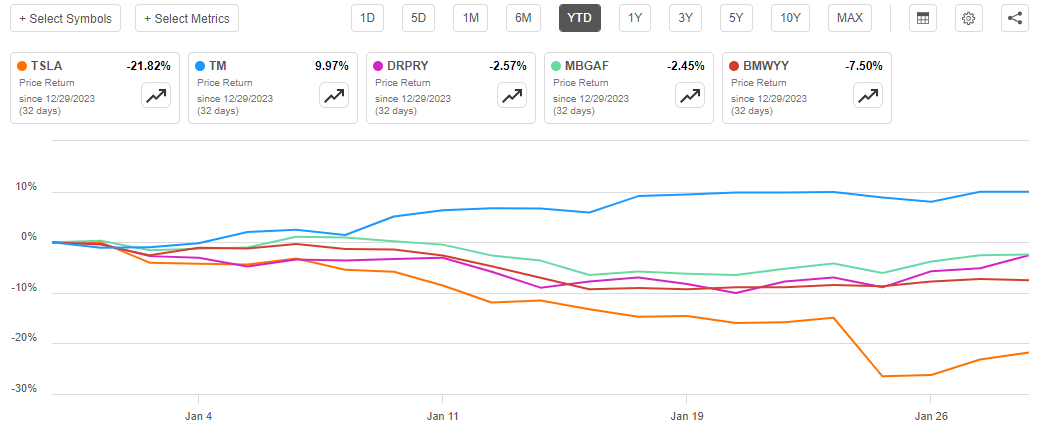
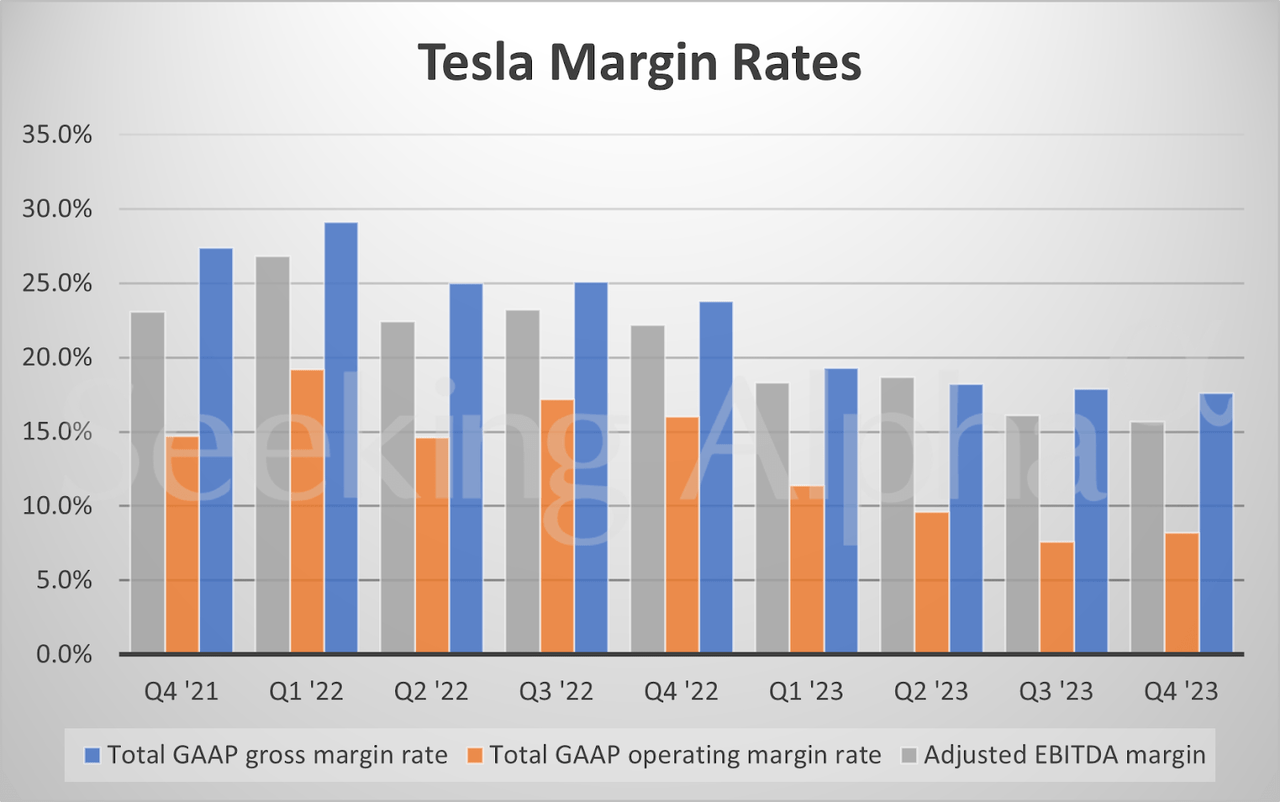
Tesla’s Q423 EPS of $0.71 missed by $0.03 while revenue of $25.17 billion (+3.5% YoY) missed the consensus target by $590 million. Operating income dropped 47% to $2.06 billion in Q4, and operating margin fell from 16% to 8.2%. Tesla said profits were impacted by pricing, mix, AI, and other R&D expenses, and costs associated with the Cybertruck production ramp. Operating profit was also impacted by lower Full Self-Driving (FSD) revenue recognition YoY due to the FSD Beta release in North America in Q422.
Tesla announced Q423 earnings post-market on 1/24 (Wednesday) and the stock plunged 12% the next day. As the snapshot below illustrates, Tesla’s Quant Rating fell 0.14 points between the day of the earnings announcement and the end of the week. The score change was largely driven by shifts in two Factor Grades: Momentum (from D+ to D-) and EPS Revisions (from C+ to C-).
TSLA Quant Ratings & Factor Grades (SA Premium)
Since the earnings announcement, Tesla saw an additional 12 EPS downward revisions and its revision grade fell to D+ by 1/30. In the past 90 days, Tesla has 30 down revisions and its consensus EPS target has been lowered by 16%. Consensus estimates now have Tesla EPS at -20% in Q124, and -16% in Q224, before rebounding in the last two quarters of the year.
TSLA EPS Surprises/Estimates (SA Premium)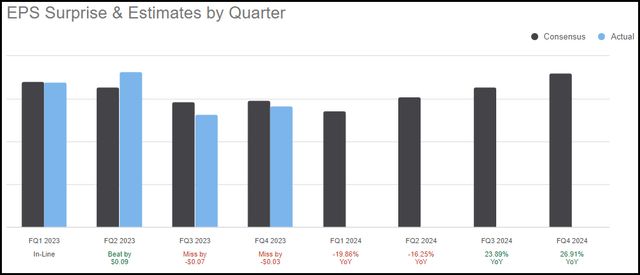
22 of 43 Wall Street analysts have Tesla at a hold rating in the last 90 days, followed by 15 Buys/Strong Buys and 7 Sells/Strong Sells.
Stock Valuation & Momentum: Tesla vs. Toyota
Toyota’s quant score (4.98) has not changed since last June (4.98). Toyota has A’s in Growth, Profitability, and EPS Revisions, and B’s in Valuation and Momentum. Toyota has a higher grade in four categories and ties with Tesla in Profitability.
TSLA vs. TM Factor Grades (SA Premium)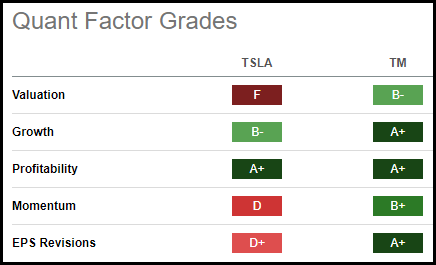
The head-to-head comparison between Tesla and Toyota differentiates the two stocks, beginning with Valuation. Tesla is among two of the 32 quant-rated carmaker stocks with an ‘F’ Valuation Factor Grade. A review of Tesla’s underlying Valuation Grades showcases Ds and Fs for nearly every key metric. Tesla has a P/E Non-GAAP (FWD) of 59.38x, over 270%% above the Consumer Discretionary sector median of 15.85x. PEG (FWD) is over 125%% above the sector median, EV/EBITDA (FWD) over 230%, and EV/EBIT (FWD) over 290%.
TSLA Valuation Grade (SA Premium)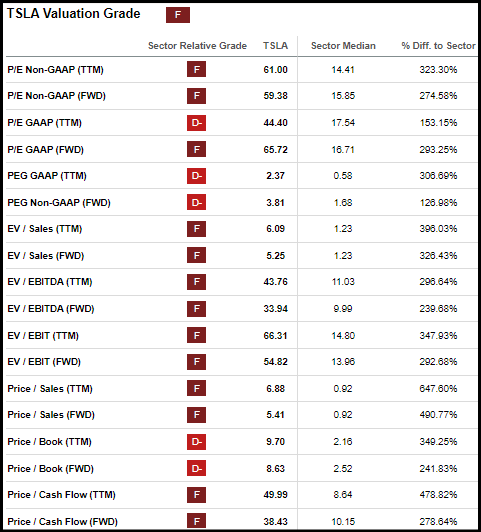
Tesla’s valuation metrics, across the board, are also significantly higher than Toyota’s with a major gap in PEG (TTM). Tesla is at 2.37x and Toyota is at 0.19x. Toyota’s EV/EBITDA (FWD) valuation metric (33.94) looks strong vs. TSLA (10.08). Tesla is trading at nearly 50x cash flow vs. Toyota at almost 14x.
TSLA vs. TM Valuation Metrics (SA Premium)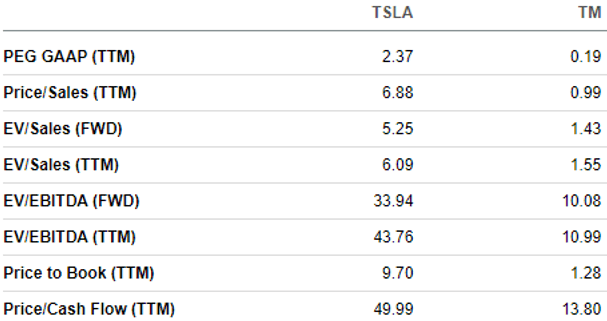
In addition to Toyota’s more attractive Quant Valuation Grades, Tesla’s momentum has declined, whereas Toyota’s price performance is positive. Tesla’s Momentum grade fell from a B- to a D over the past seven months. After Tesla’s post-Q4 results plunge, Toyota’s 1Y stock performance is now higher (37% vs. 8%).
TSLA vs. TM Price Performance (SA Premium)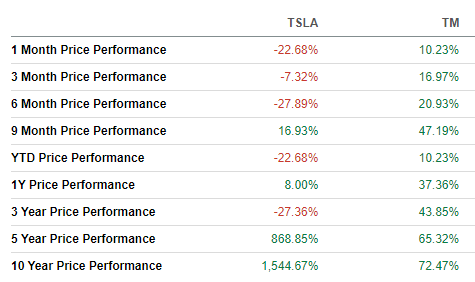
Growth & Profitability: TSLA vs. TM Stocks
Toyota is looking even stronger versus Tesla in key quant forward growth metrics compared to seven months ago. Tesla EPS Growth Diluted (FWD) of 30% is now at 4%, while Toyota’s went from 78% to almost 90%. Tesla’s EPS growth forward metric was at 11% on 1/25, before falling 7% the following day, likely due to a change in earnings revisions. Tesla has a higher revenue growth (FWD) (almost 20% vs. 8%). Toyota has higher EPS growth YoY (57% vs. 18%), EBITDA growth YoY (45% to -22%), and Revenue Growth YoY (23% to 18%). Tesla’s long-term historical growth numbers are impressive with 3-year Revenue and EBITDA CAGRs at over 45%, EBIT at 65%, and Net Income at 175%.
TSLA vs. TM Growth Metrics (SA Premium)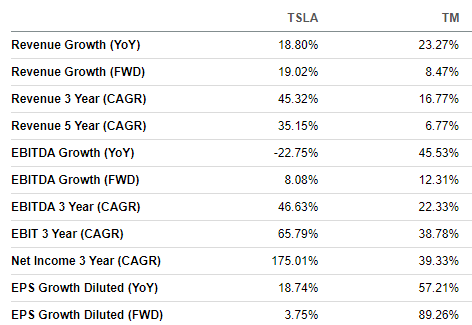
Although Tesla has struggled to meet earnings expectations in the past two quarters, it still has strong profitability quant metrics versus the sector, aside from levered FCF margin. Toyota however has posted stronger gross profit, EBIT, and EBITDA margins. Tesla has better ROE, ROA, and ROTC metrics.
TSLA vs. TM Profitability Metrics (SA Premium)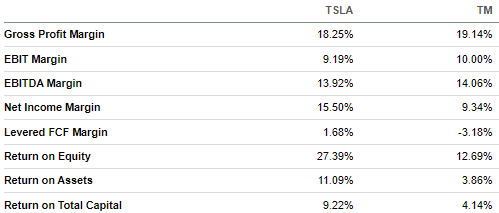
Tesla and Toyota are established players in the automotive world. Offering strong reputations and a wide range of vehicle models, both are investing and capitalizing on electrification. However, the distinction between the two companies is stark when reviewing their Quant Ratings. As highlighted above, Toyota SA’s Quant Strong Buy-rated stock has outperformed Hold-rated Tesla.
Concluding Summary: Toyota Still Trumps Tesla
About seven months ago, I said Toyota was a more attractive investment than Tesla based on Quant Ratings, driven by superior valuation and momentum Factor Grades. Since my recommendation, Toyota has pounded Tesla’s stock by almost 60%. Toyota has widened its lead after Tesla’s Growth and Momentum Factor Grades fell during the same period. In addition to Tesla maintaining an ‘F’ Valuation, its stock price dropped 12% on 1/25, the day after its Q4 earnings miss and projections of notably slower growth. From our Quant Rating recommendation on June 23, 2023, until now, Toyota still trumps Tesla, as highlighted by its continued Quant Strong Buy rating versus Tesla’s Hold rating.
Analyst’s Disclosure: I/we have no stock, option or similar derivative position in any of the companies mentioned, and no plans to initiate any such positions within the next 72 hours. I wrote this article myself, and it expresses my own opinions. I am not receiving compensation for it. I have no business relationship with any company whose stock is mentioned in this article.
Seeking Alpha’s Disclosure: Past performance is no guarantee of future results. No recommendation or advice is being given that any particular security, portfolio, transaction or investment strategy is suitable for any specific person. The author is not advising you personally concerning the nature, potential, value or suitability of any particular security or other matter. You alone are solely responsible for determining whether any investment, security or strategy, or any product or service, is appropriate or suitable for you based on your investment objectives and personal and financial situation. The author is an employee of Seeking Alpha. Any views or opinions expressed herein may not reflect those of Seeking Alpha as a whole. Seeking Alpha is not a licensed securities dealer, broker or US investment adviser or investment bank.
I am Steven Cress, Head of Quantitative Strategies at Seeking Alpha. I manage the quant ratings and factor grades on stocks and ETFs in Seeking Alpha Premium. I also lead Alpha Picks, which selects the two most attractive stocks to buy each month, and also determines when to sell them.

