Summary:
- Intel Corporation’s valuation is complex and nuanced, with various models indicating potential downsides.
- Factors such as the ambitious foundry expansion could drive the company’s growth, provided it succeeds.
- Challenges abound, especially in competitive sectors like client computing and data centers, where rivals such as AMD and Nvidia pose significant threats.
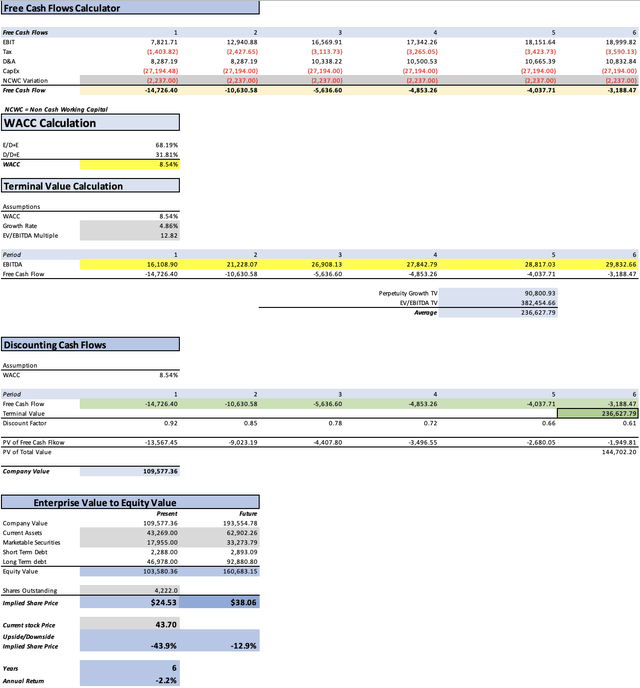
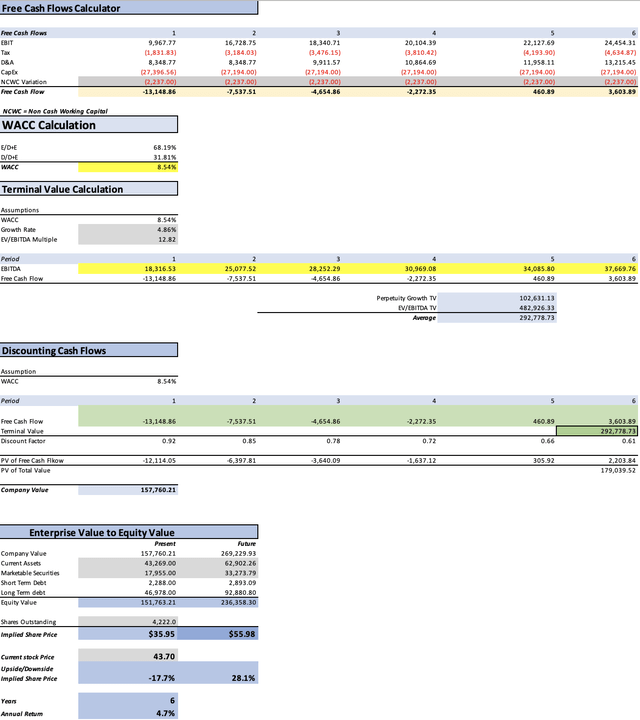
- The current assessment suggests a target price for Intel at $35.95, indicating a downside of 17.7%, while analysts estimate a fair price of $24.53, translating into a downside of 43.9%.
- Due to the lack of clarity in undervaluation results and significant differences in estimates, Intel is rated as a sell.
Justin Sullivan
Thesis
In my previous article, I analyzed Intel Corporation (NASDAQ:INTC) and determined a fair price of $43, indicating a potential 10.7% downside in the stock price. Following that analysis, the stock surged by 13.78% following the Q3 2023 earnings report.
However, with the release of the Q4 2023 earnings, the stock plummeted by approximately 11% due to a reduced forecast. In response, I reevaluated Intel to gauge the outcome my models would produce, resulting in a fair price of $35.95. Both assessments were conducted subsequent to the earlier models indicating a higher potential downside, rendering the previously mentioned fair prices disappointing. Consequently, I am reaffirming my sell rating on Intel.
Seeking Alpha
Overview
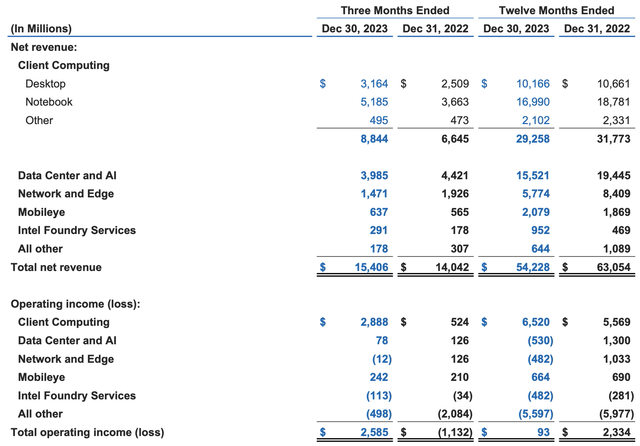
Intel derives its primary revenue from the sale of its chips, particularly the Intel CPU family. In this segment, Intel has experienced a 20% decline year over year. In contrast, within the network and edge realm, Intel has seen an even steeper decline of 31%.
The most rapidly expanding sectors for Intel continue to be the same as when I wrote my previous article. These sectors include Mobileye, with a focus on automotive software for self-driving applications, and Intel foundry services, which have registered a remarkable 109% growth YoY (updated to FY2023 results). Nevertheless, for Intel foundry enthusiasts, maintaining this annual growth would mean that for 2029 Intel foundry would be generating around $40.9 billion in revenue, this would put Intel on second place behind Taiwan Semiconductor Manufacturing Company Limited (TSM), and this is quite unthinkable because of the huge investment needed to increase the production to those levels. Furthermore, it takes time, as said by intel:
A fab – which includes 1,200 multimillion-dollar tools and 1,500 pieces of utility equipment – takes about three to four years, over $10 billion and 7,000 construction workers to complete.
Market
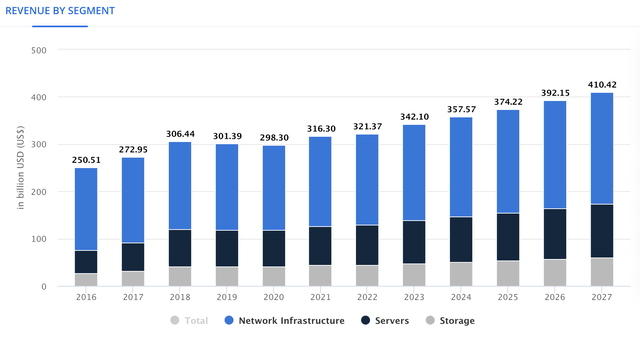
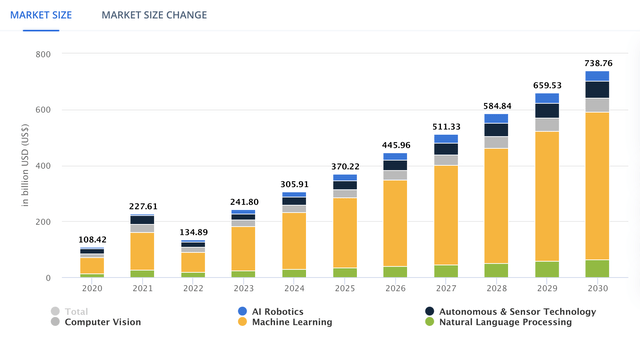
The Data Center Market is experiencing steady revenue growth, with a projected CAGR of 4.66% from 2023 to 2027. Within this market, the AI market is particularly lucrative, with an expected CAGR of 17.30% from 2023 to 2030.
Inside the Data Center Market, we can find networking which is expected to grow at a rate of 6.87% (see graph below). Networking entails linking multiple users to servers and is typically categorized into enterprise and embedded networks. Embedded networking specifically refers to the equipment necessary for building enterprise networks, facilitating employee access to company data or programs through a connected platform.
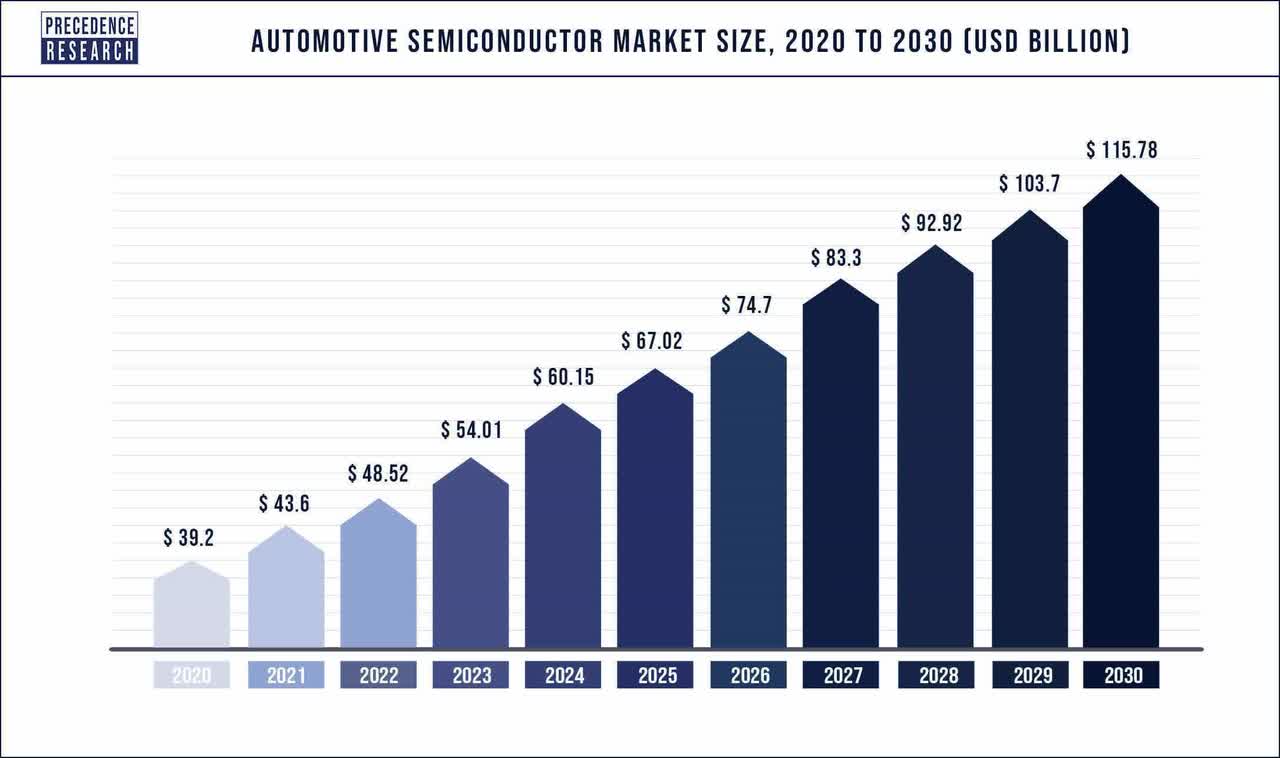
The Client & Embedded processors segment, which includes sales of CPUs and GPUs, is anticipated to grow at a rate of 2.9% through 2030. Mobileye, an Intel subsidiary specializing in autonomous driving technologies, is expected to contribute to the growth of the automotive semiconductor market, which is forecasted to grow at a CAGR of 11.5% from 2023 to 2030.
Author’s Calculations with base on Yahoo Precedence Research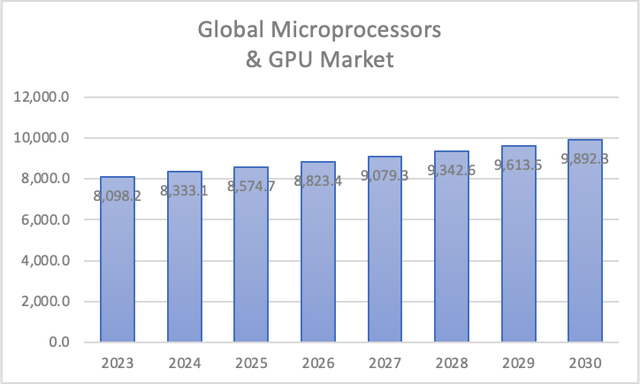
The semiconductor market, which is a direct indicator of the possible growth that foundries can display, is projected to grow at a CAGR of 12.28% from 2023 to 2032, with the market size reaching $1.88 trillion by 2032 if these projections materialize.
Author’s Calculations with base on Statista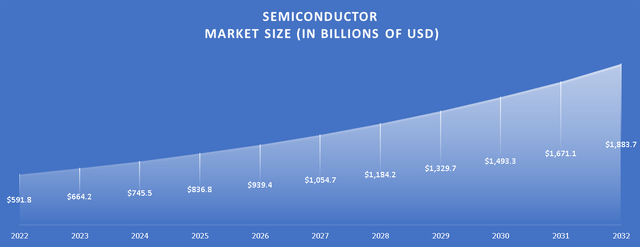
Financials
Intel’s revenue has been declining at a rate of -2.3% since 2017, with operating income also decreasing at a pace of -16.6%. Similarly, net income has followed suit, declining annually at a rate of -13.7%.
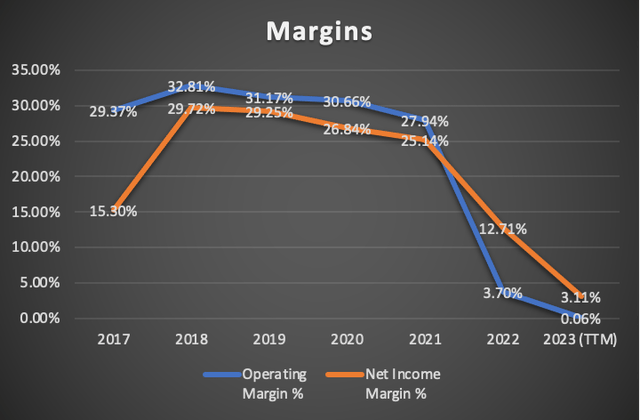
However, all income statement metrics have shown improvement compared to the previous quarter’s trailing twelve months figures. Revenue is up by 2.58%, surpassing the Q3 TTM figure of $52.86 billion. Operating income has significantly increased to $31 million, marking a 101% rise, while net income has surged by 202.73%.
Despite these improvements, both operating and net income margins remain low, standing at 0.06% and 3.11% respectively.
Author’s Calculations Author’s Calculations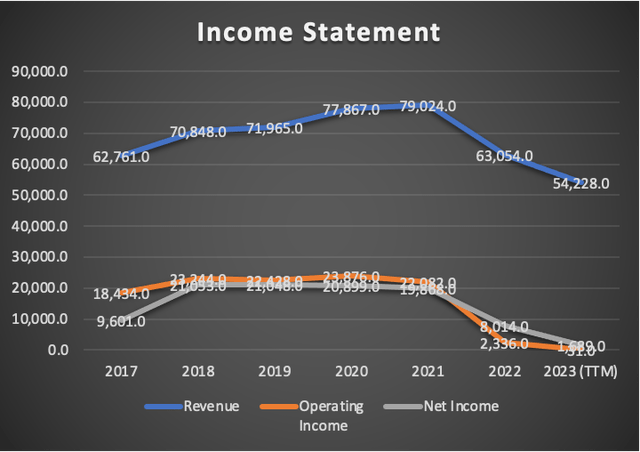
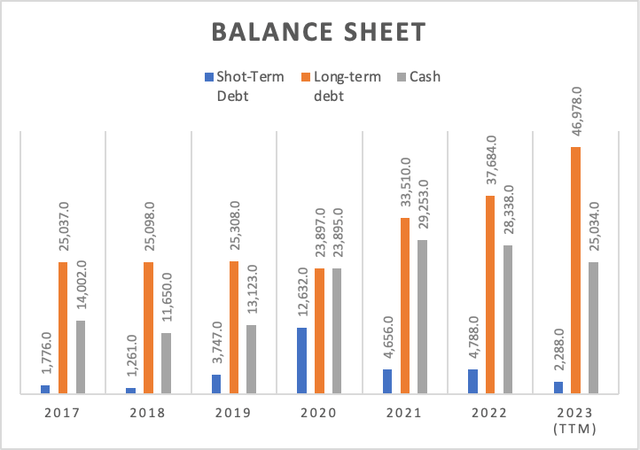
Intel’s long-term debt has increased annually at a rate of 14.6%, short-term debt at 4.8%, and total debt by 14%. This rise is attributed to Intel’s increased CapEx to expand its foundry business and regain its position as the largest foundry globally.
Debt levels have remained relatively stable compared to Q3 2023 TTM, with long-term debt at $46.59 billion and short-term debt at $2.29 billion. Cash reserves have also remained consistent at $25.03 billion.
However, free cash flow has seen a drastic decrease at an annual pace of -942.2%. While this may seem alarming, it is due to a significant drop from the 2017 FCF of $227 million. From its peak of $17.86 billion, FCF has been declining annually at a rate of 56.85% to its current metric of -$12.6 billion. This decline has been fueled by increasing CapEx (growing at 19.8% annually since 2017) and decreasing cash from operations (declining at -8% annually).
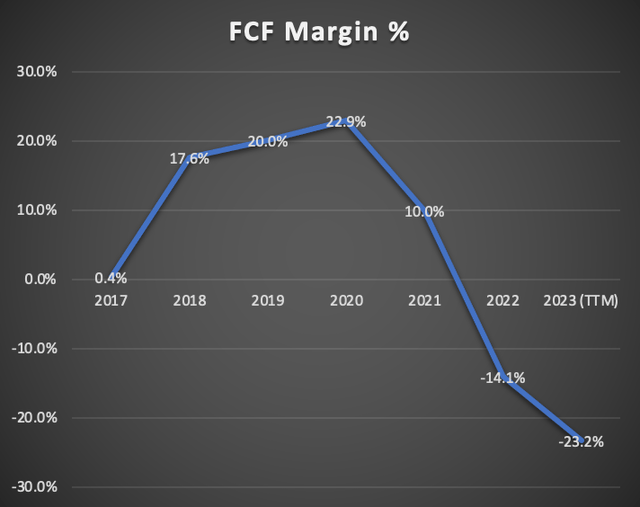
The current FCF margin stands at -23.2%, worse than the Q3 2023 TTM FCF margin of -16%.
Author’s Calculations Author’s Calculations Author’s Calculations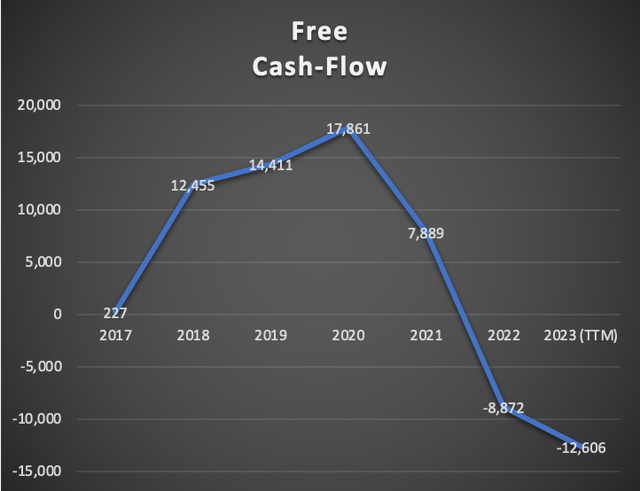
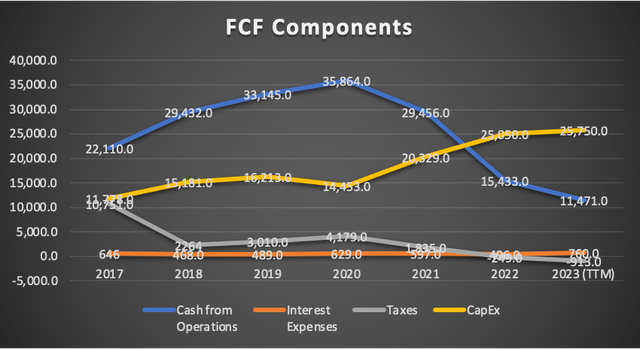
In summary, Intel exhibits weakness in its income statement and cash flows, although its balance sheet appears stable. However, further deterioration is expected as Intel seeks to expand its foundry production capacity.
Valuation
In this valuation section, I will employ two valuation models. The first model will rely on available analysts’ estimates on Seeking Alpha for revenue and EPS. The second model will involve projecting each of Intel’s segments to their respective expected market growth rates.
Outlined below is all the current data available for Intel. D&A and interest expenses will be calculated with margins tied to revenue. CapEx will remain constant at the FY2023 metric of $25.75 billion. Given my bearish stance on Intel, I will essentially be stress-testing Intel’s potential. The WACC will also be derived from this table using the standard formula.
| TABLE OF ASSUMPTIONS | |
| (Current data) | |
| Assumptions Part 1 | |
| Equity Value | 105,590.00 |
| Debt Value | 49,266.00 |
| Cost of Debt | 1.54% |
| Tax Rate | 25.00% |
| 10y Treasury | 4.13% |
| Beta | 1.21 |
| Market Return | 10.50% |
| Cost of Equity | 11.84% |
| Assumptions Part 2 | |
| CapEx | 25,750.00 |
| Capex Margin | 47.48% |
| Net Income | 1,689.00 |
| Interest | 760.00 |
| Tax | -913.00 |
| D&A | 7,847.00 |
| Ebitda | 9,383.00 |
| D&A Margin | 14.47% |
| Interest Expense Margin | 1.40% |
| Revenue | 54,228.0 |
Analysts’ Estimates
As mentioned earlier, in this initial model, I will utilize analysts’ estimates to assess where the market perceives this company’s trajectory.
To begin, we’ll examine the estimates for revenue and EPS, both readily available on Seeking Alpha. Starting with EPS, it’s evident that Intel is anticipated to demonstrate significant EPS growth. By 2028, the company is projected to achieve an EPS of 5.49, translating to a net income of $23.17 billion, a figure reminiscent of the net incomes Intel recorded from 2018 to 2020. However, it wouldn’t be prudent to rely on those past figures given their distance and the fact that only one analyst has covered that estimate.
Similarly, revenue is forecasted to reach $85.78 billion by 2028. Yet, the same issue arises: only one analyst is covering that estimate. Consequently, I will only consider projections up to 2026. Nevertheless, it’s apparent that Intel isn’t expected to achieve remarkable revenue growth rates, but rather more moderate ones, indicating that the company will likely pursue cost-cutting strategies.
| Revenue | Net Income | Plus Taxes | Plus D&A | Plus Interest | |
| 2024 | $57,270.0 | $5,615.26 | $7,019.08 | $15,306.26 | $16,108.90 |
| 2025 | $64,270.0 | $9,710.60 | $12,138.25 | $20,425.44 | $21,228.07 |
| 2026 | $71,444.0 | $12,454.90 | $15,568.63 | $25,906.85 | $26,908.13 |
| 2027 | $72,565.7 | $13,060.21 | $16,325.26 | $26,825.79 | $27,842.79 |
| 2028 | $73,705.0 | $13,694.93 | $17,118.67 | $27,784.06 | $28,817.03 |
| 2029 | $74,862.1 | $14,360.51 | $17,950.64 | $28,783.47 | $29,832.66 |
| ^Final EBITA^ |
| Net income Margin | |
| 2024 | 9.80% |
| 2025 | 15.11% |
| 2026 | 17.43% |
| 2027 | 18.00% |
| 2028 | 18.58% |
| 2029 | 19.18% |
These estimates present a less optimistic outlook for Intel since the fair price is set at $24.53, suggesting that the stock could decline by approximately 43.9%. Subsequently, the projected future price of the stock stands at $38.06, implying annual returns of -2.2% throughout 2029.
Now, let’s conduct an experiment. I will utilize the revenue and EPS estimates that I previously mentioned disregarding due to the limited analyst coverage. In this scenario, the result yields a fair price of $53.92 (a 23.4% upside) and a future price of $85.60 (16% annual returns). While the stock appears undervalued in this case, its undervaluation does not offers enough safety margin considering the possibility that the stock could go in the direction pointed by the previous model.
| Revenue | Net Income | Plus Taxes | Plus D&A | Plus Interest | |
| 2024 | $57,270.0 | $5,615.26 | $7,019.08 | $15,306.26 | $16,108.90 |
| 2025 | $64,270.0 | $9,710.60 | $12,138.25 | $20,425.44 | $21,228.07 |
| 2026 | $71,444.0 | $12,454.90 | $15,568.63 | $25,906.85 | $26,908.13 |
| 2027 | $79,390.0 | $18,745.68 | $23,432.10 | $34,920.14 | $36,032.78 |
| 2028 | $85,780.0 | $23,178.78 | $28,973.48 | $41,386.17 | $42,588.37 |
| 2029 | $87,126.7 | $24,305.27 | $30,381.59 | $42,989.16 | $44,210.23 |
| ^Final EBITA^ |
| Net income Margin | |
| 2024 | 9.80% |
| 2025 | 15.11% |
| 2026 | 17.43% |
| 2027 | 23.61% |
| 2028 | 27.02% |
| 2029 | 27.90% |
My Estimates
To execute this valuation model, I will first determine the weight that each segment contributes to Intel’s total revenue. As illustrated, the largest segment is client computing. Subsequently, I will project growth for each segment based on the respective market growth rates outlined in the overview section.
| Client Computing | Data Center and AI | Network and Edge | Mobileye | Intel Foundry | |
| 2023 | 29,256.0 | 15,520.1 | 5,769.9 | 2,076.9 | 639.9 |
| 2024 | 30,104.4 | 18,282.6 | 6,166.2 | 2,423.8 | 718.5 |
| 2025 | 30,977.5 | 21,536.9 | 6,589.9 | 2,828.6 | 806.7 |
| 2026 | 31,875.8 | 25,370.5 | 7,042.6 | 3,300.9 | 905.8 |
| 2027 | 32,800.2 | 29,886.5 | 7,526.4 | 3,852.2 | 1,017.0 |
| 2028 | 33,751.4 | 35,206.2 | 8,043.5 | 4,495.5 | 1,141.9 |
| 2029 | 34,730.2 | 41,473.0 | 8,596.1 | 5,246.2 | 1,282.1 |
| % of Revenue | 53.95% | 28.62% | 10.64% | 3.83% | 1.18% |
Next, the pivotal factor for a DCF model is net income. However, the current net income margin stands at a mere 3.11%, significantly low. Nonetheless, the average net income margin recorded from 2017 to 2023 is 20.30%. Therefore, my approach will be to raise the net income margin to 12.7% for 2024, then to 20.3% for 2025, maintaining stability thereafter. The highest income margin reported by Intel during 2017-2023 was 29.72% in 2018.
| Revenue | Net Income | Plus Taxes | Plus D&A | Plus Interest | |
| 2024 | $57,695.6 | $7,327.33 | $9,159.17 | $17,507.94 | $18,316.53 |
| 2025 | $62,739.5 | $12,736.12 | $15,920.15 | $24,268.92 | $25,077.52 |
| 2026 | $68,495.6 | $13,904.60 | $17,380.75 | $27,292.33 | $28,252.29 |
| 2027 | $75,082.2 | $15,241.69 | $19,052.12 | $29,916.81 | $30,969.08 |
| 2028 | $82,638.5 | $16,775.61 | $20,969.52 | $32,927.63 | $34,085.80 |
| 2029 | $91,327.6 | $18,539.49 | $23,174.37 | $36,389.81 | $37,669.76 |
| ^Final EBITA^ |
As evident, the outcomes appear more promising than in the previous model. This time, the fair price is estimated at $35.95, indicating that Intel has a downside of 17.7%. The projected future price is $55.98, suggesting that the stock could yield annual returns of 4.7% throughout 2029.
So what?
According to the models, Intel appears to have more potential for downside than upside, with the most optimistic scenario suggesting an upside of only 20%, which does not provide a sufficient safety margin. Furthermore, in Q4 2023, Intel announced that their forecast for 2024 was revised downward due to weakness in Mobileye, and client computing is expected to perform at the lower end of expectations as said by CNBC.
Intel CEO Patrick Gelsinger told analysts on the earnings call that first-quarter sales performance would take a hit because of weakness at Mobileye, where Intel owns a majority stake, as well as in the company’s programmable chip unit.
He also said the company’s core businesses of PC and server chips remained “healthy” and would report sales at the low end of the seasonal range.
It’s important to note that Mobileye specializes in software for autonomous driving and Advanced Driver Assistance Systems, which is closely linked to Electric Vehicles. Projections indicate softer demand for EVs in 2024. However, this trend could be reversed if the FED initiates rate cuts in 2024, prompting other central banks to follow suit and lower their interest rates starting in 2025.
Considering these factors, I maintain my sell rating on Intel. However, as indicated in the description below my name, I do not advocate for shorting stocks. Shorting is generally not recommended, especially in the case of Intel, which is an established company in the semiconductor market.
Why Intel will not recover its throne in chip manufacturing?
Being an integrated device manufacturer has its pros. For example, Intel can control the production costs of its chips, and it could produce cheaper chips because it wouldn’t need to pay for another company’s profit.
Nevertheless, one of the big reasons why Morris Chang decided to create TSMC was because of the interest conflict that could occur when a designer manufactured their chips with an IDM. IDMs design their own chips and manufacture them; therefore, there is the risk that the IDM could steal designs from its clients. In my previous article, many people mentioned to me, “Why would Intel risk their reputation doing something like that?” I am not saying that Intel will steal information, but that there is that risk, and risk is risk.
As you can see in the graph below, not even Samsung Electronics Co., Ltd. (OTCPK:SSNLF) is close to TSMC in what matters: revenue, which is an indicator of market share. And let’s remember that semiconductor manufacturing involves fixed costs, and if plants are operating at a low capacity, that is lost money. Therefore, the bigger TSMC becomes, the cheaper it can charge its customers, which will reaffirm its dominance. How could TSMC be dethroned? The slow way is that it becomes obsolete; the fast way is merging all the other competitors into a sole company, and that’s not happening.
Semiconductor foundries market revenue worldwide from 2019 to 2023, by quarter (Statista)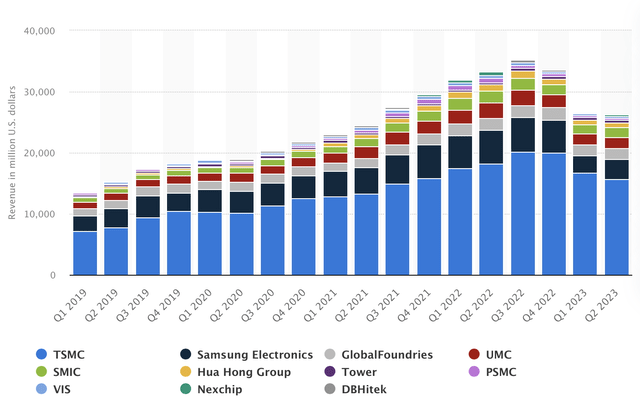
Risks to Thesis
I believe there is a higher risk factor influencing the valuation in favor of a more bearish stance. While I’ve maintained CapEx constant at $27.65 billion to be generous with Intel, if Intel begins to escalate its CapEx beyond that level, it could result in a lower fair price.
One potential factor that could alter my thesis and potentially support a bullish stance is Intel’s foundry expansion. Even though In my opinion that’s too difficult, Intel could find a way to build factories faster and cheaper and therefore climb to the second place in chip manufacturing. This could significantly boost the stock. However, it’s worth noting that I also tested the first model by incorporating optimistic revenue and EPS estimates for 2027 and 2028:
But now, let’s make an experiment. I will be using the revenue and EPS estimates that I told I was not using because there was only one analysts covering them. In that case the result yielded is a fair price of $53.92 (a 23.4% upside) and a future price of $85.60 (16% annual returns).
Nonetheless, Intel finds itself in a precarious position. Its client computing segment, which comprises the CPUs Intel sells, faces direct competition from Advanced Micro Devices, Inc. (AMD). Additionally, Intel is striving to grow its small foundry business to compete with TSMC and Samsung . Moreover, Intel must contend in the data center space with competitors like Nvidia Corporation (NVDA) and AMD. Intel seems surrounded by adversaries, and this could spell trouble, potentially resulting in Intel accumulating significant debts without the foundry business thriving.
Conclusion
In conclusion, the landscape for Intel Corporation appears complex and multifaceted. While various valuation models hint at potential downsides, there are also factors that could propel the company forward, such as its ambitious foundry expansion (if it works). However, challenges loom large, particularly in the fiercely competitive realms of client computing and data centers, where Intel faces formidable rivals like AMD and Nvidia. Despite the uncertainties, With the current assessment, the target price for Intel stands at $35.95, suggesting a downside of 17.7%, and analysts’ are estimating a fair price of $24.53 translating into a downside of 43.9%. Since all the models aren’t yielding a clear result of undervaluation, and since the differences between each result are too large, I am rating Intel as a sell.
Analyst’s Disclosure: I/we have no stock, option or similar derivative position in any of the companies mentioned, but may initiate a beneficial Long position through a purchase of the stock, or the purchase of call options or similar derivatives in INTC over the next 72 hours. I wrote this article myself, and it expresses my own opinions. I am not receiving compensation for it (other than from Seeking Alpha). I have no business relationship with any company whose stock is mentioned in this article.
Seeking Alpha’s Disclosure: Past performance is no guarantee of future results. No recommendation or advice is being given as to whether any investment is suitable for a particular investor. Any views or opinions expressed above may not reflect those of Seeking Alpha as a whole. Seeking Alpha is not a licensed securities dealer, broker or US investment adviser or investment bank. Our analysts are third party authors that include both professional investors and individual investors who may not be licensed or certified by any institute or regulatory body.

