
Summary:
- Two valuation models provide insights into Apple’s trajectory: one suggests a fair price of $276.29, with a 48.6% upside, while the other proposes $307.73, indicating a 61.8% upside.
- Projected future prices are promising: $401.14 with a 19.5% annual return in the first model, and $439.27 by 2029, yielding a 22.7% annual return in the second.
- Despite potential risks like sales declines and market pessimism, Apple’s commitment to innovation and resilience bolsters its outlook for sustained growth and market leadership.
- The rating on Apple is upgraded from buy to strong buy, reflecting confidence in its future prospects.
- Apple’s ability to navigate challenges while maintaining its leadership in the technology sector reaffirms its position as a favorable long-term investment choice.
Justin Sullivan
Thesis
In my previous article about Apple, Inc. (NASDAQ:AAPL), I assessed Apple and elucidated why we should disregard the move by Chinese authorities to ban Apple devices for employees of state-owned enterprises. At that time, the fair value stood at $224 with a projected future price of $308.9.
In this article, I will reassess Apple using the updated financial information available from Q1 2024. As you will observe, Apple is significantly undervalued, with even the most conservative model indicating a fair price of $276.29 and a future price of $403.14.
Moreover, considering my previous explanation regarding China’s not as unfavorable as believed, coupled with the increased fair price of Apple, I am upgrading the rating to a strong buy.
Seeking Alpha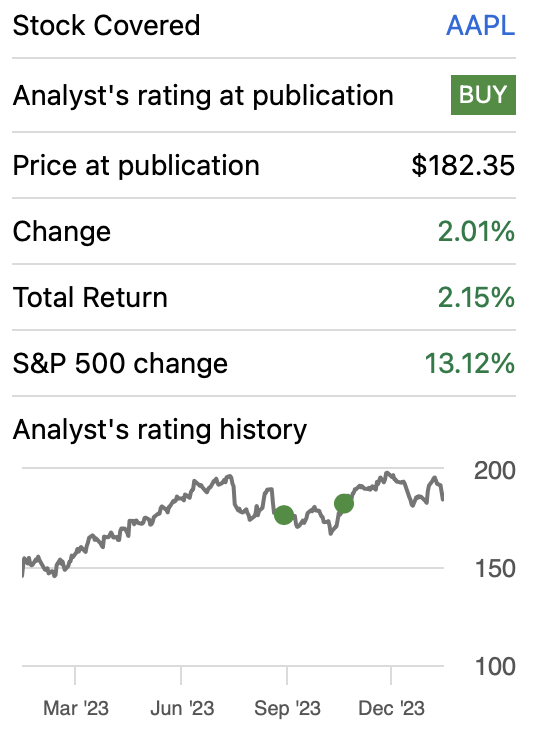
Overview
FQ1 2024 Earnings (In millions of USD unless specified otherwise)
After reporting earnings, Apple shares declined by around 4% due to a 13% sales decline in China and weakness in the iPhone sales. Nevertheless, Apple beat in Revenue and EPS.
Apple FQ1 2024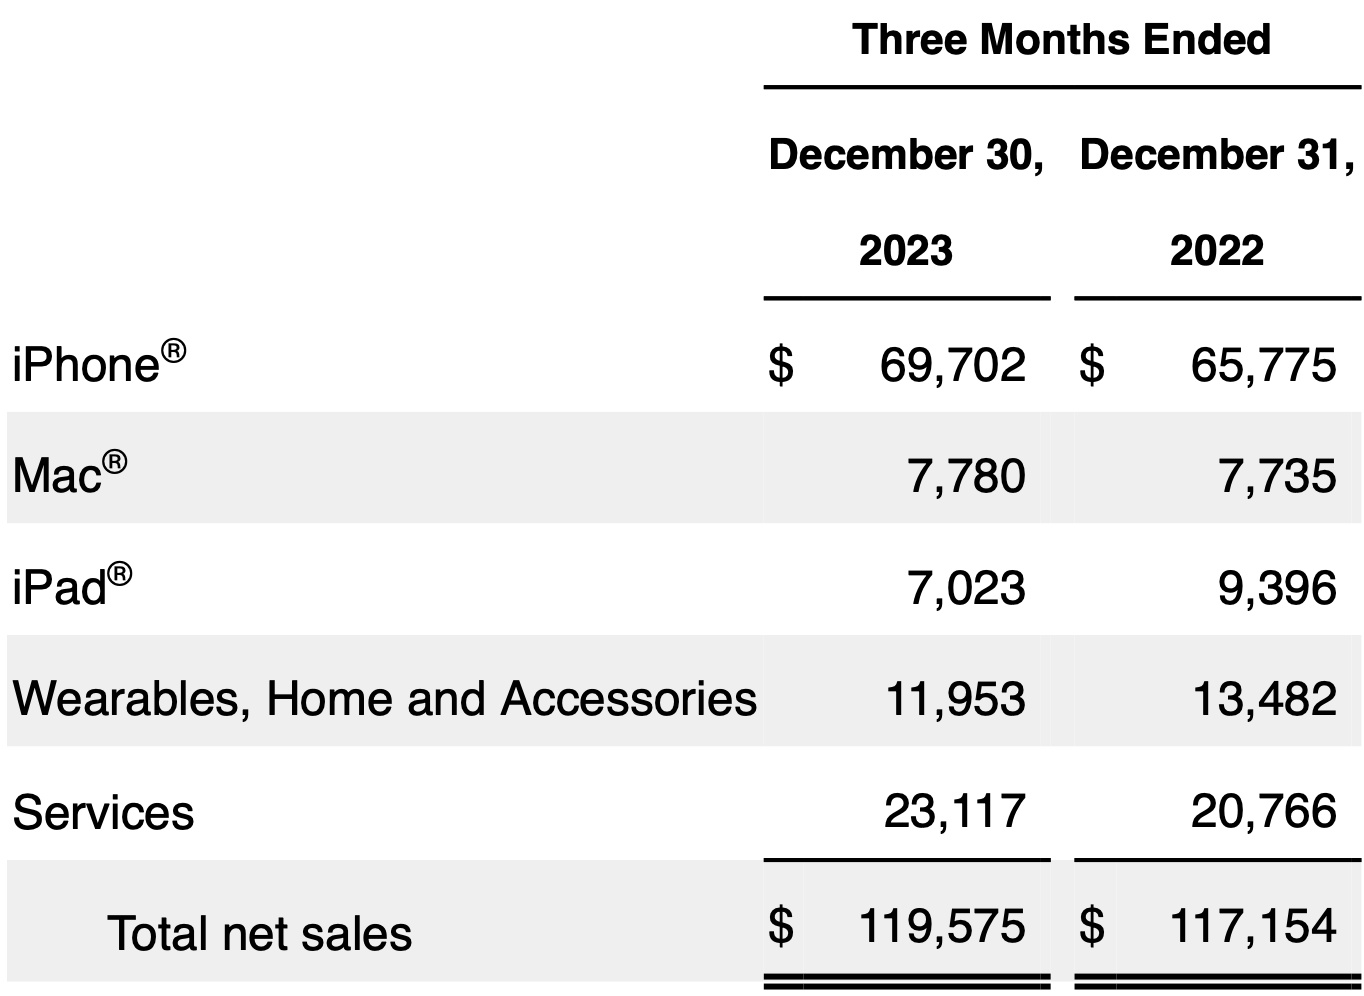
Devices
iPhone sales have increased 5.97% from the same quarter in the previous year, while Mac sales have increased by 0.58%. Meanwhile iPads have a huge dive of 25.2%. The revenue of the worldwide smartphone market is projected to grow at a CAGR of 3.53% throughout 2028.
Wearables, Home, and Accessories
Accessories have decreased by 11.31% from the same quarter a year ago. Nevertheless in FY2023, accessories displayed a decrease of 3% similar to the decrease displayed by iPhone and iPad of 2 and 3% respectively. This showcases that the vast majority of Apple buyers, buy their accessories directly from Apple (like covers). Therefore, in the valuation section I will make this segment grow at the same pace as device sales.
Services
Services are the big promise for Apple’s growth, as they have displayed a decent 11% growth since the same quarter a year ago. This segment can be categorized into apps, repairs, and Apple Pay. The largest contributor to this segment is the App Store. The revenue of the worldwide apps market is expected to grow at a CAGR of 8.58%.
It’s estimated that in 2022, consumers spent $86.8 billion in the App Store. Apple charges around 30% for apps and in-app purchases, therefore, we can estimate that in 2022, the App Store generated around $26 billion in revenues. If we apply the CAGR of 8.58% to the App Store, we can estimate that for 2023 it could have earned around $28.2 billion.
For other apps, some sources estimate that Apple could have earned around $26.5 billion. If we assume that this grows at the 8.58% CAGR of the Apps Market, we can estimate that for 2023, Apple generated around $33.9 billion in addition to the $28.2 billion generated by the App Store.
Then there is Apple’s payment services. Some sources estimate that in 2022, it earned around $1.9 billion. The US fintech market is projected to grow at a CAGR of 16.46%. With this, we can estimate that for 2023, Payment Services generated around $2.2 billion in revenues.
Finally, there are the repair services that Apple offers. The consumer electronics repair market is forecasted to grow at a rate of 2.5%. AppleCare is speculated to have generated around $8.5 billion in 2021; therefore, if we project that estimate to 2023 using the 2.5% CAGR of the repairs market, we can estimate that for 2023, AppleCare generated $8.93 billion in revenues.
Lastly, in order to predict how much Apple earned in repairs, I will subtract all the results I previously obtained from the 2023 Services revenue of $85.2 billion. This calculation yields a result of $12 billion.
Financials (In millions of USD unless specified otherwise)
Apple’s revenue has sustained an annual growth rate of 7.5% since 2018. Operating income has outpaced this growth, expanding at a rate of 11.2% annually. Meanwhile, net income has been the fastest-growing metric, achieving an 11.6% growth rate.
Since my previous article, released in Q4 2023, revenue has increased by 0.65%, while operating income has surged by 3.76%. Net income exhibited even stronger growth, at 4.12%, surpassing the other two metrics.
Margins have also improved notably. The operating margin rose from 29.82% in Q4 2023 to 30.76%, while net income increased from 25.31% to 26.16%.
Author’s Calculations
Author’s Calculations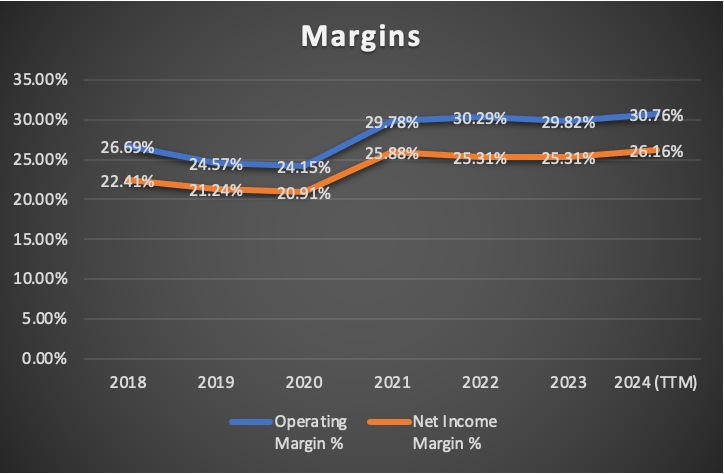
Apple’s debt load has significantly decreased since my last analysis. At the time of my previous article, the debt load totaled $123.93 billion, whereas it now stands at $108.04 billion, reflecting a reduction of $15.89 billion. In contrast, cash reserves have increased by approximately $11.6 billion, bringing the current cash reserves to $73.1 billion.
Author’s Calculations
Furthermore, free cash flow has improved compared to the previous assessment. In my prior coverage, FCF stood at $86.7 billion, whereas it now stands at $93.27 billion, indicating a 7.57% improvement. The FCF margin has also increased to 24.2%, up from the previous 22.7%. This improvement is attributed to the increase in cash from operations, rising from $110.5 billion to $116.43 billion, and the reduction in CapEx, which decreased from $10.9 billion to the current $9.56 billion.
Author’s Calculations
Author’s Calculations
Author’s Calculations
Valuation (In millions of USD unless specified otherwise)
In this article, I will present two valuation scenarios: the first scenario is based on analysts’ estimates, while the second scenario reflects my own estimates.
The table below contains all the current data available for Apple as of the latest Q1 2024 filing. CapEx, D&A (Depreciation and Amortization), and interest expenses will be calculated with margins tied to revenue, aligning with the logic that increased production requires additional investment. While this principle is typically more applicable to industrial companies, incorporating it into the model adds a layer of conservatism.
| TABLE OF ASSUMPTIONS | |
| (Current data) | |
| Assumptions Part 1 | |
| Equity Value | 74,100.00 |
| Debt Value | 108,040.00 |
| Cost of Debt | 3.64% |
| Tax Rate | 14.80% |
| 10y Treasury | 4.03% |
| Beta | 1.200 |
| Market Return | 10.50% |
| Cost of Equity | 11.79% |
| Assumptions Part 2 | |
| CapEx | 9,564.00 |
| Capex Margin | 2.48% |
| Net Income | 100,913.00 |
| Interest | 3,933.00 |
| Tax | 17,523.00 |
| D&A | 11,451.00 |
| Ebitda | 133,820.00 |
| D&A Margin | 2.97% |
| Interest Expense Margin | 1.02% |
| Revenue | 385,706.0 |
Analysts’ Estimates (In millions of USD unless specified otherwise)
As previously mentioned, the first model will be based on the available estimates found on Seeking Alpha. As you can see, EPS estimates indicate mid-high single-digit growth throughout 2026. However, there is a significant spike of 23.51% growth projected for 2027, followed by a more moderate growth rate of 11.72%. Nonetheless, for my model, I will only utilize the data for 2024 and 2025.
Seeking Alpha
Revenue estimates do not reflect such high growth rates. Throughout 2028, revenue is expected to grow at mid-single digits, with the only exception being 2027, where revenue is forecasted to grow by 8.34%. For revenue, I will also solely incorporate estimates for 2024 and 2025.
Seeking Alpha
Finally, to project revenue beyond 2025, I will employ a forward revenue growth rate of 2.04%, and for net income, I will use the 3-5 year long-term EPS growth rate of 9.63%. This growth rate will also be applied in the DCF model. To determine the perpetuity growth rate, one would need to divide the growth rate by the difference between the growth rate and the WACC.
| Revenue | Net Income | Plus Taxes | Plus D&A | Plus Interest | |
| 2024 | $390,100.0 | $101,744.29 | $116,797.69 | $128,379.14 | $132,356.95 |
| 2025 | $416,070.0 | $110,739.97 | $127,124.32 | $138,705.77 | $142,683.58 |
| 2026 | $424,557.8 | $121,404.23 | $139,366.39 | $151,970.84 | $156,300.01 |
| 2027 | $433,218.8 | $133,095.46 | $152,787.37 | $165,648.95 | $170,066.44 |
| 2028 | $442,056.5 | $145,912.55 | $167,500.80 | $180,624.75 | $185,132.35 |
| 2029 | $451,074.4 | $159,963.93 | $183,631.13 | $197,022.81 | $201,622.36 |
| ^Final EBITA^ |
| Net Income Margin % |
| 25.63% |
| 26.26% |
| 28.25% |
| 30.39% |
| 32.69% |
| 35.17% |
Author’s Calculations
This preliminary model reveals a clear undervaluation result. The fair price is suggested to be $276.29, representing a 48.6% upside from the current stock price. Meanwhile, the future price (assuming the metrics composing the equity continue to evolve at the same trend observed from 2018 to 2024) should be around $401.14, translating into an annual return of 19.5%.
My Estimates (In millions of USD unless specified otherwise)
As previously stated, this second model will be grounded in the available market trends for each of the segments in which Apple’s products could be classified. As outlined in the overview section, sales of devices are expected to grow at a rate of 3.53%, apps at 8.58%, repairs and AppleCare at 2.5%, Apple Payment Services at 16.46%, and accessories at the same rate as devices, 3.5%, since nearly everyone purchasing an expensive iPhone tends to buy a case and a screen protector. The totals derived from these calculations are displayed below.
| Sale of Devices | Apps (Services) | Apple Care (Services) | Repairs (services) | Payment Services (Services) | Wearables, Homes and Accessories | |
| FY 2023 | 258,240.0 | 62,048.2 | 8,930.3 | 12,009.7 | 2,212.7 | 39,845.0 |
| FY 2024 | 267,355.9 | 67,371.9 | 9,153.6 | 12,309.9 | 2,576.9 | 41,259.5 |
| FY 2025 | 276,793.5 | 73,152.4 | 9,382.4 | 12,617.7 | 3,001.1 | 42,724.2 |
| FY 2026 | 286,564.3 | 79,428.9 | 9,617.0 | 12,933.1 | 3,495.0 | 44,240.9 |
| FY 2027 | 296,680.1 | 86,243.9 | 9,857.4 | 13,256.5 | 4,070.3 | 45,811.5 |
| FY 2028 | 307,152.9 | 93,643.6 | 10,103.8 | 13,587.9 | 4,740.3 | 47,437.8 |
| FY 2029 | 317,995.4 | 101,678.2 | 10,356.4 | 13,927.6 | 5,520.6 | 49,121.8 |
| %of Revenue | 55.26% | 26.18% | 126.18% | 7.05% | 2.20% | 9.32% |
To project net income, I will utilize the net income margins derived from analysts’ estimates, which you can find in the previous model just below the EBITDA table.
| Revenue | Net Income | Plus Taxes | Plus D&A | Plus Interest | |
| 2024 | $400,027.7 | $102,527.09 | $117,696.32 | $129,572.51 | $133,651.54 |
| 2025 | $417,671.3 | $109,680.49 | $125,908.08 | $137,784.27 | $141,863.30 |
| 2026 | $436,279.3 | $123,248.90 | $141,483.98 | $154,436.42 | $158,885.11 |
| 2027 | $455,919.6 | $138,553.97 | $159,053.49 | $172,589.02 | $177,237.98 |
| 2028 | $476,666.3 | $155,822.20 | $178,876.61 | $193,028.08 | $197,888.59 |
| 2029 | $498,600.0 | $175,357.61 | $201,302.35 | $216,104.99 | $221,189.16 |
| ^Final EBITA^ |
Author’s Calculations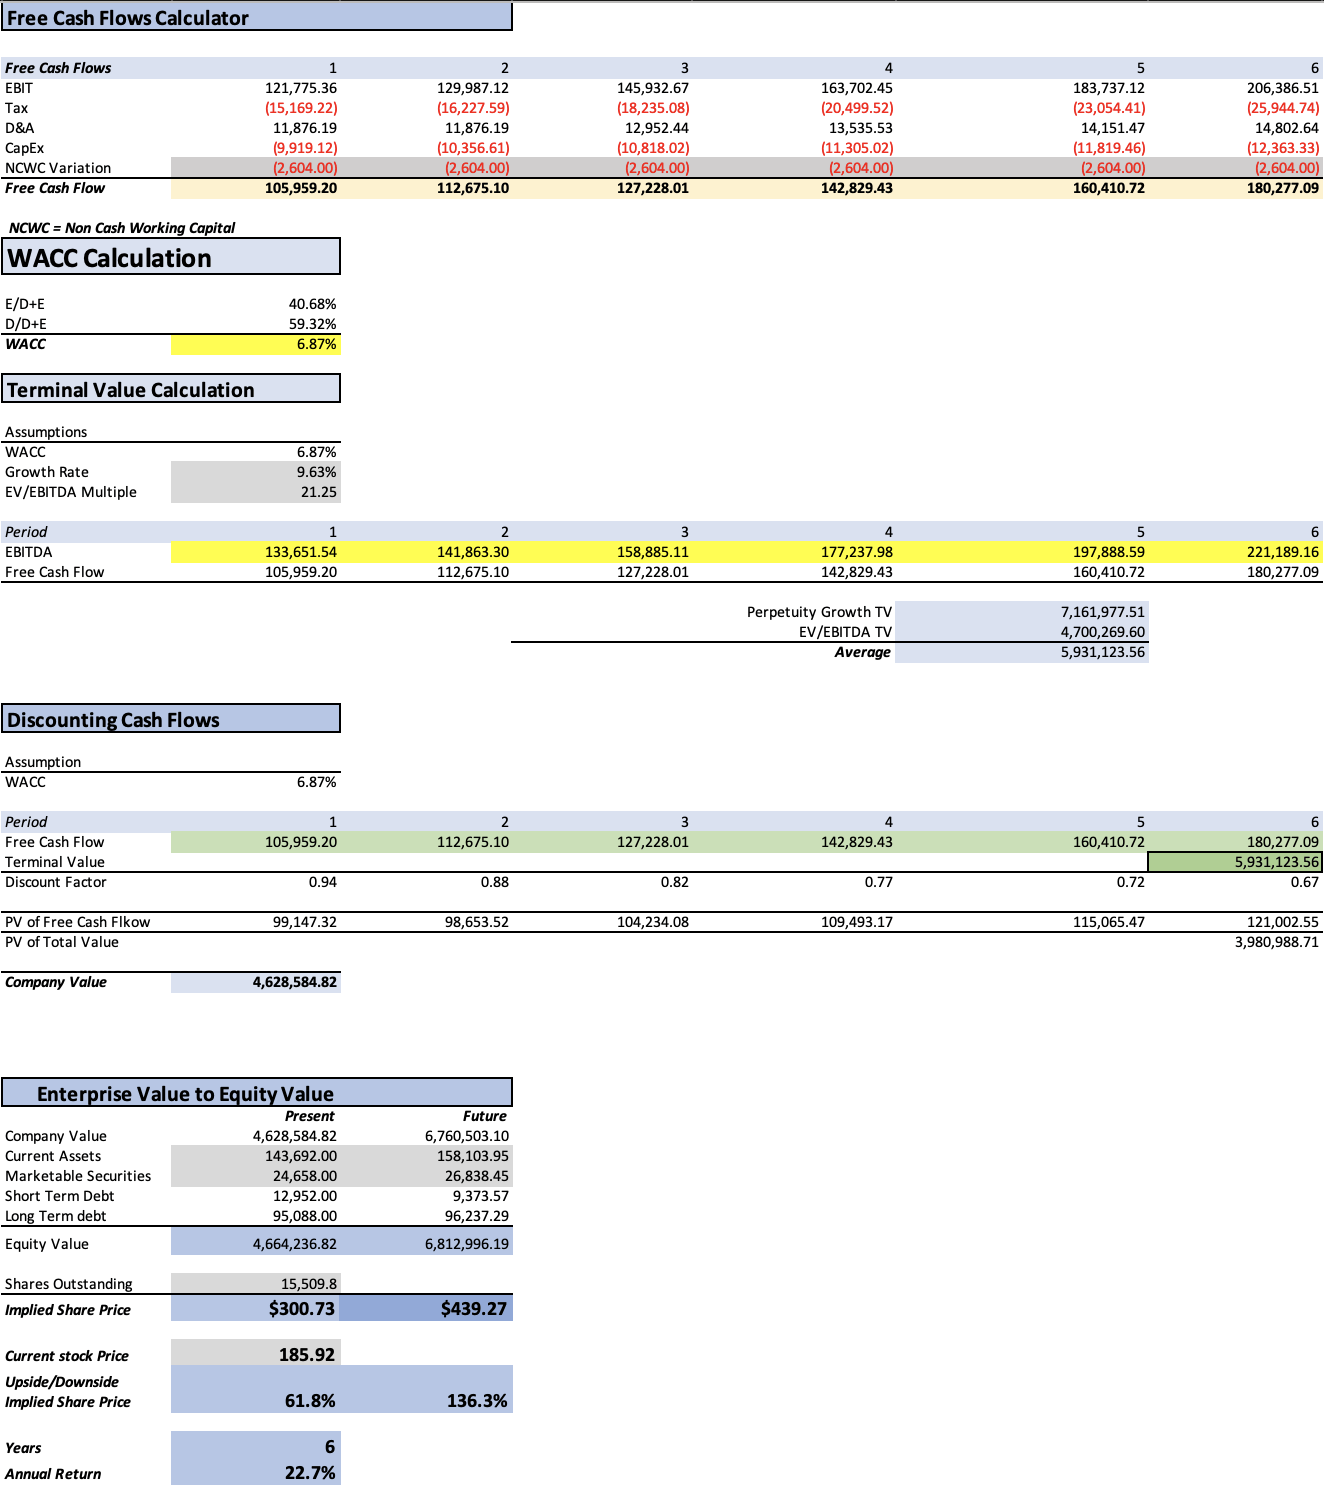
This model appears more optimistic than the previous one, as it suggests a fair price of around $300.73, indicating a 61.8% upside from the current stock price. The model indicates that by 2029, the stock should reach a price of $439.27, translating into annual returns of 22.7%.
Risks to Thesis
The largest risk I perceive is the potential decline in iPhone, Mac, and iPad sales, which could significantly challenge Apple’s position. In such a scenario, Apple would face two options: either innovate further or immediately reduce prices. However, reducing prices could potentially tarnish Apple’s reputation as a prestigious brand. Moreover, licensing iOS is not a favorable option as it would eliminate the iPhone’s competitive advantage in terms of interface superiority.
The second risk associated with my thesis involves market pessimism. Prior to writing this article, I noticed other analysts issuing sell and hold ratings. Historically, when the majority sentiment leans towards negativity, it often forecasts a downturn in the stock in the short term.
Lastly, regarding concerns about China posing a risk and potentially rendering Apple stock worthless, I have already addressed this issue in my initial article about Apple. I explained why Apple would likely remain relatively stable by unfavorable developments in China.
Conclusion
In conclusion, the comprehensive analysis of Apple’s financial performance and market trends underscores a promising outlook for the tech giant. Through meticulous examination, two distinct valuation models shed light on Apple’s potential trajectory. The first model, rooted in analysts’ estimates, indicates a fair price of $276.29, presenting a compelling 48.6% upside from the current stock price. Moreover, the projected future price of $401.14 suggests an annual return of 19.5%, based on the observed trends from 2018 to 2024. Conversely, the second model, anchored in market trends, offers a more optimistic view, projecting a fair price of approximately $300.73, translating to a remarkable 61.8% upside. Furthermore, the model anticipates a target price of $439.27 by 2029, with an annual return of 22.7%. Despite inherent risks, including potential sales declines and market pessimism, Apple’s unwavering commitment to innovation and strategic resilience positions it favorably for sustained growth and continued market leadership in the ever-evolving technology landscape. Finally, due to the positive result from both models, I am increasing my rating on Apple from buy to strong buy.
Analyst’s Disclosure: I/we have no stock, option or similar derivative position in any of the companies mentioned, but may initiate a beneficial Long position through a purchase of the stock, or the purchase of call options or similar derivatives in AAPL over the next 72 hours. I wrote this article myself, and it expresses my own opinions. I am not receiving compensation for it (other than from Seeking Alpha). I have no business relationship with any company whose stock is mentioned in this article.
Seeking Alpha’s Disclosure: Past performance is no guarantee of future results. No recommendation or advice is being given as to whether any investment is suitable for a particular investor. Any views or opinions expressed above may not reflect those of Seeking Alpha as a whole. Seeking Alpha is not a licensed securities dealer, broker or US investment adviser or investment bank. Our analysts are third party authors that include both professional investors and individual investors who may not be licensed or certified by any institute or regulatory body.