
Summary:
- Amazon’s stock evaluation reveals a nuanced landscape influenced by various factors and forecasts.
- Despite optimistic the optimistic second model, Amazon is required to abstain from CapEx increases in order to achieve it.
- The average fair price of $185.92 with an 8.18% upside signals cautious optimism amidst market uncertainties.
- A target future price of $313.99 with an expected annual return of 13.93% through 2029 highlights the potential rewards of strategic investment if current headwinds are ignored.
Bloomberg/Bloomberg via Getty Images
Thesis
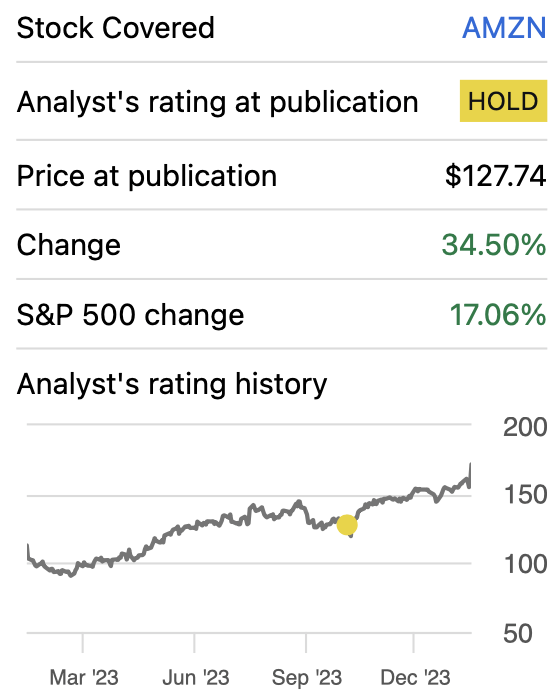
In my previous article on Amazon.com, Inc. (NASDAQ:AMZN), I assigned the stock a hold rating, citing its limited upside potential based on the fair price of $127.9 and the future price of $181.1 suggested by the DCF models. However, Amazon saw a rally of around 20% because it beat Q3 2023 earnings estimates. This upside trend continued in Q4 2023, resulting in an overall increase of 34.50%.
In this article, I will try to explore the reason that led to my previous model failing to predict Amazon’s recent movements. I concluded that the issue lays in the fact that Amazon is trading on very optimistic expectations, which in other things would need CapEx to remain constant (without any increase) for this positive sentiment to persist. Additionally, Amazon cannot permit itself from missing any future earnings estimates in order to maintain the optimism. This reaffirms my hold rating on Amazon. The results suggested by my models is a present fair price of $185.92 and a future price of $313.99
Seeking Alpha
Overview
FQ4 2023
In Q4 2023, Amazon beat on earnings expectations thanks to a robust holiday quarter, generating around $3.7 billion more in comparison with the $166.3 billion anticipated by analysts. Furthermore, cash flow surged to a positive $36.8 billion. Subsequently, Amazon increased its outlook, now the top estimate stands at $143.5 billion, which is greater than the consensus of $142 billion.
Amazon FQ4 2023
Cloud
AWS is on the most important growth drivers Amazon has right now, since it’s highly profitable and has been able to deliver very decent growth rates. The worldwide public cloud market revenue is anticipated to grow at a CAGR of 16.3%.
E-Commerce & Third-Party Seller Services
Meanwhile, the e-commerce segment, which groups Amazon’s online store and its third-party seller services, is not a slow grower by no means. The problem is that it’s expensive to operate and that it has not been profitable for the most part of its existence. It is expected that the global e-commerce market will grow at a CAGR of 15% throughout 2032.
Advertising
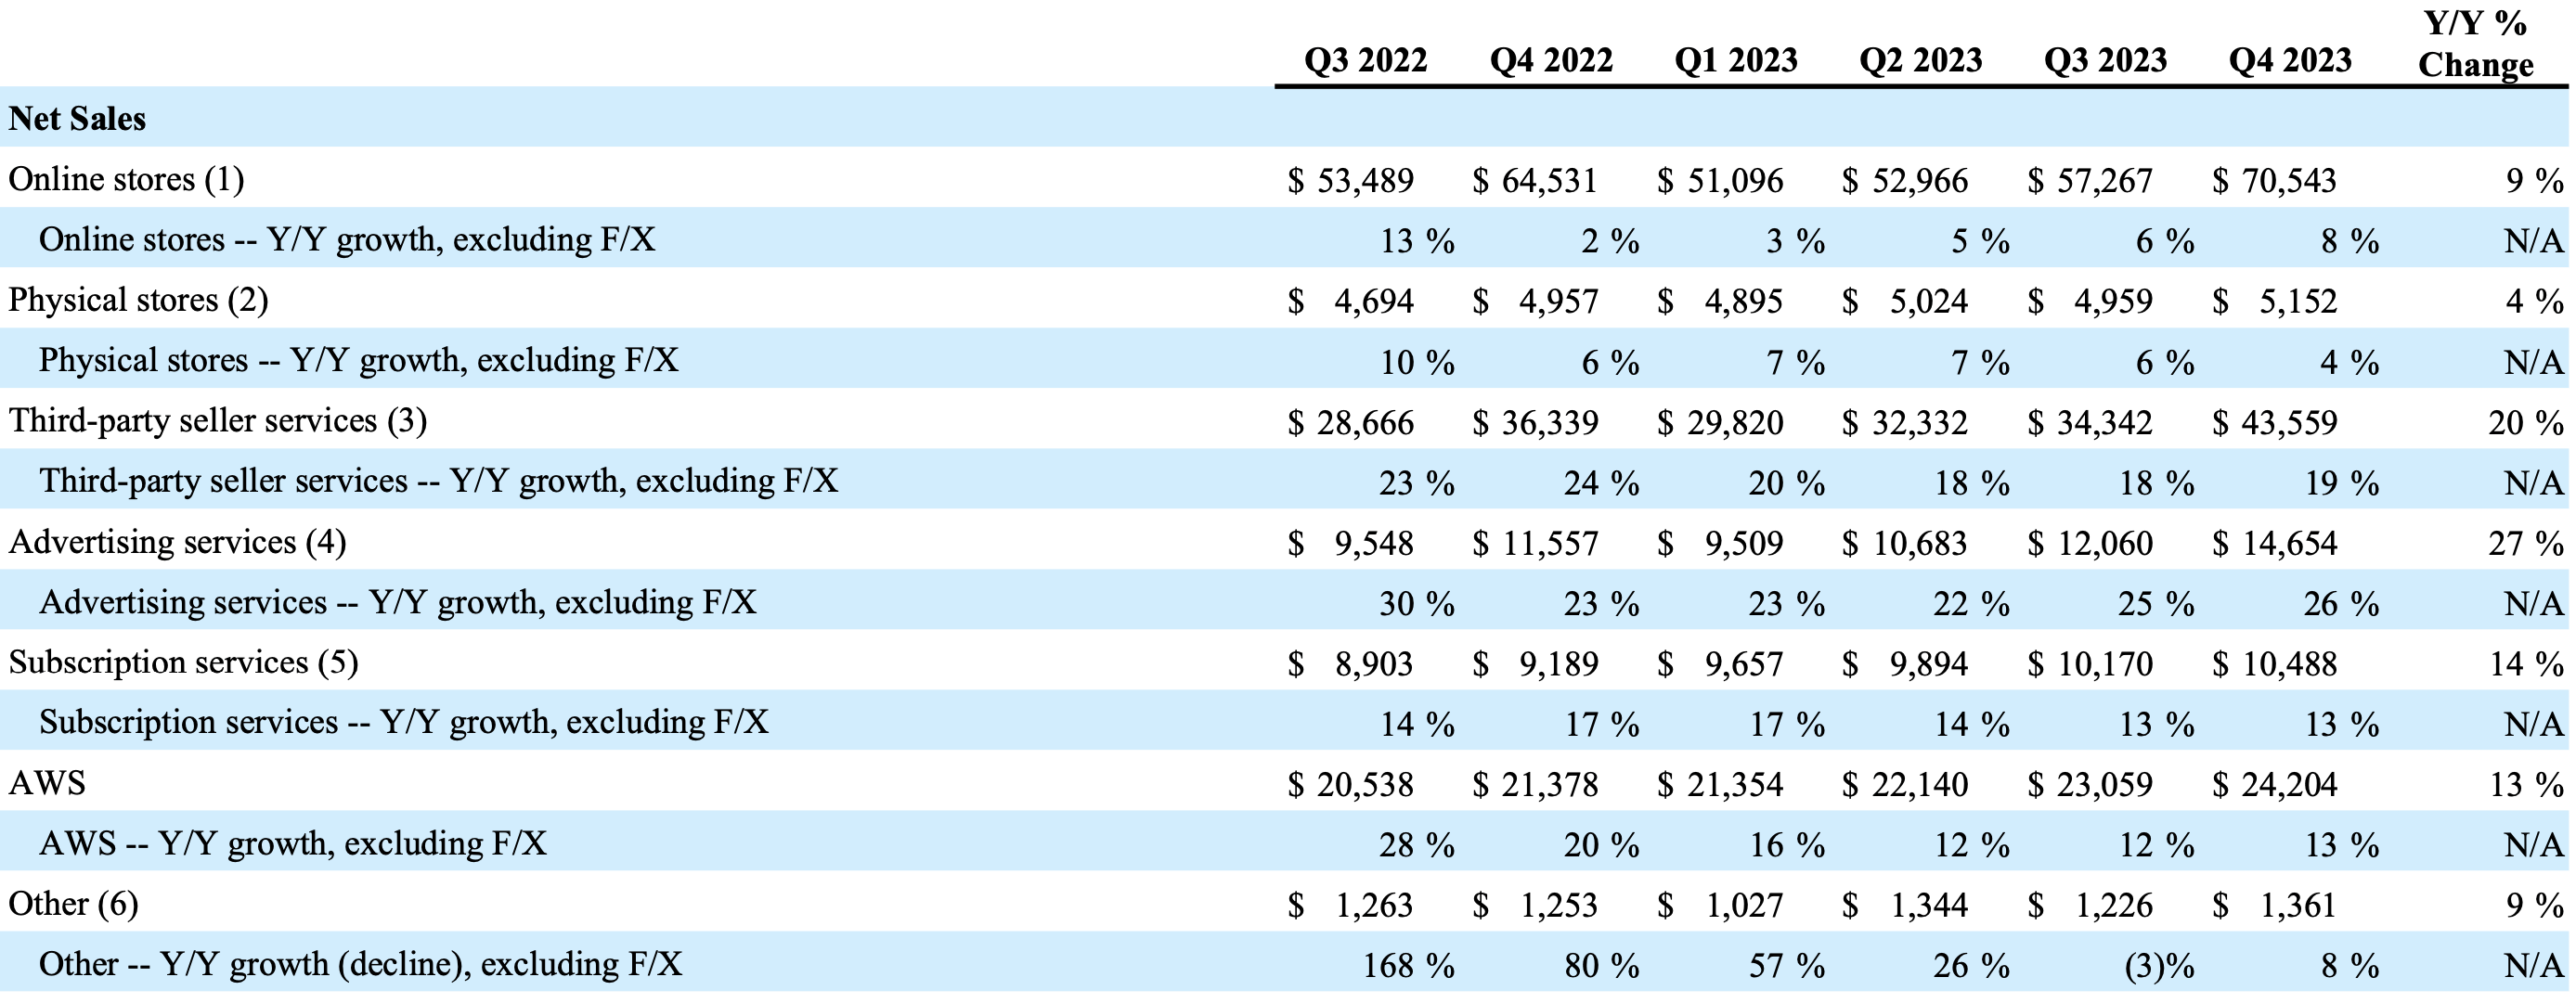
This is one of Amazon’s high growth segments, as you can see in the FQ4 2023 caption, it has displayed a quarterly growth of around 20-26%. The worldwide digital advertising market is anticipated to grow at a CAGR of approximately 6.94%.
Financials
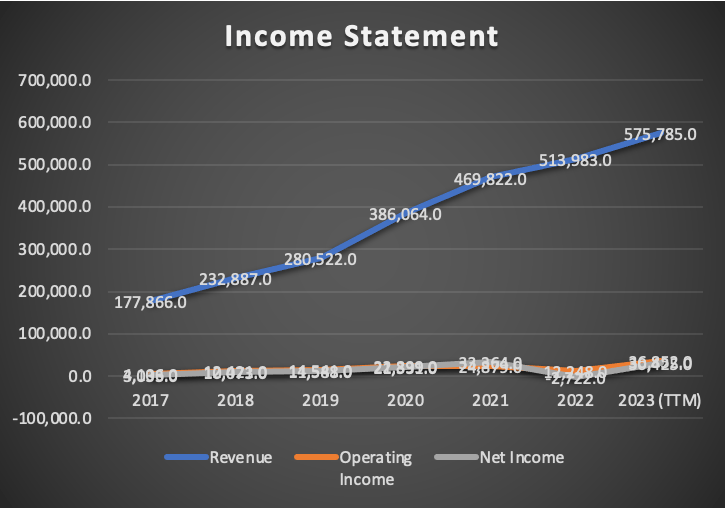
Amazon’s revenue has been growing at an annual rate of 37.3% since 2017. Meanwhile, operating income has grown faster, at 132.9%, and net income is not behind, with a growth rate of 150.5%.
Since my previous article, released in Q3 2023, revenue has increased by 7%, while operating income has surged by 107.9%. Net income has displayed a fantastic growth of 133.8%.
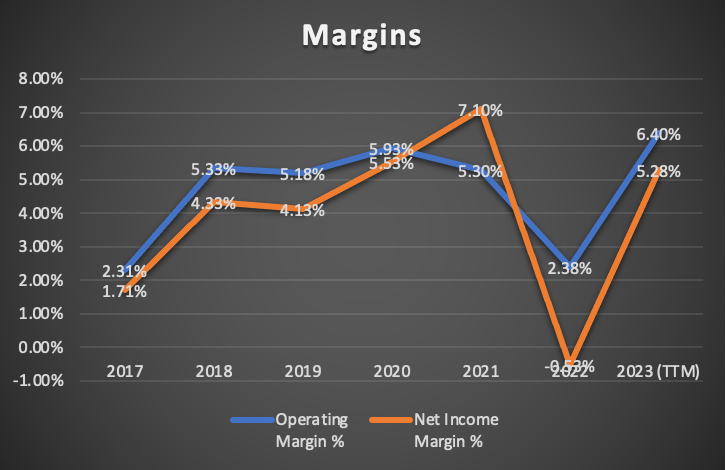
In what concerns margins, they have nearly doubled. Operating margin passed from 3.29% to 6.40%, and net income margin improved from 2.43% to 5.28%.
Author’s Calculations
Author’s Calculations
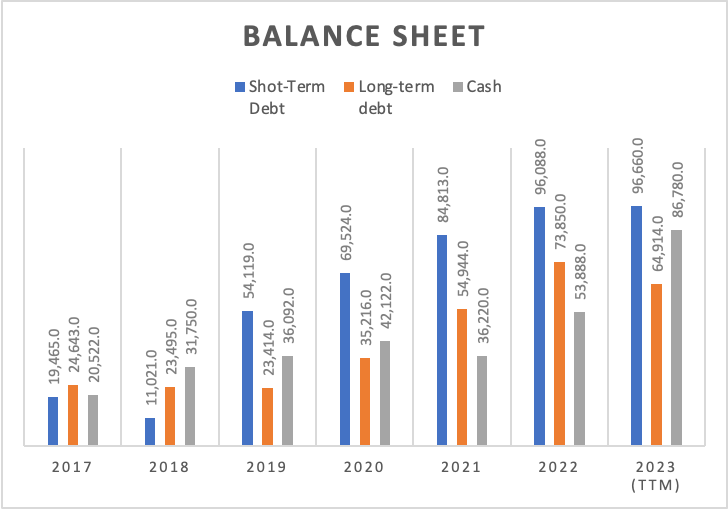
The balance sheet has witnessed a significant improvement in cash reserves, which have increased substantially from $49.5 billion to $86.7 billion. Meanwhile, long-term debt has decreased from $69.6 billion to $64.9 billion. Lastly, short-term debt has decreased from $104.5 billion to $96.6 billion.
Author’s Calculations
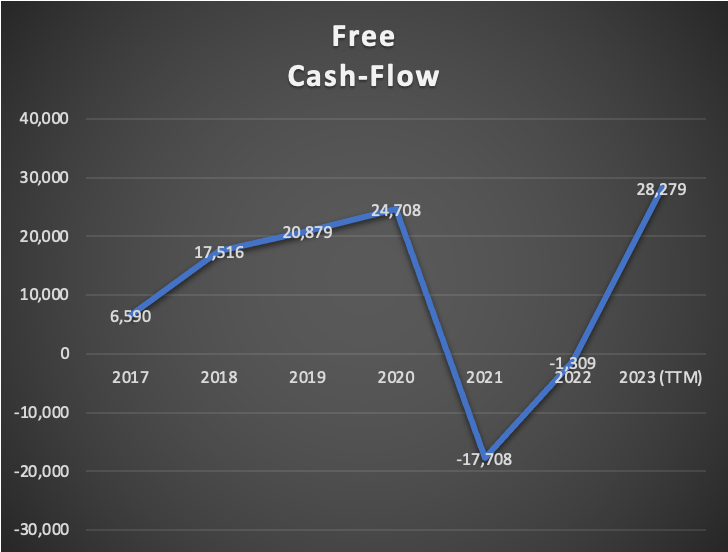
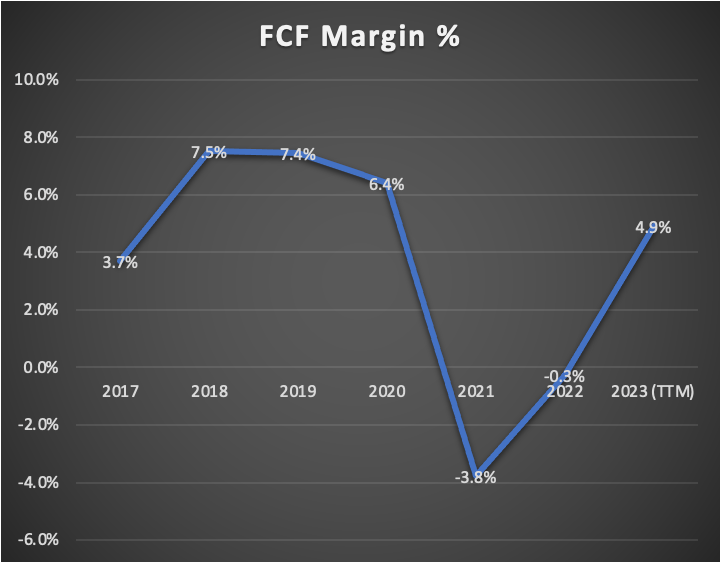
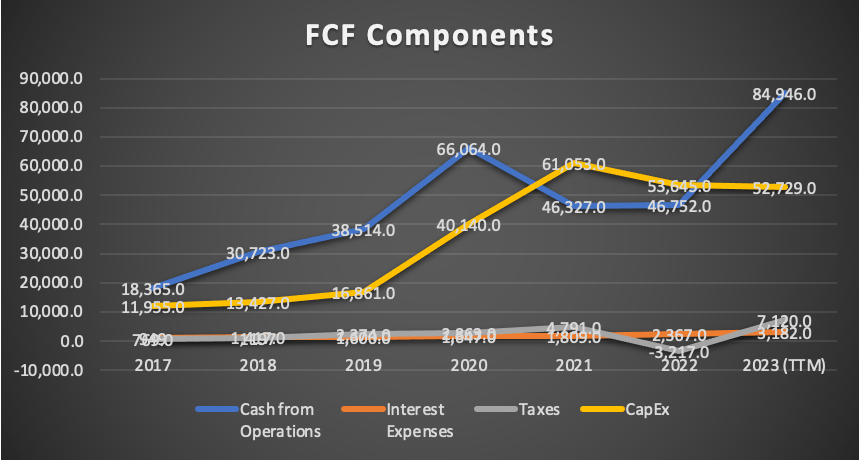
Finally, free cash flow has experienced a remarkable 412% increase. This substantial improvement has reflected in the FCF margin, which expanded from 1% to 4.9%. This improvement can be attributed to a surge in cash from operations which eased the weight of increased CapEx, that has remained elevated since 2021 while cash from operations declined.
Author’s Calculations
Author’s Calculations
Author’s Calculations
Valuation
In this article, I will conduct two models. The first one will be based on current estimates, while the second one will rely on the discussed market trends in the overview section.
In the table below, you can observe all the variables necessary for the DCF model. D&A, interest expenses, and CapEx will be calculated with margins tied to revenue.
| TABLE OF ASSUMPTIONS | |
| (Current data) | |
| Assumptions Part 1 | |
| Equity Value | 201,875.00 |
| Debt Value | 161,574.00 |
| Cost of Debt | 1.97% |
| Tax Rate | 18.96% |
| 10y Treasury | 4.02% |
| Beta | 1.06 |
| Market Return | 10.50% |
| Cost of Equity | 10.89% |
| Assumptions Part 2 | |
| CapEx | 52,729.00 |
| Capex Margin | 9.16% |
| Net Income | 30,425.00 |
| Interest | 3,182.00 |
| Tax | 7,120.00 |
| D&A | 36,104.00 |
| Ebitda | 76,831.00 |
| D&A Margin | 6.27% |
| Interest Expense Margin | 0.55% |
| Revenue | 575,785.0 |
Analysts’ Estimates
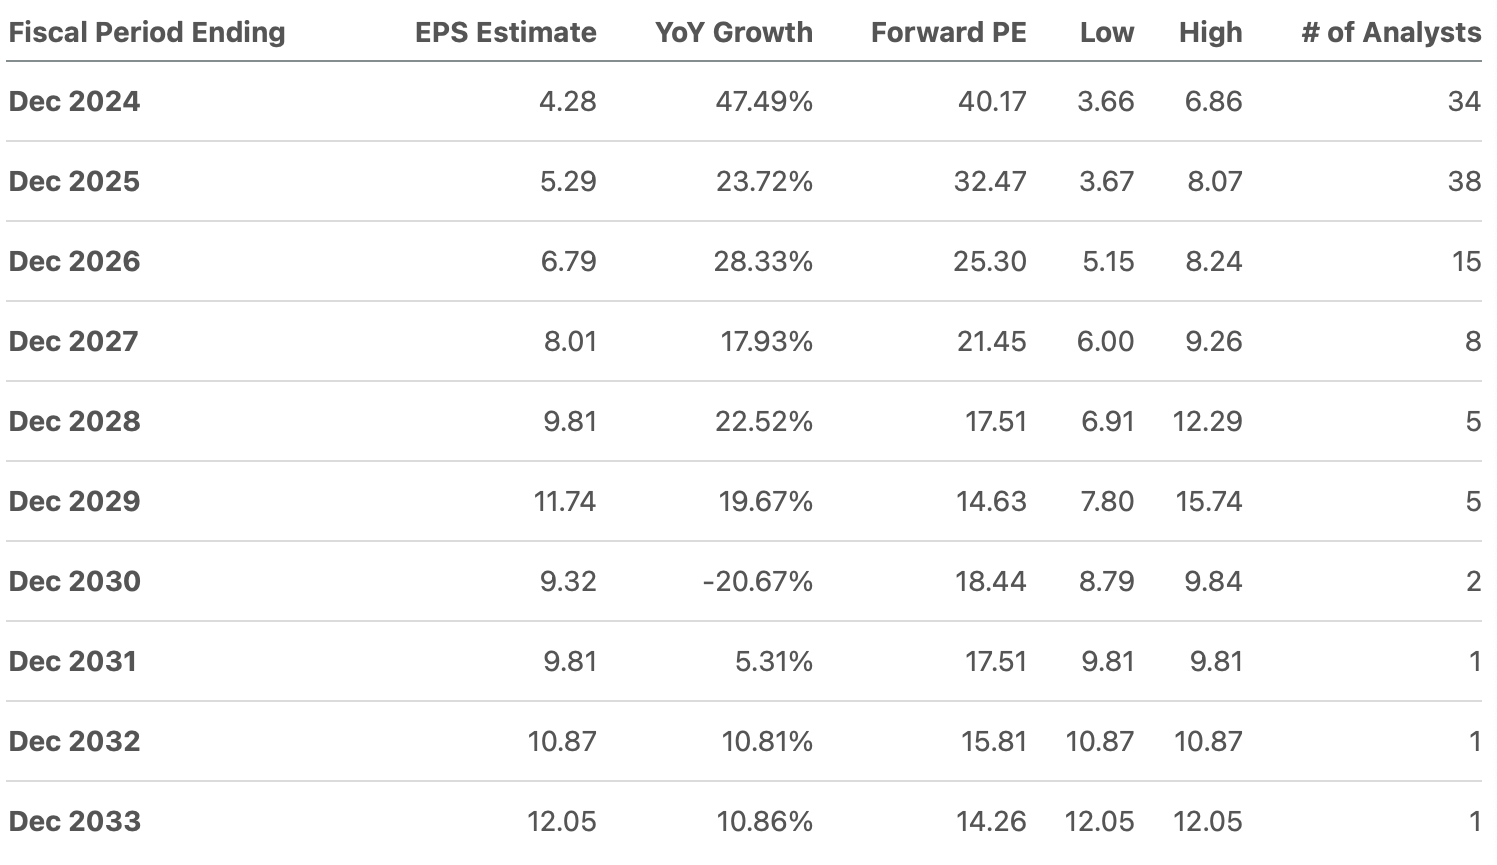
Starting with EPS, available estimates suggest a robust double-digit growth. For 2024, analysts are estimating an EPS of $4.28, which represents a growth of 47.49% in a YoY basis. For 2025, the projected EPS is $5.29, which indicates a YoY growth of 23.72%. In order to project net income with this, I will be multiplying them by the amount of shares outstanding.
Seeking Alpha
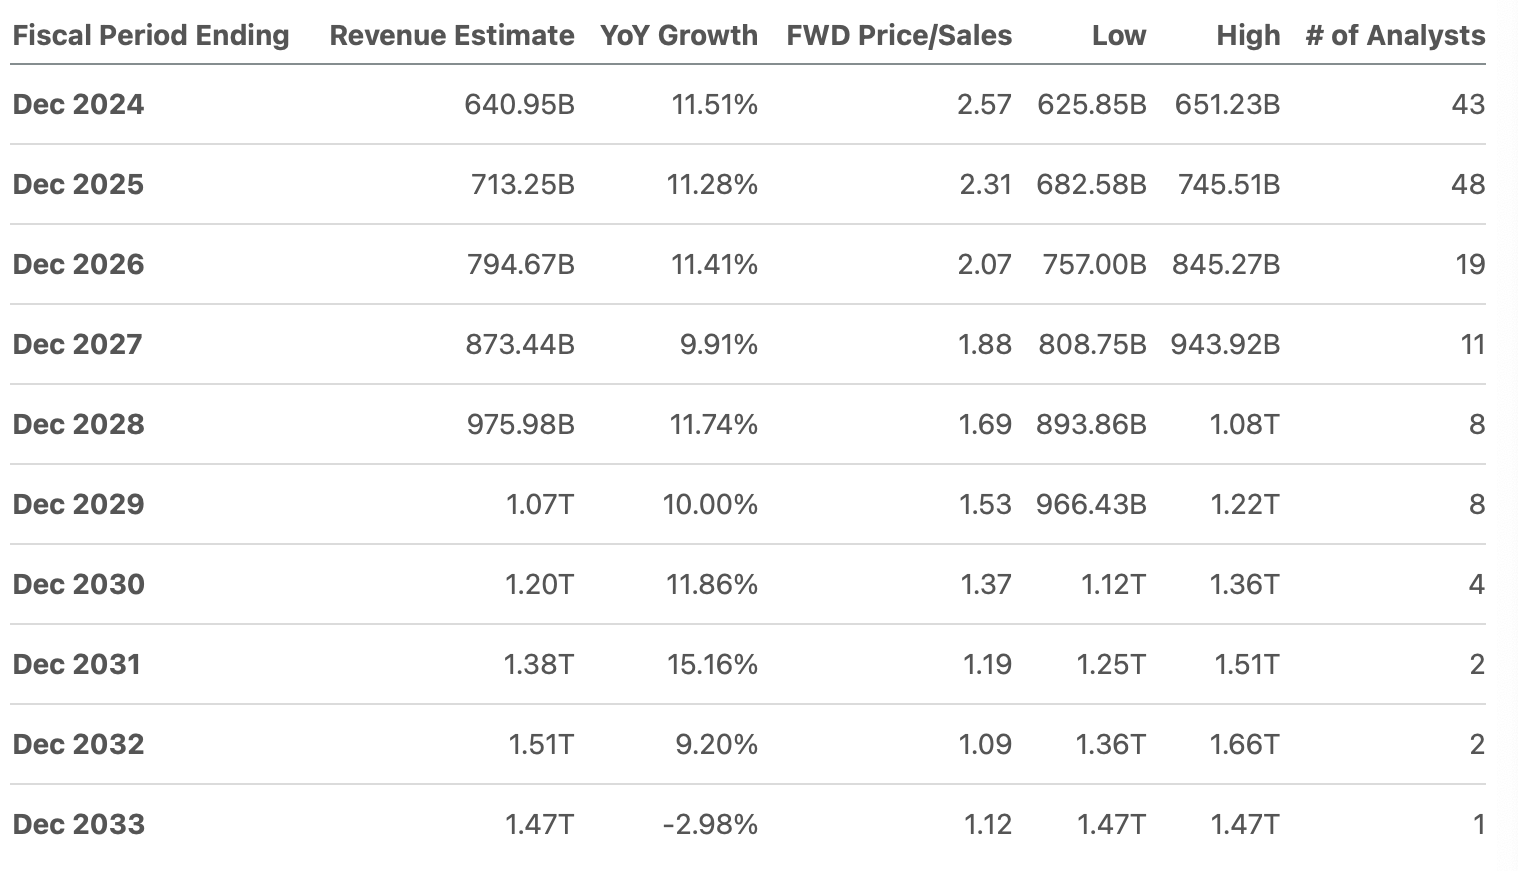
Turning to revenue, we can observe that growth rates are more moderate, and that’s the growth rate slows significantly slows as we approach year 2033. For 2024, analysts’ estimate that revenue will grow 11.51% in a YoY basis, reaching $640.95 billion. Then, for 2025, revenue is expected to reach $713.25 billion, which reflects an 11.28% YoY growth.
Seeking Alpha
Finally, to calculate revenue and net income beyond 2025, I will use the forward revenue growth rate of 11.37% and the 3-5y year long-term EPS growth rate of 25.90%. Both of these figures are available on Seeking Alpha.
| Revenue | Net Income | Plus Taxes | Plus D&A | Plus Interest | |
| 2024 | $640,950.0 | $44,439.24 | $52,866.66 | $93,056.76 | $96,598.89 |
| 2025 | $713,250.0 | $54,926.07 | $65,342.20 | $105,532.30 | $109,074.43 |
| 2026 | $794,346.5 | $69,151.92 | $82,265.83 | $132,074.50 | $136,464.36 |
| 2027 | $884,663.7 | $87,062.27 | $103,572.68 | $159,044.60 | $163,933.58 |
| 2028 | $985,250.0 | $109,611.40 | $130,398.00 | $192,177.08 | $197,621.94 |
| 2029 | $1,097,272.9 | $138,000.75 | $164,171.09 | $232,974.45 | $239,038.38 |
| ^Final EBITA^ |
Author’s Calculations
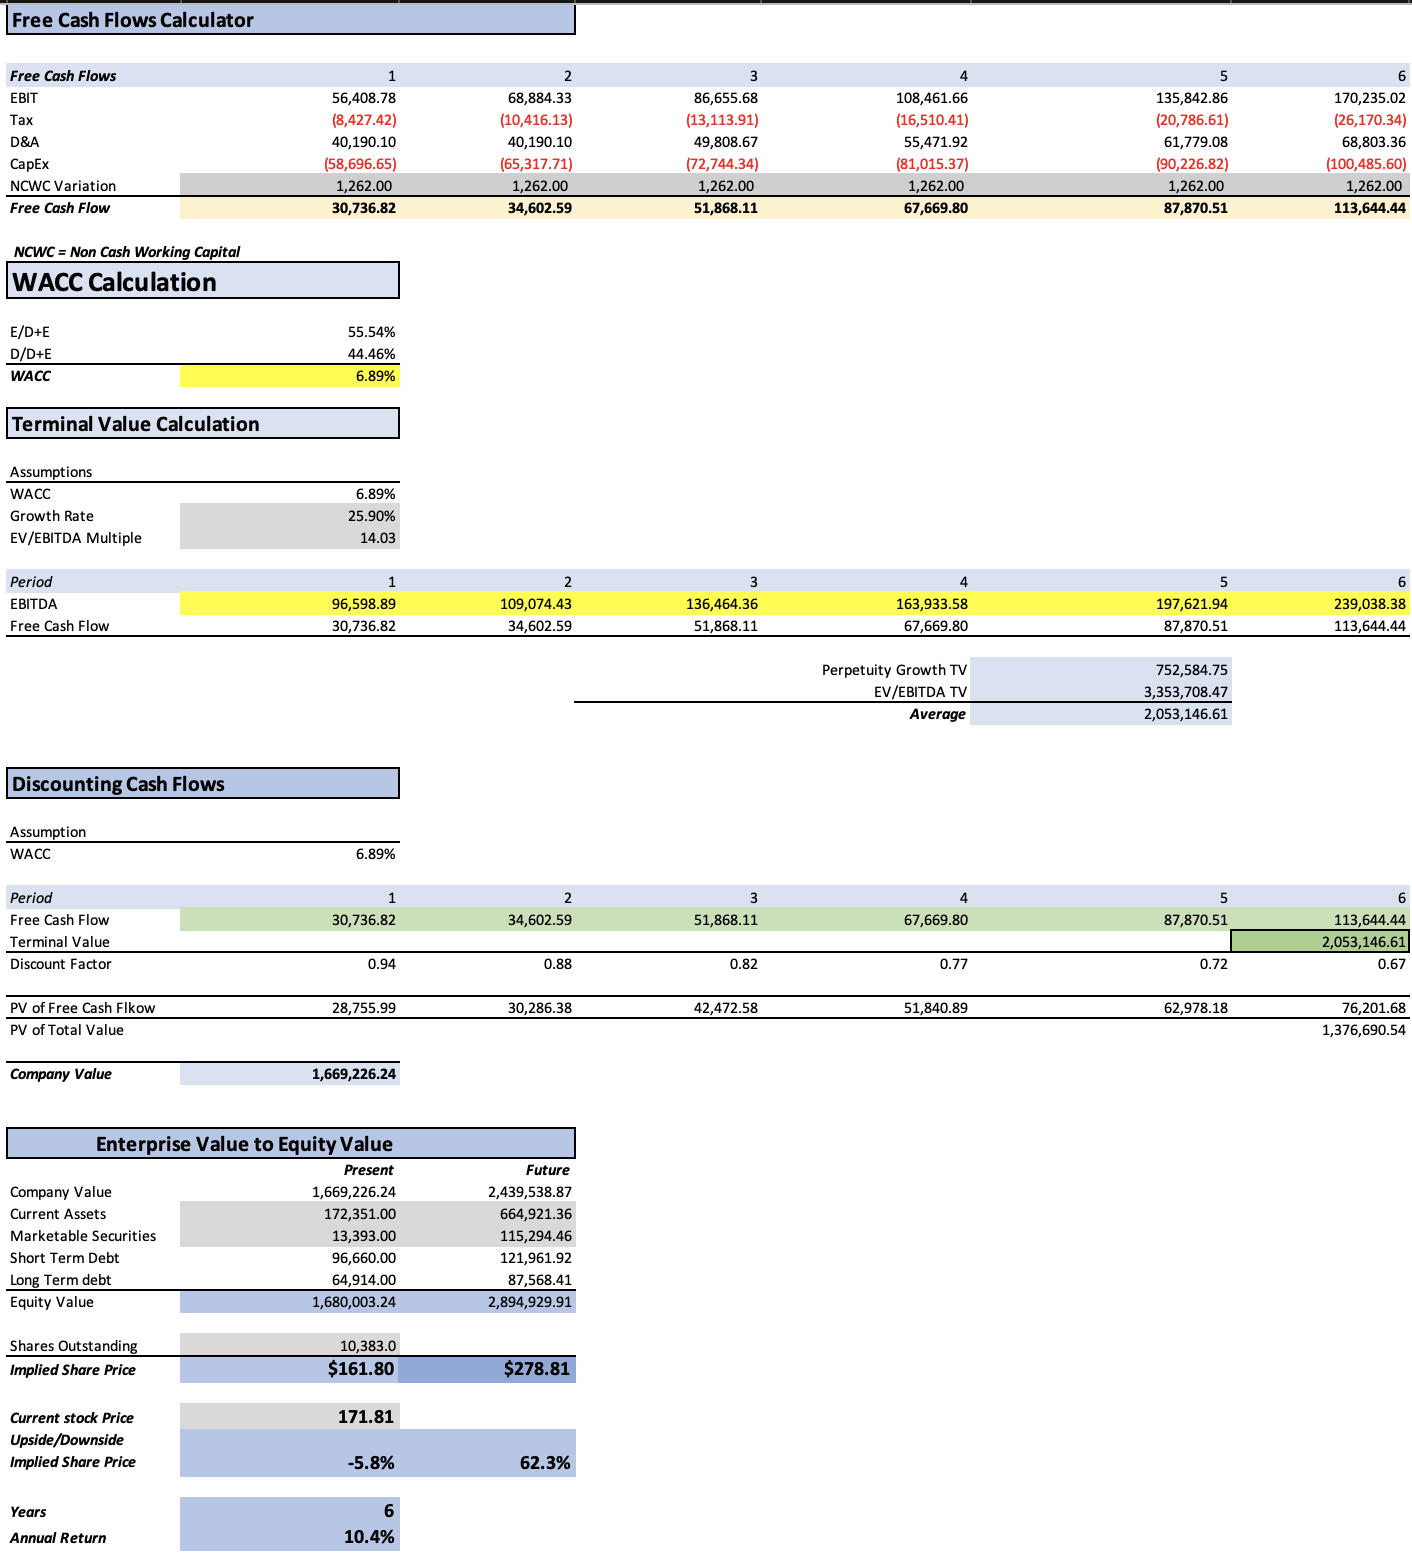
This first model suggests a fair price of $161.80, which implies a 5.8% downside from the current stock price of $171.81. The model also suggests that for 2029, the stock price should be at around $278.81, translating into a 10.4% annual return throughout 2029.
My Estimates
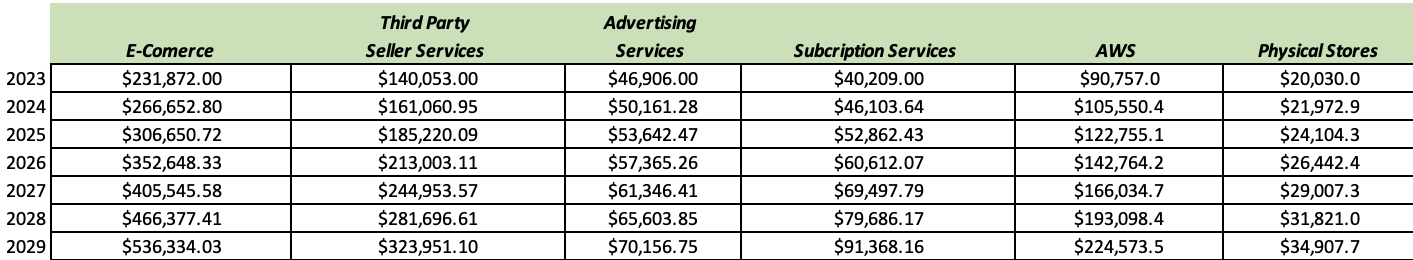
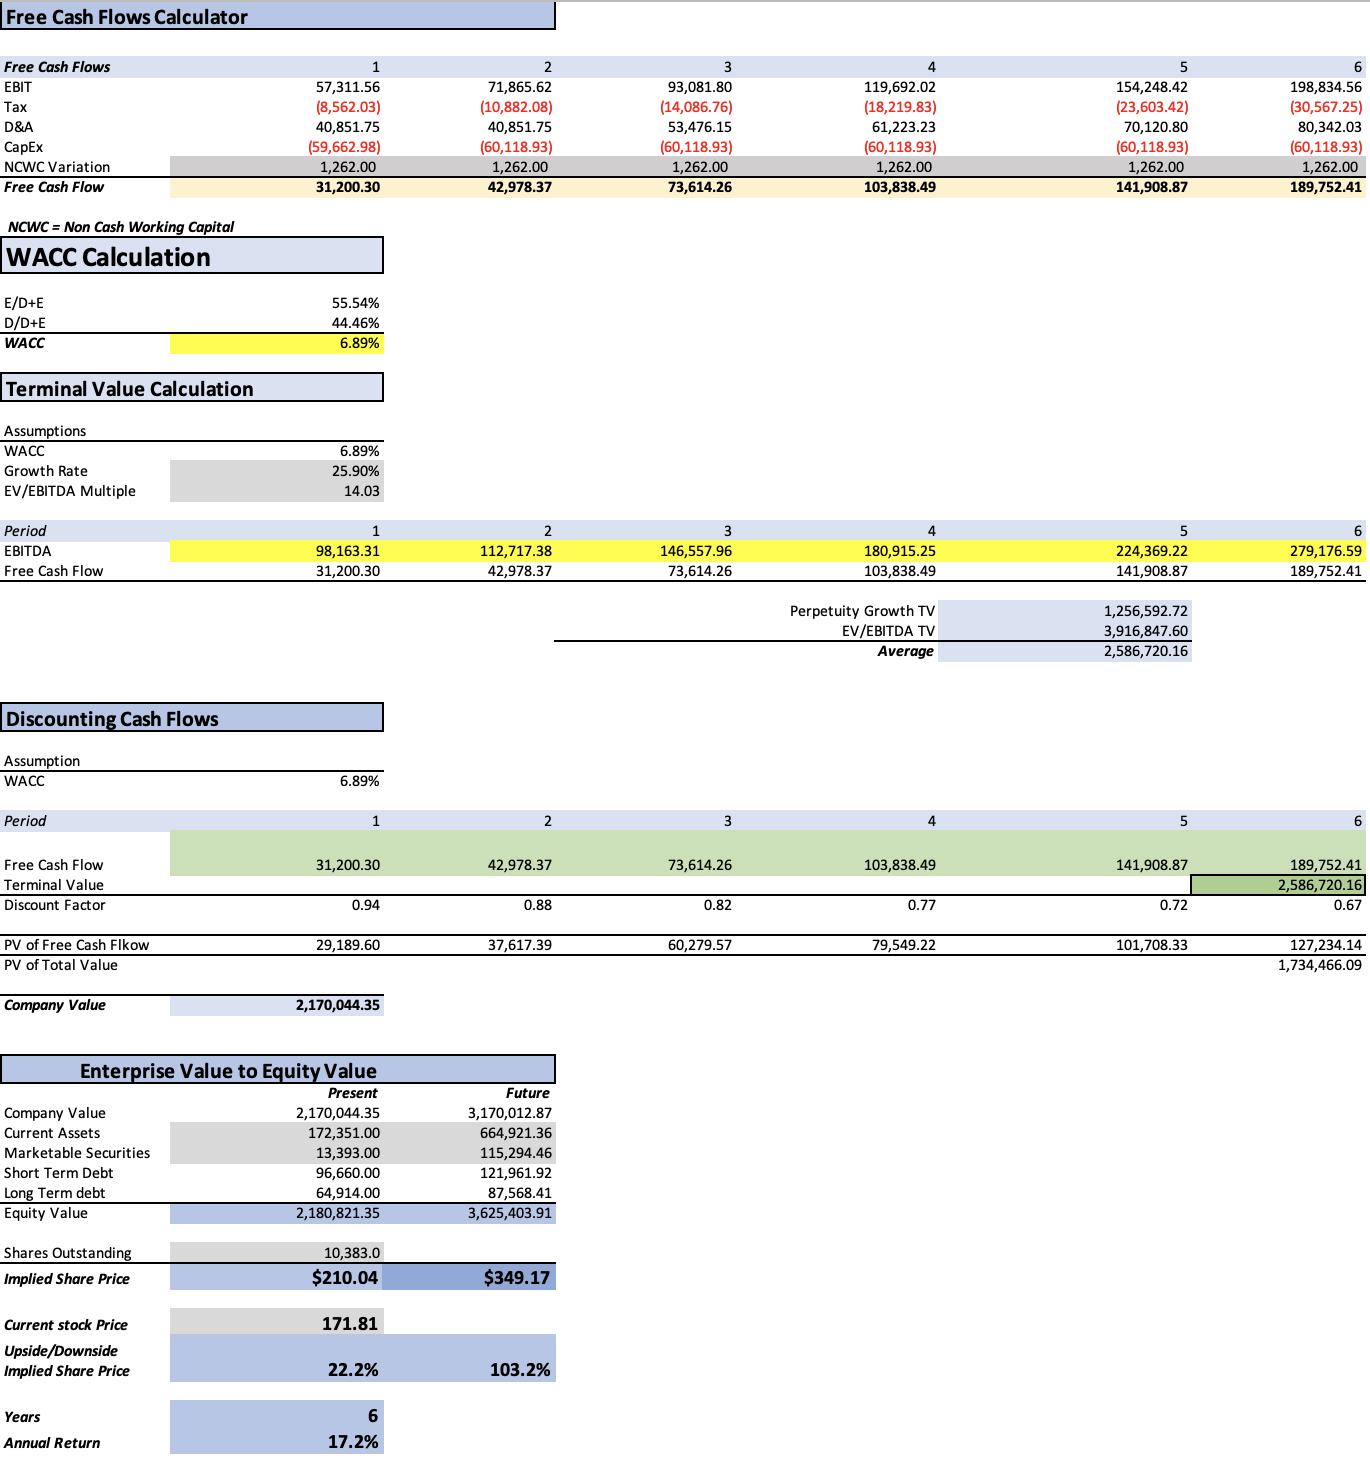
As previously said, this second model will be made by projecting each of Amazon’s segment by their respective market CAGR. That means that e-commerce and third- party seller services will grow at a rate of 15%, while advertising will grow at 6.94%, and AWS will grow at 16.3%. Meanwhile, subscription services and physical stores will grow at the growth rate displayed in the caption of Q4 2023 in the overview section, which is of 14.66% and 9.7% respectively.
Author’s Calculations
Then, the net income will be calculated with the net income margin derived from the previous model. Additionally, CapEx will remain constant at $60 billion throughout the projection.
| Net Income Margin % | |
| 2024 | 6.93% |
| 2025 | 7.70% |
| 2026 | 8.71% |
| 2027 | 9.84% |
| 2028 | 11.13% |
| 2029 | 12.58% |
| Revenue | Net Income | Plus Taxes | Plus D&A | Plus Interest | |
| 2024 | $651,502.0 | $45,149.09 | $53,711.12 | $94,562.87 | $98,163.31 |
| 2025 | $745,235.1 | $57,383.10 | $68,265.18 | $109,116.94 | $112,717.38 |
| 2026 | $852,835.3 | $74,281.96 | $88,368.72 | $141,844.88 | $146,557.96 |
| 2027 | $976,385.4 | $96,076.32 | $114,296.15 | $175,519.38 | $180,915.25 |
| 2028 | $1,118,283.5 | $124,464.95 | $148,068.37 | $218,189.17 | $224,369.22 |
| 2029 | $1,281,291.2 | $161,186.43 | $191,753.68 | $272,095.71 | $279,176.59 |
| ^Final EBITA^ |
Author’s Calculations
This last model yields a fair price of $210.04, a 22.2% upside from the current stock price. Then, the future price is projected at $349.17, which translates into 17.2% annual returns. However, this is if Amazon maintains CapEx constant at $60 billion, something that in my opinion is not probable.
Which was the problem?
The main problem seems to be that investors are overly optimistic about Amazon’s prospects by expecting that CapEx, or any other cost-cutting measures, will enhance Amazon’s ability to generate free cash flow and thereby increasing the fair price. Nevertheless, this optimism carries risk, especially if Amazon misses estimates in future earnings releases, this would lead to a decline in stock price.
Furthermore, valuing the stock with multiples does not help this time, since Amazon has a D grade in valuation. As you will observe in the table below from Seeking Alpha, most of Amazon’s multiples are above the median.
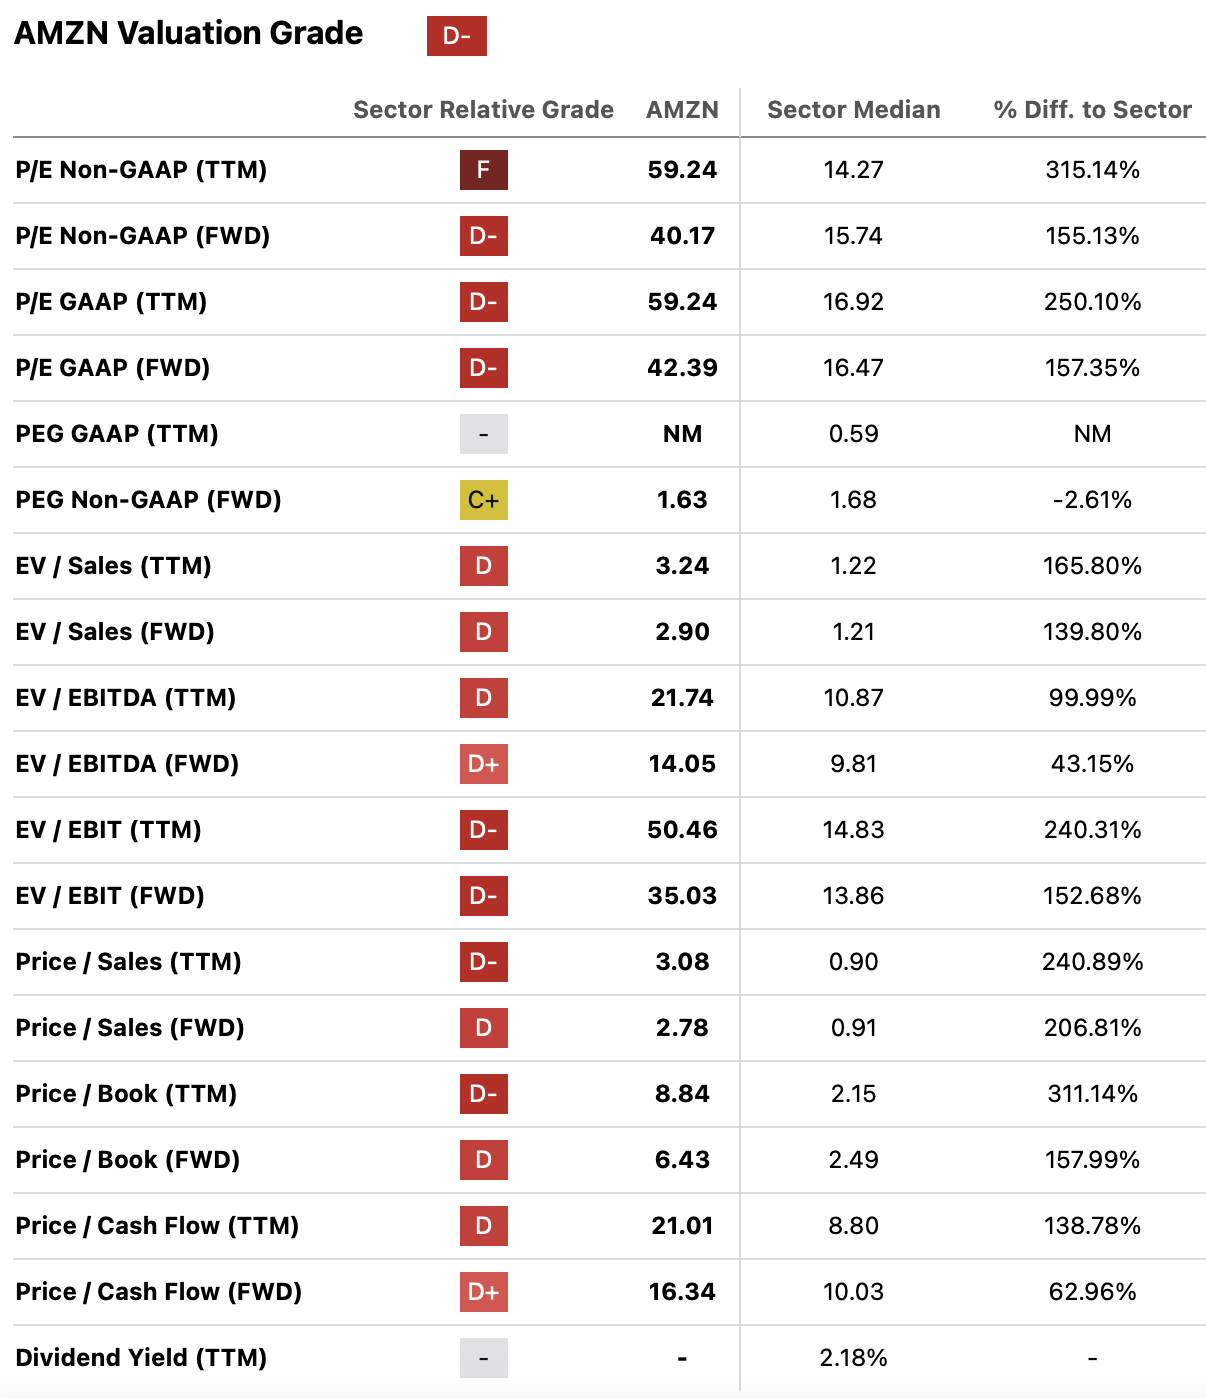
Seeking Alpha
Final target
To provide a comprehensive answer, which takes into account the possibility of unexpected events, I will be calculating an average fair price from the result of both models. The resulting fair price is $185.92, which suggests an 8.18% upside from the current stock price. The average future price comes out at $313.99, translating into annual returns of 13.93% throughout 2029.
Risks to Thesis
The primary risk to this thesis lies in the current market optimism towards Amazon’s stock, since it may continue its rally despite the first model suggesting an overvalued result.
The second risk involves the possibility of Amazon consistently beating earnings estimates throughout 2029. While this scenario would drive the stock higher and higher, multiples could adjust and catch up with Amazon’s new valuation.
Overall, I don’t see many risks associated with my thesis. I need to mention that if most of the indicators are unfavorable, I wouldn’t enter in the hope of something exceptional happening in favor of Amazon.
Conclusion
In conclusion, the valuation of Amazon reveals the complexity of factors. Despite the optimism following a stellar holiday quarter, I decided to maintain my hold rating on Amazon due to the first model yielding an unfavorable result for Amazon and the second needing substantial help to open the possibility for Amazon to offer a 22% upside potential. To offer a comprehensive result, I calculated an average fair price that came out at $185.92, and a future price of $313.99.
Analyst’s Disclosure: I/we have no stock, option or similar derivative position in any of the companies mentioned, but may initiate a beneficial Long position through a purchase of the stock, or the purchase of call options or similar derivatives in AMZN over the next 72 hours. I wrote this article myself, and it expresses my own opinions. I am not receiving compensation for it (other than from Seeking Alpha). I have no business relationship with any company whose stock is mentioned in this article.
Seeking Alpha’s Disclosure: Past performance is no guarantee of future results. No recommendation or advice is being given as to whether any investment is suitable for a particular investor. Any views or opinions expressed above may not reflect those of Seeking Alpha as a whole. Seeking Alpha is not a licensed securities dealer, broker or US investment adviser or investment bank. Our analysts are third party authors that include both professional investors and individual investors who may not be licensed or certified by any institute or regulatory body.