Summary:
- Previous valuation projected fair price at $56, now at $58.9 (+3.99%).
- PayPal’s stock declined by 7.33% since the first article, aligning with my bearish predictions.
- Q4 2023 earnings prompted two DCF models: one suggests 58% undervaluation, the other 12.4% overvaluation.
- PayPal’s estimated Q1 2024 YoY net income growth of 8.7% conflicts with the first model’s 16.22% requirement.
- Holding stance taken; target price deferred pending Q1 2023 performance assessment.
Justin Sullivan
Thesis
In my previous article about PayPal Holdings, Inc. (NASDAQ:PYPL) from November 2023, I raised concerns over the declining net income and revenue growth, and I rated the stock as a hold as well as assigning a conservative $56 target. This thesis has materialized since PayPal needed to achieve an FY net income of $5.3 billion by Q4 2023 in order to deliver a 117% upside per my models. However, this was not the case since net income stood at $4.24 billion for FY2023. Furthermore, the company issued a weaker than expected forecast for Q1 2024, reinforcing my previous thesis, indicating that this trend would be difficult to revert because of the little differentiation between fintech companies. Since then, PayPal stock has increased by 3.99%, but overall, it has decreased since my first article by 7.33%.
In this article, I will update my models with the financial information of Q4 2023 earnings released on February 7. The two DCF models yield very different results, the first one suggests that PayPal is undervalued by 58% and the second one that it’s overvalued by 12.4%. Nevertheless, for this first model to hold true, PayPal needs to grow its net income by 16.22% annually throughout 2029, and in Q4 2023 earnings, PayPal announced that they estimated that the FY2024 net income growth would fall in the single-digits to 8.7% (taking into account only Q1 2024), which is closer to the net income growth used in my second DCF model. Therefore I am rating the stock as a hold, and I am refusing to set a target since I need to see how Q1 2023 unfolds in order to see, if PayPal will grow more than the 8.48% or not.
Overview
Q4 2023 Earnings
In Q4 2023 earnings reported on February 7th, PayPal crushed estimates, however, the company issued disappointing guidance for FY2024. PayPal delivered an EPS of $1.48 vs the $1.36 expected, and generated $8.03 billion in revenue vs the $7.87 billion expected.
The company also displayed a 15% YoY growth in total volume. Regarding the disappointing outlook, PayPal issued a full-year EPS outlook of $5.10, below the $5.48 previously estimated.
Finally, what I consider an important catalyst for the stock is that they will stop issuing full-year outlook, and instead will do it on a quarterly-basis as the situation progresses. Why this is important? Because there is the possibility that if PayPal beats estimates in Q1 2024, then analysts may start speculating that the full year outlook will be increased. This raises the possibility for the stock to witness a rally if PayPal beats Q1 earnings and increases Q2 outlook, this is because analysts’ will not have any clue of what Q3 and Q4 may look like, and since what they have is a Q1 and Q2 beat, they could think that Q3 and Q4 may come in-line with their estimates.
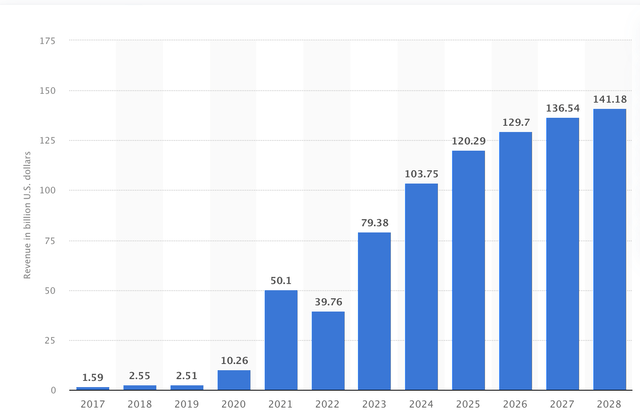
Lastly, the worldwide fintech market revenue is expected to grow at a CAGR of 15.72% throughout 2028. However, the growth is expected to slow down as years pass.
Statista
Financials
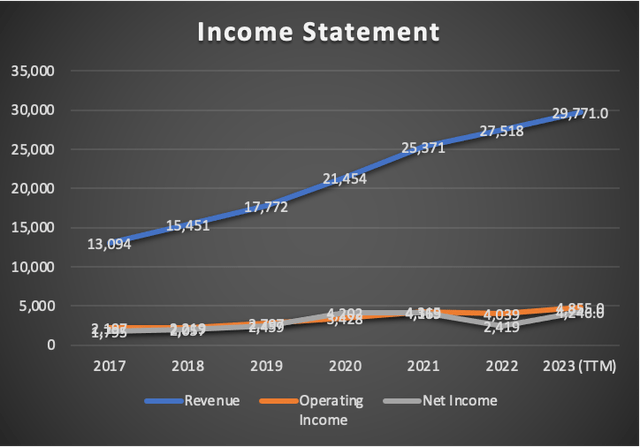
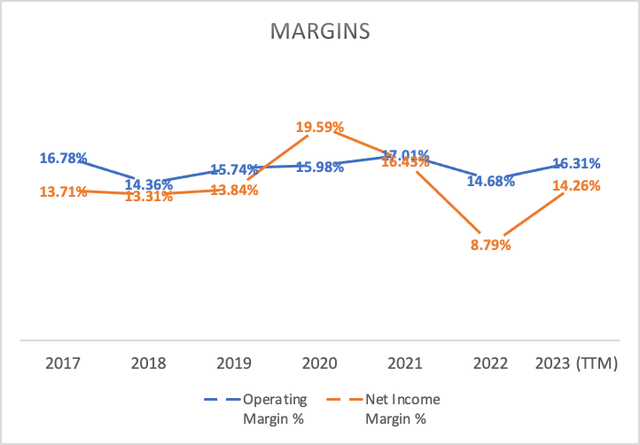
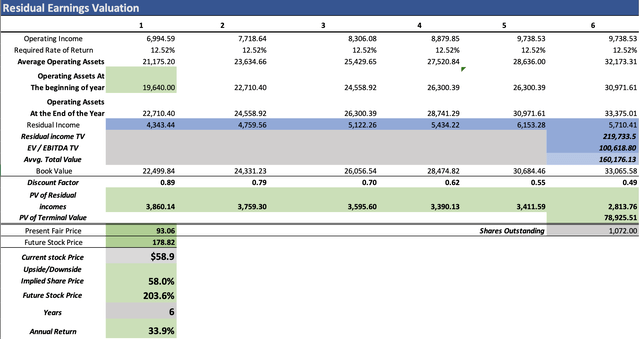
Currently, the slow growth trend for PayPal continues. Revenue since 2021 has been increasing by 8.83% annually and net income by 0.92% annually, and according to the models you will see in the valuation section, PayPal needs to grow its revenue by 9.5% and net income by 16.22% annually in order to offer a 58% upside and 33.9% annual returns throughout 2029 based on these models.
Author’s Calculations
Author’s Calculations
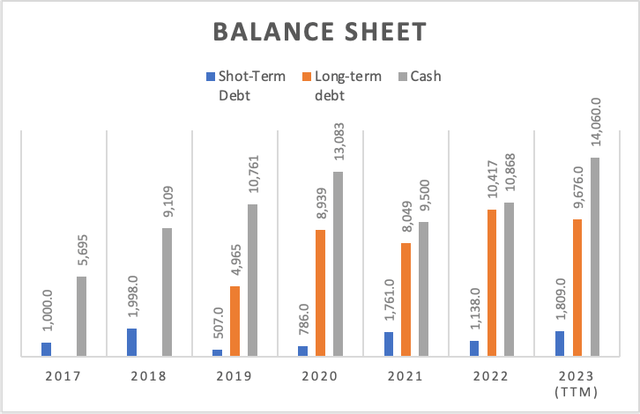
Nevertheless, PayPal’s balance sheet has improved, and its cash reserves grew from $11.5 to $14 billion. Meanwhile, long-term debt decreased from $10.6 to $9.67 billion. However, this is mostly due to debt maturity payments, since short-term debt increased from $0 to $1.8 billion. These events display that PayPal is still a very well-managed company.
Author’s Calculations
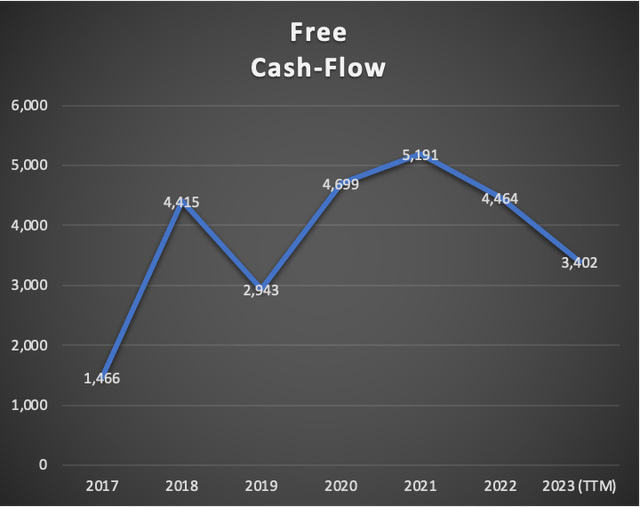
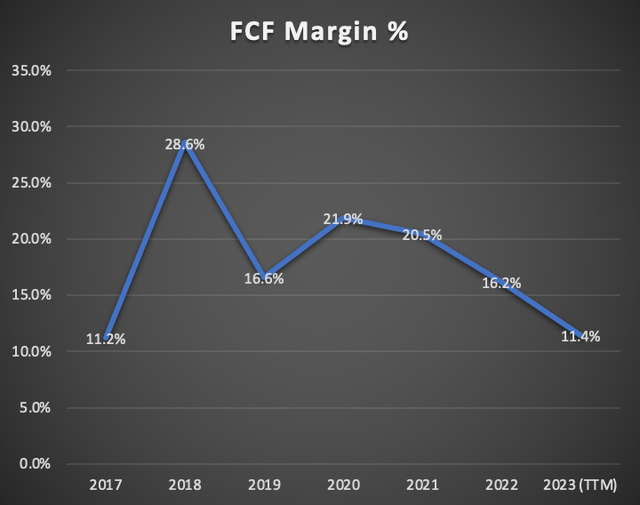
Finally, we can witness PayPal’s FCF has improved by 34.7%, and now stands at $3.4 billion. This has reflected in the FCF margin which passed from 8.7% in Q3 2023, to 11.4% in Q4 2023. The main driver of this growth in FCF is the increase in cash from operations which passed from $3.8 to 4.8 billion.
However, the overall trend has been in a downward, and since 2021, FCF has decreased by 17.2% annually, and the previously mentioned 34.7% improvement in FCF hasn’t been able to revert that trend.
Author’s Calculations
Author’s Calculations
Overall, there have been improvements in this quarter, nevertheless, PayPal presents a downward trend in the very important metric of free cash flow, as well as in net and operating income margins. Meanwhile, the income statement displays slowing growth in revenue, operating income and net income, which needs to be reverted in order for my hold rating to be converted into a buy.
Valuation
In this article, I will make two residual earnings model, the first one will be based on analysts’ estimates and the second one will basically be a stress-test for PayPal’s stock, because I will make net income grow by 8.48% and revenue by 15.72%, in-line with the estimated CAGR of the worldwide fintech market.
The discount rate in the model will be done by a required rate of return calculated through a CAPM model.
| TABLE OF ASSUMPTIONS | |
| (Current data) | |
| Equity Value | 21,051.00 |
| Debt Value | 11,485.00 |
| Cost of Debt | 3.02% |
| Tax Rate | 27.44% |
| 10y Treassury | 4.177% |
| Beta | 1.33 |
| Market Return | 10.50% |
| Cost of Equity | 12.59% |
| Net Income | 4,246.00 |
| Interest | 347.00 |
| Tax | 1,165.00 |
| D&A | 590.00 |
| Ebitda | 6,348.00 |
| D&A Margin | 1.98% |
| Interest Expense Margin | 1.17% |
| Revenue | 29,771.0 |
| CAPM | |
| Risk Free Rate | 4.18% |
| Beta | 1.33 |
| Market Risk Premium | 6.273% |
| Required Rate of Return | 12.520% |
In order to calculate net operating assets, I will use the following two formulas. The first step would be to calculate operating assets, and to do that I will subtract cash reserves from total assets, since cash reserves are a product of the commissions PayPal charges on customer’s transactions, therefore it’s a product of operations. Then after making that subtraction, I will subtract operating liabilities, which in this case will be current liabilities since those include any balance that customers have in their PayPal wallets. This calculation yields a result of $19.64 billion.

Wall Street Prep

Wall Street Prep
Finally, that result will be tied to revenue via a margin, so every time revenue decreases or increases, net operating assets will follow suit. Then it’s book value which will also be tied to revenue via margin.
| Operating Assets | 19,640.0 |
| Book value | 21,051.0 |
| Operating Assets / Revenue | 71.37% |
| Book Value / Revenue | 70.71% |
Analysts’ Estimates
In this first model I will calculate PayPal’s present fair price and future price based on analysts’ estimates. This it to use it as a benchmark to see how the other models I will conduct are in comparison with analysts’ estimates
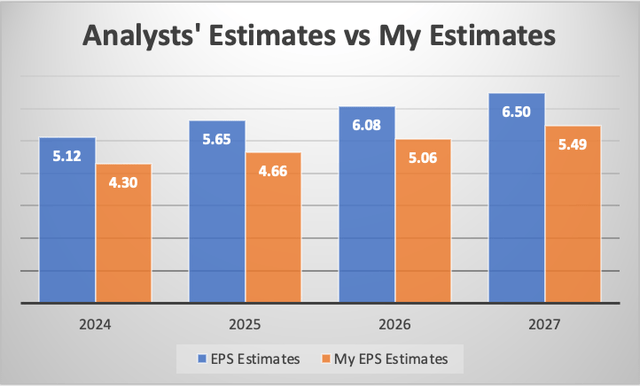
The first estimates is EPS, and as you can see on the chart below, EPS is expected to grow in the single-digits with the only exception of 2025. In the model I will obtain net income by multiplying the EPS by the total number of shares outstanding (which you can see in the model), and then I will sum taxes in order to obtain the operating income. Then, it’s revenue, which is expected to also grow at the singe-digits.

Seeking Alpha

Seeking Alpha
Finally, in order to calculate revenue and net income beyond 2027, I will be using the forward revenue growth of 7.76%, and the 3-5y long-term EPS growth rate of 9.67%. Both figures are available at Seeking Alpha. As you can see in the table below, the average net income growth rate is 16.22% when you start by FY2023 net income of $4.24 billion, which is already slightly more than the estimated CAGR of the Worldwide Fintech Market of 15.72%.
| Revenue | Net Income | Tax | Operating Income | Plus D&A | Plus Interest | |
| 2024 | $31,820.0 | 5,488.64 | 1,505.95 | $6,994.6 | $7,625.20 | $7,996.08 |
| 2025 | $34,410.0 | 6,056.80 | 1,661.84 | $7,718.6 | $8,400.58 | $8,801.65 |
| 2026 | $36,850.0 | 6,517.76 | 1,788.32 | $8,306.1 | $9,036.37 | $9,465.88 |
| 2027 | $40,270.0 | 6,968.00 | 1,911.85 | $8,879.9 | $9,677.92 | $10,147.29 |
| 2028 | $43,395.0 | 7,641.81 | 2,096.73 | $9,738.5 | $10,598.53 | $11,104.33 |
| 2029 | $46,762.4 | 8,380.77 | 2,299.48 | $10,680.2 | $11,606.98 | $12,152.03 |
| ^Final EBITA^ |
Author’s Calculations
As you can see, available analysts’ estimates suggest that the stock’s fair price is $93.06, which is a 58% upside from the current stock price. Then, the future price of the stock in 2029 is suggested to be $178.82. This future price was calculated by taking the residual incomes previous to the discounting process.
8.48% Net Income and 15.72% revenue growth
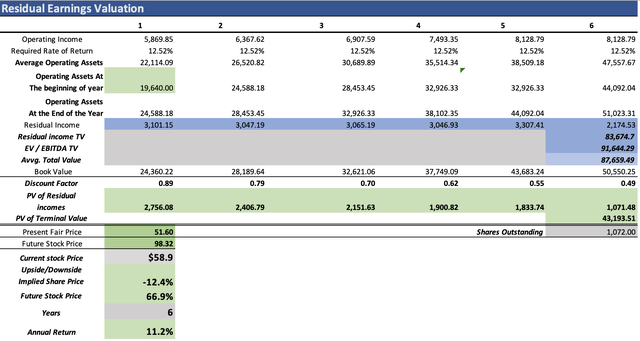
This second model will be made with the assumption that PayPal’s net income will grow at an 8.48% rate starting from FY 2023 net income of $4.24 billion. As you can see, the projected net incomes are considerably lower. In the bar graph, you will be able to see how the EPS targets differ from those of the available estimates.
| Revenue | Net Income | Tax | Operating Income | Plus D&A | Plus Interest | |
| 2024 | $34,451.0 | 4,606.06 | 1,263.79 | $5,869.9 | $6,552.60 | $6,954.15 |
| 2025 | $39,866.7 | 4,996.65 | 1,370.96 | $6,367.6 | $7,157.69 | $7,622.36 |
| 2026 | $46,133.7 | 5,420.37 | 1,487.22 | $6,907.6 | $7,821.87 | $8,359.58 |
| 2027 | $53,386.0 | 5,880.02 | 1,613.34 | $7,493.4 | $8,551.35 | $9,173.60 |
| 2028 | $61,778.2 | 6,378.64 | 1,750.15 | $8,128.8 | $9,353.11 | $10,073.17 |
| 2029 | $71,489.8 | 6,919.55 | 1,898.56 | $8,818.1 | $10,234.89 | $11,068.15 |
| ^Final EBITA^ |
Author’s Calculations
Author’s Calculations
This model suggests that PayPal is overvalued by around 12.4%, suggesting that the fair price is $51.60. The future price suggested is $98.32, implying 11.2% annual returns throughout 2029.
Why are these results important?
The two models display very different results. One implies that PayPal is 58% undervalued and the other suggests that PayPal is 12.4% overvalued. However, PayPal continues to incline more to the bearish side, since the first model implies that net income growth needs to be maintained at 16.22% which is already far from the EPS growth estimated by PayPal for FY2024 which will be in the mid-single digits, lower than the 8.7% previously estimated by analysts, and therefore, lower than the 8.48% net income growth rate I used in that second model.
Furthermore, the revenue growth used, 15.72%, Is far higher than the one that PayPal has registered since 2021 which, as previously said, is around 8.83% annually. All of this continues to suggest that PayPal will not see that 415% shape recovery Meta Platforms, Inc. (META) saw after it touched bottom at $90.79. Even if PayPal achieves those optimistic estimates, the upside seems a mere 58%, which is high by itself, but not higher than that 415% recovery. Therefore, a Meta-style recovery is off the table, and I deem it as highly improbable.
For Q1 2024 earnings release I think that the most important things to monitor are net income and revenue. Revenue needs to approach to $31.8 billion and net income to $5.48 billion, as indicated in the first model. However, the company issued a lower forecast. For this reason, I will reiterate my hold rating on PayPal and I am not going to issue any target price since the two directions that the company can take are very different.
Risks
PayPal’s risk is that the fintech market is light on capital. I does not involves big investments in order to start a fintech company. This has caused that there are many fintech companies. PayPal’s moat is that it was the first and therefore it has grown to be the biggest. I will continue to say this because as you could have seen in the analysts’ revenue estimates, the expected growth rates are very low, this means that PayPal’s stock performance is hanging on cost cuts. Which is probably why the company announced in January that they will lay off 2,500 of its global workforce.
The only risk to my thesis is PayPal accomplishing that 16.22% net income growth, however, as previously said, there isn’t too much differentiation between fintech companies, and the only moat that PayPal has is that it’s the biggest. PayPal can release a wallet, but probably people will prefer Apple, Inc.’s (AAPL) Apple Wallet, they can release a crypto broker but they will need to compete with Interactive Brokers Group (IBKR) or any other retail broker. All of these operations, involve very little differentiation between competitors.
Conclusion
In conclusion, PayPal would need to grow its net income by 16.22% annually which is more than the FY2024 estimate of 8.7% (which only takes into account Q1 2024), which is already partially voiding the first scenario. Furthermore, analysts’ estimates on revenue and net income growth are already in the single digits, therefore, the growth PayPal still has is through cost cuts. Because of this, I am maintaining my rating on PayPal at hold, however, I wouldn’t assign a target since I need to see what happens in Q1 2024 to see which of the two very different directions PayPal is most likely to take, the first scenario or the second scenario.
Analyst’s Disclosure: I/we have no stock, option or similar derivative position in any of the companies mentioned, but may initiate a beneficial Long position through a purchase of the stock, or the purchase of call options or similar derivatives in PYPL over the next 72 hours. I wrote this article myself, and it expresses my own opinions. I am not receiving compensation for it (other than from Seeking Alpha). I have no business relationship with any company whose stock is mentioned in this article.
Seeking Alpha’s Disclosure: Past performance is no guarantee of future results. No recommendation or advice is being given as to whether any investment is suitable for a particular investor. Any views or opinions expressed above may not reflect those of Seeking Alpha as a whole. Seeking Alpha is not a licensed securities dealer, broker or US investment adviser or investment bank. Our analysts are third party authors that include both professional investors and individual investors who may not be licensed or certified by any institute or regulatory body.
