Summary:
- Exxon Mobil reported strong Q4 and 2023 performance with FY23 earnings of $36bn and operating cash at $55bn at ~40% and ~15% respective CAGRs vs. 2019 baseline.
- Despite margins coming down from recent heights on lower oil prices and refining margins, capital efficiency continues to significantly exceed pre-2019 regression levels and peers.
- Following a 91% FCF payout ratio in FY23, management announced a further $40bn in buybacks through YE25, potentially eliminating any dilutive effects from the Pioneer deal by 2026.
- Incorporating Pioneer’s contribution and merger synergies in my valuation, I raise my price target for the consolidated entity by 15% to $158, implying a ~56% upside to current levels.
grandriver
I began coverage of Exxon Mobil Corp (NYSE:XOM) in October 2023, highlighting it as my favorite play in the international oil patch given its superior execution and management along with a favorable geographic footprint vs. peers. Following the company’s announcement to take over Permian E&P Pioneer Resources (PXD) in late November, I published a further note, commenting and offering my thoughts on what I deem to be a perfect strategic fit to XOM’s mid-term strategy of shifting its portfolio towards higher security and shorter cycle domestic US-produced barrels. In this note, I will provide an update on key themes presented in those initial notes and update my valuation to incorporate Pioneer’s contribution with the acquisition expected to close in Q2 2024.
[Note: Peers refer to Chevron (CVX), Shell (SHEL), BP (BP) and TotalEnergies (TTE)]
2023 Review
Issued on February 2, Exxon’s Q4 and FY23 earnings release revealed continued strong execution even as crude traded significantly below recent heights for the majority of the year. Total annual earnings amounted to $36bn, representing >40% annual growth vs. a 2019 baseline, with operating cash at $55bn for a >15% CAGR vs. 2019.
Capital Efficiency
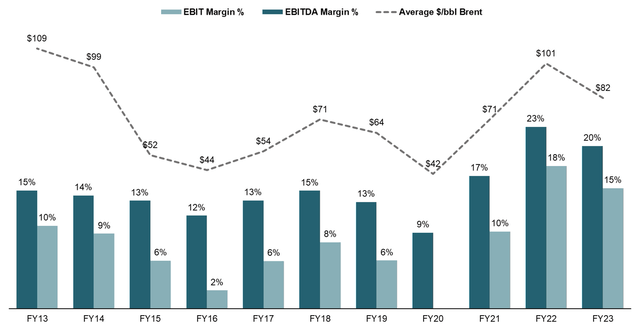
EBITDA and EBIT margins for 2023 stood at 20% and 15% which, while down from FY22, significantly exceeded realized margins in prior periods with comparable oil price environments (FY23 average $/bbl Brent of $82).
As discussed in prior notes, the majority of this margin expansion can be attributed to management’s significant efficiency programs which as of FY23 achieved total structural cost savings of ~$10bn, mainly in the form of strategic headcount reductions and portfolio rationalization across up- and downstream.
On the back of higher margins and stable levels of employed capital (defined by the company as Total Assets less Total Liabilities ex Debt), XOM also continued its trajectory of delivering significantly higher returns on capital compared to previous periods. While total FY23 ROCE (Return on Capital Employed) of 15% was below previous LTM periods (LTM Q3 23 / Q2 23 ROCE of ~16%/~22%), it continues to score more than 25% above previous-period implied ROCEs as measured by a regression approach.
I do note that those premia (for a closer description of the concept I employed, please see my initiation note) have come down from FY22 and the LTM period as of Q1 23 where actual ROCEs were 86% and 67% higher than predicted. However, as those periods had extraordinarily high $/bbl environments on the backdrop of the Ukraine war, I believe current results are more reflective of normalized midcycle oil price environments while still highlighting the significant expansion in capital efficiency as opposed to the pre-2019 period.
XOM Returns on Capital Employed (Company Filings)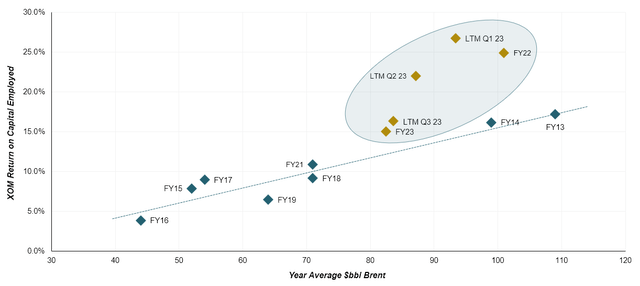
ROCE also continues to exceed peers, generating on average ~11%, giving XOM almost a 40% premium in capital efficiency against peers.
XOM FY23 ROCE vs Peers (Company Filings)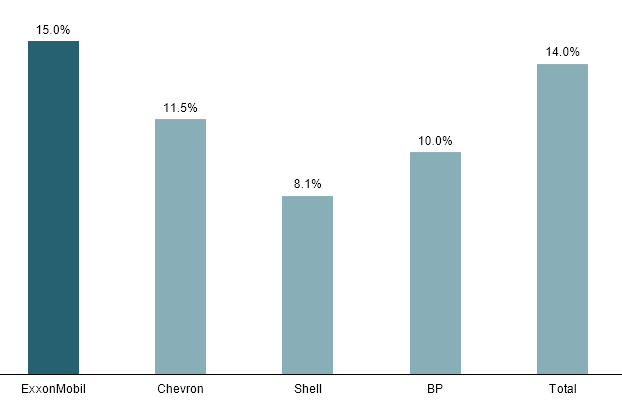
Downstream Segment
Exxon’s downstream segment, which I previously highlighted as a key competitive advantage to peers due to its ability to (at least partially) offset the total earnings impact of oil price declines as earnings gains from lower feedstock prices balance out lower upstream profits. As of 9M 2023, profits from downstream (Energy Products, Chemical Products, Specialty Products) contributed ~42% of XOM’s total earnings, giving it a significantly higher weight compared to peers with on average ~26% of earnings from downstream.
Overall 9M 2023 earnings from downstream operations were down by ~23% to $12.3bn on the back of relatively stable volumes and normalizing refining margins which had extraordinarily benefitted the segment in 2022. Energy Products (petroleum refining) throughput was up by 2.1% to ~5.5 mboed amid record high operating reliability and a 250kboed capacity expansion in its Baytown, Texas refinery offsetting further underperforming complex divestments. Chemical Products (commodity petrochemicals) volumes were also up by 1.1% while volumes in the Specialty Chemicals business decreased by 2.7% driven by lower economic activity, especially in manufacturing.
Despite the decline in earnings and margins falling by ~60bps to 5.2%, Exxon’s downstream operations continue to lead peers in both scale and profitability while management’s efforts to streamline the refinery and petchem plant footprint caused margins to contract significantly less than peers (average negative ~82bps).
Downstream Performance XOM vs Peers (Company Filings)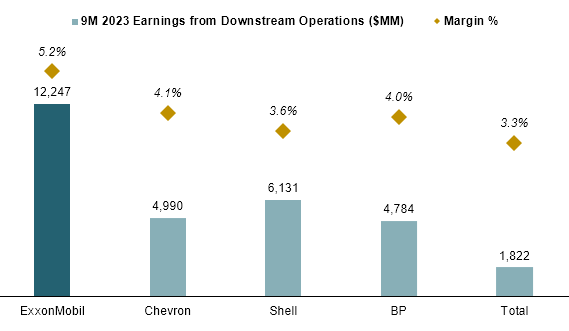
Balance Sheet and Shareholder Returns
During FY23, Exxon further strengthened its balance sheet, lowering its net debt position to ~$10bn on higher cash and continued Covid-era debt paydown.
XOM Net Debt (Company Filings)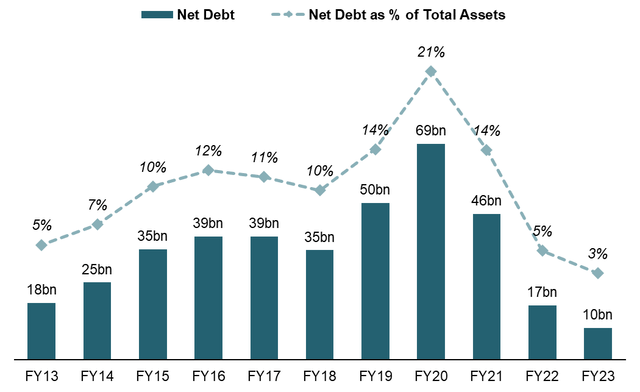
As of YE23 net debt stood at ~2.7% of total assets, down from ~4.7% at YE22, giving XOM the lowest leverage in the peer group with CVX, SHEL and BP actually increasing leverages, mainly driven by lower cash balances.
Net Debt as % of Balance Sheet (Company Filings)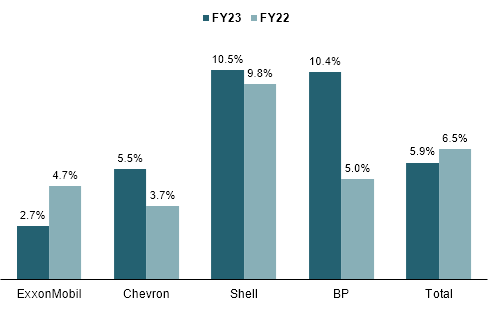
Paying a total of $15bn in common stock dividends and repurchasing $17.5bn worth of shares (~4.3% of current cap) during FY23, Exxon allocated 91% of total FCF ($36.1bn) towards shareholders, behind CVX at 128% but significantly ahead of European peers at ~75%. While XOM notably trails its key US rival in shareholder distributions, I do like management’s slightly more conservative approach in the matter, instead aiming to further improve its balance sheet as opposed to funding additional payouts with new debt/existing cash.
Shareholder Returns as % of FCF (Company Filings)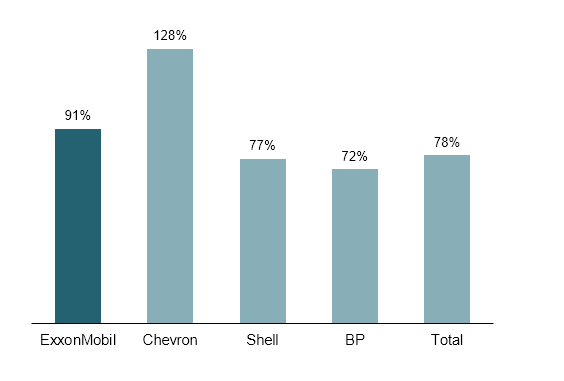
Management also updated its cash return framework, now aiming to allocate a further total of $40bn to buybacks through YE25, partially aimed at offsetting dilutive effects from the Pioneer deal which isexpectedto add ~543MM shares to bring the post-deal share count to ~4.5bn. Assuming a stable share price, I estimate this buyback program to return Exxon’s share count towards and exceeding current levels of 3.97bn by YE26, potentially further lowering the count to ~3.7bn by YE27. With any dilutive impact of the deal, therefore, fading by FY26, shareholders essentially receive Pioneer’s significant cash flows (estimated at ~$10bn p.a.) and merger synergies ($1bn by FY25 rising to $2bn p.a. by the end of the decade) for free.
XOM Buyback Potential (Company Filings)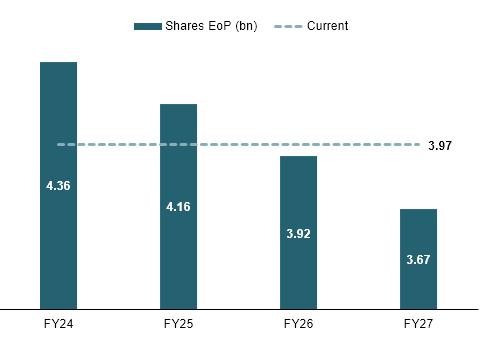
Production Update
Average daily oil-equivalent production as measured in kboed for FY23 stood at 3,738 which was flat vs. FY22 as a strong Q4 (3,824kboed) was offset by maintenance projects in H1. Notably, oil production in the Permian and Guyana (along with LNG and Brazil, designated as management’s key growth areas) rose by 18% YoY with Guyana reaching a record quarterly gross production of ~440 kboed as the Payara development in the Stabroek block came online ahead of schedule.
Incorporating Pioneer into my production forecast, I estimate Pro-Forma oil & gas production in oil-equivalent units to rise to ~5.3mboed by FY27 at a 9.3% annual growth rate with Pioneer expected to contribute a total of 900kboed, rising from 710kboed as of FY23. As discussed during my note on the proposed acquisition, I estimate this to increase Pro-Forma Permian production to ~2mboed, representing a ~38% share of total as opposed to ~25% on an Exxon standalone basis. The production share of key growth areas will also rise to 67% over the period, compared to 37% as of FY23, as Guyana production is projected to increase to ~1.2mboed by FY27.
Pro-Forma Production Forecast (Company Filings and Author’s Estimates)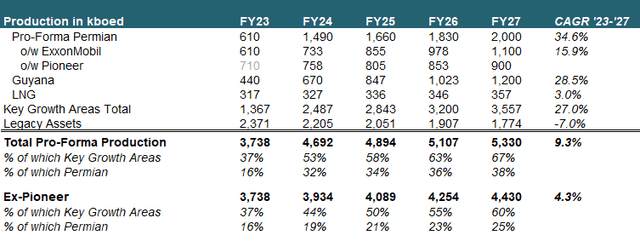
The deal will also make the consolidated entity the undisputed leader in the Permian at ~1.4mboed current production. Notably, since my last note Diamondback Energy (FANG) announced its intention to acquire private driller Endeavor Resources, making it the second-largest producer behind Exxon/Pioneer and ahead of EOG (EOG), ConocoPhillips (COP) and Occidental (OXY).
FY23 Permian Top Producers (Company Filings, Enverus)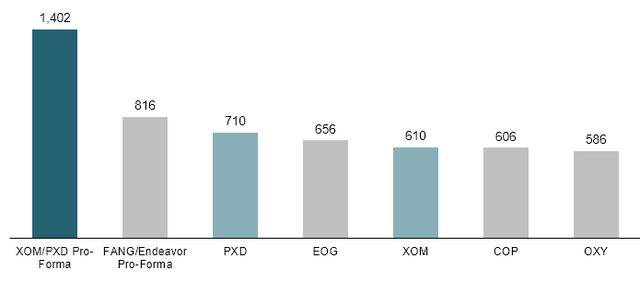
Valuation Update
I initially valued XOM based on a 5Y-DCF with an infinite growth assumption of -2% to reflect the (slower than previously expected but certain) secular decline of the industry. However, here I want to introduce an updated framework, extending the projection period to 10 years and instead using an exit multiple on FY33 estimated FCF to better reflect the company’s terminal value.
Keeping my assumptions for oil prices at a reasonable $75/bbl Brent level, I adjust breakeven price projections in line with Exxon’s latest corporate plan as of December 2023, now calling for $35/bbl to be reached by FY27 as opposed to the previously targeted $30/bbl. I also incorporate Pioneer’s expected cash flows, which I estimate at $10bn p.a. by FY27 (consistent with a regression of CFO to Brent $/bbl for previous 12-month periods over the past 2 years) and expected merger synergies as lined out in my note on the deal. Capex is also adjusted upwards to reflect ~$4bn of annual Capex from Pioneer and a slight increase in Exxon’s projected Capex levels.
Using an unchanged cost of equity of 10% and an exit multiple of 7.0x Price/FCF (slightly below XOM L5Y average of ~8.4x), I calculate a total Equity Value of $722bn. Assuming a post-close share count of 4.56bn (3.97bn current and 0.59bn in additional shares to be issued) I derive a fair value per share of $158 for the consolidated entity, up 15% vs. my previous price target and implying 56% upside to current trading levels.
XOM DCF Analysis (Company Filings and Author’s Estimates)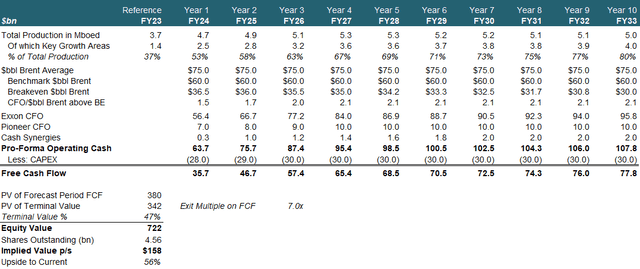
Analyst’s Disclosure: I/we have a beneficial long position in the shares of XOM either through stock ownership, options, or other derivatives. I wrote this article myself, and it expresses my own opinions. I am not receiving compensation for it (other than from Seeking Alpha). I have no business relationship with any company whose stock is mentioned in this article.
Seeking Alpha’s Disclosure: Past performance is no guarantee of future results. No recommendation or advice is being given as to whether any investment is suitable for a particular investor. Any views or opinions expressed above may not reflect those of Seeking Alpha as a whole. Seeking Alpha is not a licensed securities dealer, broker or US investment adviser or investment bank. Our analysts are third party authors that include both professional investors and individual investors who may not be licensed or certified by any institute or regulatory body.

