Summary:
- T’s FY2024 guidance has been misunderstood, since the net effect remains positive, with growing Free Cash Flow generation and safe dividend investment thesis.
- The same has been observed in its expanding adj EBITDA margins and FCF margins over pre-pandemic averages, exemplifying its ability to achieve the net debt-to-adjusted EBITDA ratio target of 2.5x.
- Much of the tailwind is attributed to T’s sticky consumer base and growing ARPUs, despite the recent price hikes and intensifying market competition.
- Combined with the stable debt situation, supposed Fed pivot from H1’24, and the stock’s recent pullback, we believe that the stock looks attractive for those looking to buy the dip.
Klaus Vedfelt
We previously covered AT&T (NYSE:T) in October 2023, discussing the excellent bullish support at the $13s/ $14s, significantly aided by the moderately raised FY2023 FCF guidance and the projected moderation in its capital investments moving forward.
With its dividend investment thesis remaining robust, we had rated the stock as a Buy for income-oriented investors looking to buy and drip indefinitely.
In this article, we are maintaining our previous Buy rating, attributed to the market’s over-reaction to the T management’s FY2024 guidance, with the recent pullback offering interested investors with the expanded forward dividend yields.
Combined with the telecom’s growing user base and ARPUs, we believe that the stock looks attractive for those looking to buy the dip.
The T Investment Thesis Remains Attractive, Further Aided By The Recent Pullback
For now, T reports a bottom line miss in its FQ4’23 earnings call, with revenues of $32.02B (+5.5% QoQ/ +2.2% YoY) and adj EPS of $0.54 (-15.6% QoQ/ -11.4% YoY).
However, we are not overly concerned, since its two most important metrics, the adj EBITDA of $10.55B (-5.8% QoQ/ +3.1% YoY) and the Free Cash Flow generation of $6.4B (+23% QoQ/ +4.9% YoY) already exceed expectations.
Readers must also note that T’s FY2023 adj EBITDA generation of $43.4B (+4.6% YoY)/ EBITDA margins of 35.4% (+1.1 points YoY) and Free Cash Flow of $16.8B (+19.1% YoY)/ FCF margins of 13.6% (+2 points YoY) exceed the management’s original guidance of $42.7B (+2.9% YoY)/ $16B (+13.4% YoY), respectively.
These profit margins also exceed the pre-pandemic averages of 32.5% and 12.6%, respectively, implying the sustained improvement in the telecom’s bottom-line performance.
These numbers suggest that T’s net debt-to-adjusted-EBITDA ratio target of 2.5x by H1’25 is not overly ambitious indeed, with FQ4’23 already bringing forth moderated ratio of 2.97x, compared to FQ4’22 ratio of 3.19x and FQ4’19 ratio of 2.5x.
Much of the tailwinds are attributed to the telecom’s growing Fiber Subscribers to 8.3M (+0.3M QoQ/ +1.1M YoY) and ARPU to $68.50 (+0.4% QoQ/ +5.6% YoY) by the latest quarter.
The same is also observed in T’s expanding Postpaid Phone Subscribers to 71.3M (+0.5M QoQ/ +1.7M YoY) and ARPU to $56.23 (+0.4% QoQ/ +1.4% YoY), thanks to previous price hikes here and here, with the management also announcing a further mobile plan price hike by +99 cents per line per month from March 2024 onwards.
These developments imply that telecom may very well continue reporting expanding top lines and EBITDA margins ahead.
Unfortunately, these promising developments have been marred by the market’s over-reaction to T’s FY2024 guidance, with capital investment of $21.5B (-8.8% YoY) and adj EPS of $2.20 at the midpoint (-8.7% YoY).
Readers must note that the telecom’s definition of capital investment includes capital expenditures and cash payments for vendor financing, with FY2023 already recording a moderate reduction in the overall capital investment sum to $23.6B (-2.8% YoY).
In addition, if we are to focus only on the direct comparable, it is apparent that T has been consistently moderating its FY2023 capex to $17.9B (-9% YoY).
Most importantly, the management has already commented that its “capital investment continues to move in a favorable direction, as vendor financing obligations decline and project capital spend increases.”
This implies that the net effect may remain positive moving forward, further aided by the robust FY2023 net cash provided by operating activities from continuing operations of $38.31B (+6.9% YoY).
As a result, we believe that the market has over-reacted, especially since T’s FY2024 Free Cash Flow guidance of $17.5B (+4.1% YoY) remains excellent, exemplifying the telecom’s expanding profitability and ability to pay down its debt/ dividend obligations ahead.
If anything, the impacted adj EPS on a YoY basis is also mostly attributed to the “accelerated depreciation of its open radio access network, retirement benefits, lower capitalized interest, and lower adjusted equity from its investment in DIRECTV,” all of which does not impact its ability to sustain its dividends.
T Valuations
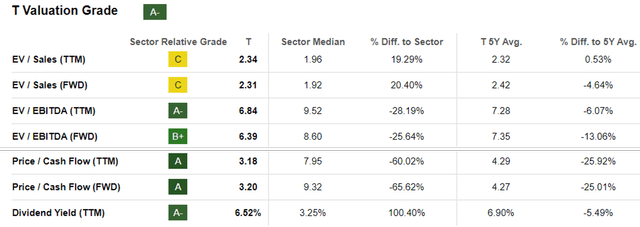
For now, thanks to the misunderstood forward guidance, it is unsurprising that T trades at impacted FWD EV/ EBITDA valuation of 6.39x and FWD Price/ Cash Flow valuations of 3.20x.
This is compared to its 1Y mean of 6.62x/ 3.50x, 3Y pre-pandemic mean of 6.90x/ 5.16x, and sector median of 8.60x/ 9.32x, respectively.
Even when compared to its direct peer, Verizon (VZ) at 7.13x/ 4.67x and Comcast (CMCSA) at 6.86x/ 5.75x, respectively, it is apparent that the market has temporarily discounted T’s prospects.
The Consensus Forward Estimates
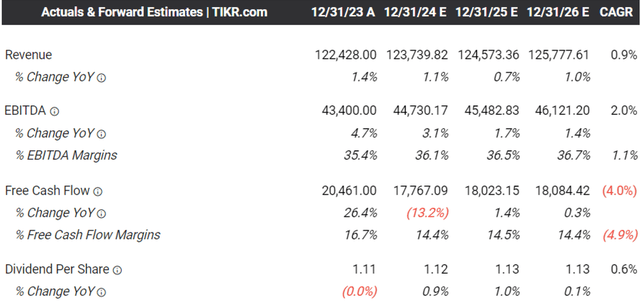
Then again, we are not overly concerned, since T’s future dividends remain secure, concurring with the management’s commentary that the FY2024 FCF generation remains more than sufficient to cover its existing commitments, inline with the consensus forward estimates through FY2026.
The same has been suggested by the Seeking Alpha Quant, with the stock still recording decent 1Y Dividend Coverage Ratio of 1.98x and TTM Interest Coverage of 3.44x, compared to the 5Y mean of 1.84x/ 4.08x and sector median of 2x/ 3.81x, respectively.
T’s balance sheet remains stable at a net debt situation of $121.13B (+2% QoQ/ -6.2% YoY) and a weighted average interest rate of 4.2% (+0.1 points YoY), with only $9.47B maturing over the next twelve months.
With the Fed pivot already expected by H1’24, we believe that most of the macro headwinds are already behind us, barring any negative developments on the lead-sheathed phone cables.
So, Is T Stock A Buy, Sell, or Hold?
T 2Y Stock Price
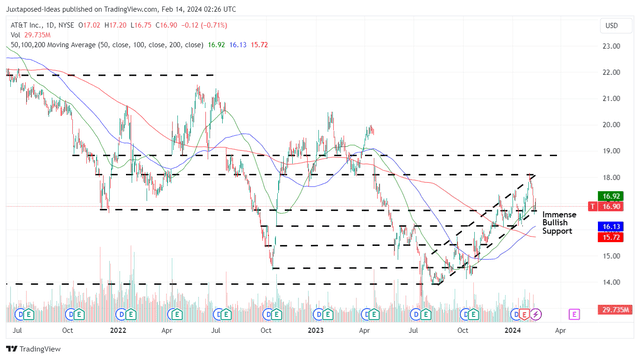
For now, T has recorded massive bullish support since the August 2023 bottom, with it easily breaking out of its 50/ 100/ 200 day moving averages while charting new highs/ new lows thus far.
While the stock has naturally returned part of its recent gains after the mixed FQ4’23 earnings call, we believe that the support levels of $16s will hold, with the correction also triggering an excellent forward dividend yields of 6.52%.
This number is inline with VZ’s at 6.63% and improved than the US Treasury Yields of between 4.30% and 5.38%.
As a result, we maintain our view that T continues to offer a viable dividend investment thesis, with the recent pullback being a gift, resulting in our reiterated Buy rating.
Analyst’s Disclosure: I/we have no stock, option or similar derivative position in any of the companies mentioned, and no plans to initiate any such positions within the next 72 hours. I wrote this article myself, and it expresses my own opinions. I am not receiving compensation for it (other than from Seeking Alpha). I have no business relationship with any company whose stock is mentioned in this article.
The analysis is provided exclusively for informational purposes and should not be considered professional investment advice. Before investing, please conduct personal in-depth research and utmost due diligence, as there are many risks associated with the trade, including capital loss.
Seeking Alpha’s Disclosure: Past performance is no guarantee of future results. No recommendation or advice is being given as to whether any investment is suitable for a particular investor. Any views or opinions expressed above may not reflect those of Seeking Alpha as a whole. Seeking Alpha is not a licensed securities dealer, broker or US investment adviser or investment bank. Our analysts are third party authors that include both professional investors and individual investors who may not be licensed or certified by any institute or regulatory body.


