Summary:
- Tesla, Inc. stock continues to trade at bubble valuations despite a decline in its share price by over 50% from its peak.
- Tesla’s average revenue per vehicle sold is in decline as a natural consequence of its move from a small player to a large player in the market.
- When measured relative to its industry peers, Tesla remains uniquely expensive, even when compared against Nvidia and Eli Lilly, which also dominate their respective industries.
jetcityimage/iStock Editorial via Getty Images
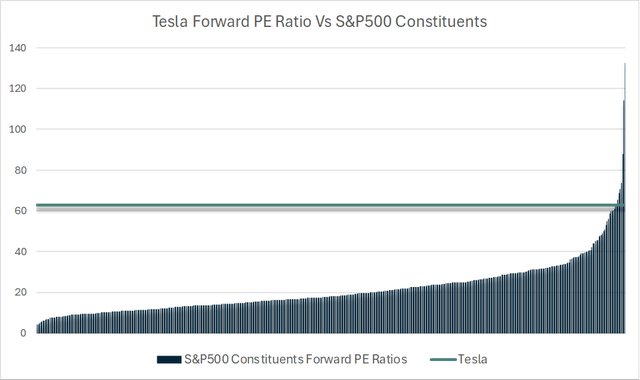
Despite Tesla, Inc.’s (NASDAQ:TSLA) share of the Nasdaq 100-Index (NDX) falling by over a half over the past 18 months, the stock continues to trade at bubble valuations. At 63x forward earnings, Tesla is the 8th most expensive stock in the S&P 500 (SP500). The market continues to price in overly optimistic expectations of future growth, and even a strong recovery over the coming years would not prevent further stock weakness.
When Extrapolating Growth Goes Wrong
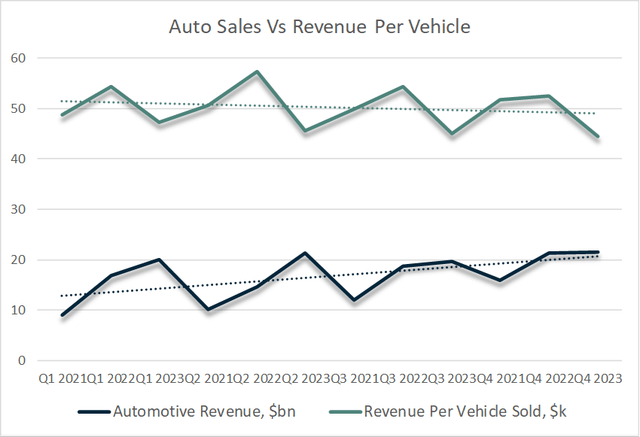
Last year, Tesla’s sales reached 5% of the entire MSCI World Auto Index, becoming the 11th largest car maker globally by revenue and the 5th most profitable. Since then, its profits have begun to decline amid slowing sales growth and collapsing gross margins. Despite still managing to post 19% sales growth in 2023, gross profit fell 15% amid a 5pp drop in gross margins, which brought them back in line with industry peers. In the highly competitive automotive industry, Tesla is being forced to reduce prices in order to grow market share. The average revenue per vehicle sold has fallen from a peak of $57,300 in Q2 2022 to $44,500 in Q4 2023. While it has long been argued that Tesla’s sales are constrained by supply and not competition, the figures speak for themselves.
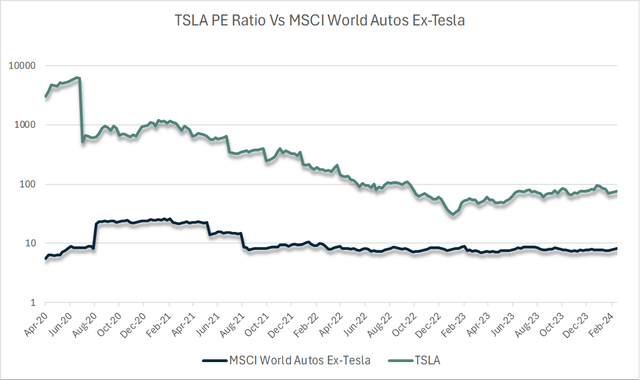
This decline in growth has left Tesla trading at a P/E of 77x despite a 50% price decline from its 2021 peak. On a forward basis, the figure drops to 63x, which still ranks the stock at the 8th most expensive stock in the S&P 500, behind 7 stocks with an average market cap of just $500mn. For a company with expected profits over $10bn, Tesla’s P/E ratio stands out as being extremely high.
Comparing The Three Main Mega Cap Bubble Stocks
Despite the extreme underperformance of the Tesla’s stock over the past 18 months, particularly relative to other mega cap stocks, it remains uniquely expensive. Nvidia (NVDA) and Eli Lilly (LLY) have seen parabolic rises, yet on a forward basis they are still cheaper than Tesla. Furthermore, Tesla stands out as even more overvalued when measured against its sector peers.
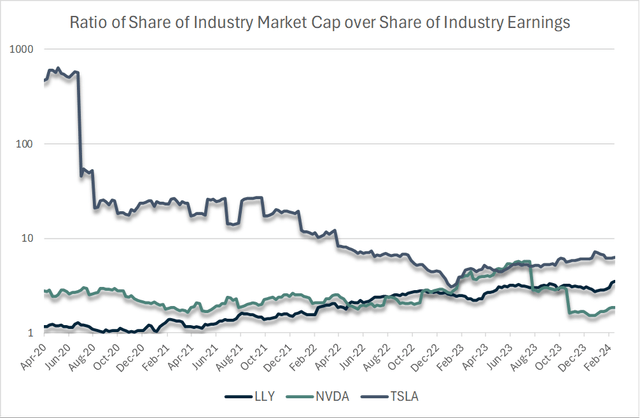
The chart below shows the ratio of Tesla’s share of the MSCI World Autos Index market capitalization over its share of earnings, as well as the same ratios for NVDA and LLY for the semiconductor and pharmaceutical industries. Tesla still commands 37% of the entire MSCI World Autos Index, yet generated just 6% of its total earnings last year, resulting in a ratio of over 6x. For Nvidia, these figures stand at 37% and 20%, while for Lilly the figures are 21% and 6%.
Even after a 50% decline Tesla still stands out as being extremely expensive. It is becoming increasingly clear that Tesla should not trade at a valuation of almost 10x higher than its industry peers.
On a free cash flow basis, Tesla proves to be even more extremely overvalued as the company continues to struggle translating earnings into cash. Tesla’s rapid expansion has seen capex surge relative to depreciation expenses, while its working capital position has deteriorated. As a result, last year’s free cash flow was just 52% of net income, resulting in a price to free cash flow ratio of 146x. Furthermore, this does not include stock-based compensation, or SBC, which has risen back to over 20% of net income.
Three Fair Value Scenarios
Tesla’s fair value is significantly lower than current levels under most reasonable assumptions. I assume that Tesla will reach a peak share of the global auto market in 10 years and after that will be valued at 12x earnings, 50% higher than the industry average excluding Tesla. I will also assume that profit margins remain at current levels and that the auto industry overall grows at 4% in line with global GDP. I will use a required rate of return of 10%, in line with the long-term returns on U.S. stocks.
| Bear Scenario | Mid Scenario | Bull Scenario | |
| Tesla Terminal Market Share, % | 6 | 12 | 24 |
| Fair Multiple In 2034 | 12 | 12 | 12 |
| Growth Rate Of Industry, % | 4 | 4 | 4 |
| Required Rate Of Return, % | 10 | 10 | 10 |
| EPS 2023 | 2.61 | 2.61 | 2.61 |
| EPS In 2033 | 3.86 | 7.75 | 15.5 |
| Annual Growth Rate, % | 4.0 | 11.5 | 19.5 |
| FV In 2034 | 46 | 93 | 186 |
| FV Today | 18 | 36 | 72 |
| Decline Needed To Reach FV | 91% | 82% | 64% |
Even under the bullish scenario in which Tesla manages to grow earnings per share by almost 20% annually over the next decade and trades at a premium to its peers beyond then, TSLA stock remains overvalued. In order for Tesla’s current share price to be anywhere close to fair value, we would have to assume not only a rapid recovery in growth but also that the company perpetually trades at multiples far higher than its peers.
Summary
The slowdown in sales growth and collapse in profit margins is a natural consequence of Tesla moving from a small player in the auto industry to a large one. However, the market continues to assign an extremely high valuation multiple to the stock, leaving it uniquely overvalued relative to its peers. Even if we see a strong recovery in Tesla’s market share, it would have to trade at a premium to its peers in perpetuity to justify its current valuation.
Analyst’s Disclosure: I/we have a beneficial short position in the shares of TSLA either through stock ownership, options, or other derivatives. I wrote this article myself, and it expresses my own opinions. I am not receiving compensation for it (other than from Seeking Alpha). I have no business relationship with any company whose stock is mentioned in this article.
Seeking Alpha’s Disclosure: Past performance is no guarantee of future results. No recommendation or advice is being given as to whether any investment is suitable for a particular investor. Any views or opinions expressed above may not reflect those of Seeking Alpha as a whole. Seeking Alpha is not a licensed securities dealer, broker or US investment adviser or investment bank. Our analysts are third party authors that include both professional investors and individual investors who may not be licensed or certified by any institute or regulatory body.
