Summary:
- NVIDIA and other AI-focused stocks have outperformed Apple in the recent tech stock rally.
- Apple’s price chart shows a bearish descending triangle pattern, indicating potential further decline.
- Apple’s revenue growth has been non-existent and its fundamental picture is weak, making it an unattractive investment.
ozgurdonmaz
The absolutely epic rally in tech stocks we’ve seen since October has been breathtaking in many ways. The pace and magnitude of the rally has been difficult to keep up with as we’ve seen stocks approach conditions or levels where they should pull back, but it just hasn’t happened. The thing is that – like most rallies – this one has left some stocks behind. The very clear leader has been NVIDIA (NVDA) and other AI- focused stocks, while others – like Apple (NASDAQ:AAPL) – have been left behind.
In this article, we’ll take a look at why I continue not to like Apple, why I think it’s going to break support, and why it is my belief your money is better invested in numerous other places. Let’s dig in.
An ominous pattern forming
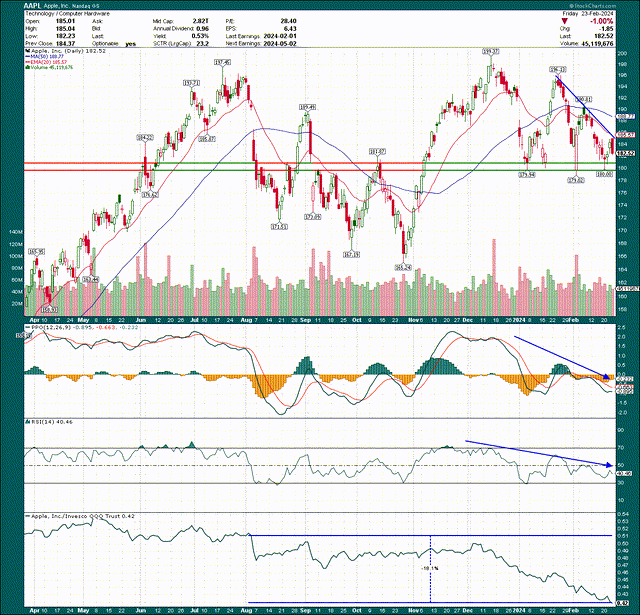
As we always do, we’ll start with a look at the price chart. In Apple’s case, I see a very clear descending triangle forming, which is a bearish pattern that once confirmed, would see shares move much lower than they are today. Essentially, a descending triangle has a series of lower highs that make up the downward sloping line, and then a level where we see the bulls defend it over and over again to make up the flat part of the triangle. This theory in technical analysis is that multiple tests of a level continue to weaken it, and it should eventually break.
Below, we can see the lower highs, with the flat part of the triangle at the ~$180 level. That’s the level to watch.
If that ~$180 level breaks – and I believe it will in fairly short order – we could quite easily see Apple lose another $15 or $20 per share. Momentum has been horrible, as you can see in the PPO and RSI, and relative strength has been even worse. Apple has underperformed the Nasdaq 100 by 18% just since last August. Most of that has been since early December but irrespective of where you start the measurement from, Apple has been a relative loser.
We can see Apple also has managed to grossly underperform its peer group, and the peer group has managed to massively underperform the S&P 500. Forget about comparing to the Nasdaq, which is much worse.
If I could sum up Apple’s technical picture succinctly, it’s a weak stock in a weak group. No thanks.
Fundamentals not exactly rosy either
Apple shifted years ago from a fast-growing hardware maker with a burgeoning services business, to a no-growth/slow-growth hardware maker that is a capital return and margin growth story. The problem is that, in my view, the stock hasn’t been revalued to meet that new reality, meaning I find it to be too expensive at the moment. Given the fact that I don’t like anything about the price chart, the fundamental picture only makes me more bearish. Let’s start with the top line, which I believe is the principal issue Apple is suffering with today.
Apple’s revenue growth exploded during the immediate aftermath of COVID, but actually went negative on a TTM basis in 2023. The company hasn’t managed to post a positive TTM top-line growth rate since the end of 2022. That creates all kinds of issues from a growth perspective as top-line growth affords not only the tangible benefit of more revenue, but also operating leverage that is generally afforded from rising revenue that boosts margins. Flat or no growth makes those things much more challenging.
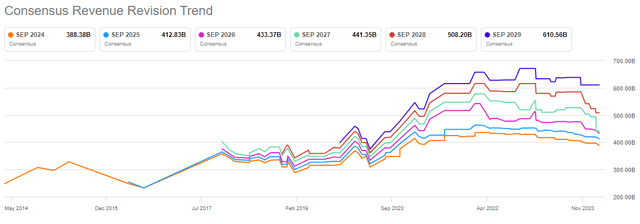
If we look at revisions, we can see a pretty ugly picture, quite frankly.
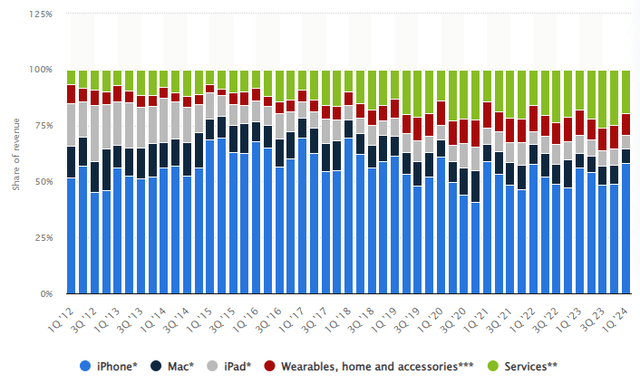
We saw estimates rise quite nicely into 2022, but it’s been flat-to-down since then. Importantly, there’s really no end in sight as the slopes of these lines remains firmly downward. Apple has worked to diversify its revenue sources over the years, and that is working. The problem is that iPhone revenue isn’t the driver it used to be, and Apple’s other businesses are just too small in comparison to overcome any weakness there.
Source: Statistica
The Services segment share of revenue has grown over the years, and the margins in that segment are terrific. But like I said, even though iPhone’s share of revenue has gradually drifted lower, it’s still overwhelmingly the largest segment.
Very recent data suggests Apple is the continued leader in smartphones, and that’s great. The problem is that Apple has managed to see negative revenue growth while being a leader in smartphone market share. Where’s the upside going to come from? With Apple already on top, it would need the size of the market to grow materially to see any sort of meaningful boost to the top line. Further share gains are likely to be incremental at best given its already-dominant position, so I’d suggest the risk here is probably skewed to the downside.
From a margin perspective, the push towards Services revenue is doing wonders for the company’s margins, but the pace simply isn’t strong enough for me.
TTM gross margins have gradually drifted higher, adding about 400bps since 2021. That’s good, but the issue is that operating margins haven’t seen anything like that much of a gain. Over the same period, the gain in operating margins was just half of that at 200bps. Regardless of where you start the measurement from – 2023 saw pretty much the same margins as 2021 – this again is just not good enough to support the valuation of the stock.
We’ve now looked at revenue and margins, which are two of the three ways a company can boost its EPS. The third and final way is through share repurchases, which Apple has been doing plenty of in recent years. Steve Jobs was famously unwilling to return capital to shareholders, but those days are long gone, and Apple returns unfathomable amounts of cash to its holders.
Share repurchases over TTM periods (shown above) have very steadily remained in the area of $80+ billion. That’s a lot of money, but the issue is that we’re still only talking about maybe 3% of the market cap annually. That’s a nice tailwind to EPS (reduced share counts translate directly to EPS growth), but in my view is not enough to overcome the weakness in revenue, and the relative weakness of operating margin growth.
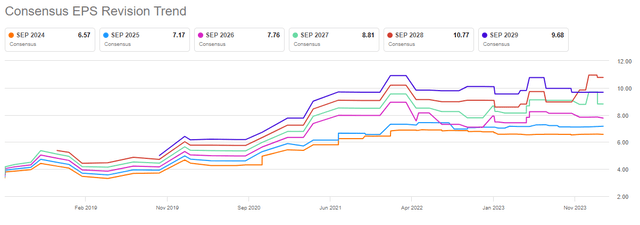
It is no wonder, then, that EPS revisions have been quite uninspiring in recent years.
EPS estimates peaked roughly two years ago, and there’s really nothing to be excited about here. If you squint, you may be able to see some slight upward trajectories with some of the years in this chart, but when other tech stocks are showing 20% or 30% EPS growth, why would you want to own this?
The valuation has further to fall
It’s hopefully pretty clear at this point that I think Apple’s earnings growth profile looks more like a consumer staples company than a tech company. The problem for me is that while the valuation has come down, I don’t think it’s come down nearly enough.
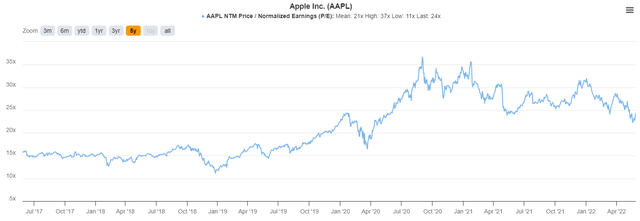
The valuation right now is at ~24X forward earnings, which is ahead of its five-year average of ~21X. However, I’d argue that for much of this five-year period, Apple’s growth outlook was much better. We had years of strong revenue and margin growth, which then brought about good EPS growth rates. In my view, we don’t have any of that, meaning I’d expect a lower forward P/E. Valuations are always more art than science and are largely dependent upon each investor’s preferences for creating a “fair value”. It is my belief that unless Apple suddenly picks up the pace of revenue and margin growth – which I simply do not see a catalyst for – it should be trading at something more like 18X or 20X earnings.
We can see below that revenue growth is slated to be quite modest, and EPS growth should be better. This is down to some margin growth, but mostly from projected share repurchases, as we looked at above.
Seeking Alpha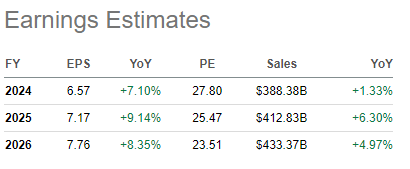
But do these numbers look like something you want to pay a mid-20s forward P/E for? For me, this is nowhere close to good enough for that sort of valuation. Apple is just too expensive, and that’s the bottom line.
Why I’m short
If we wrap this up, I see Apple’s road to revenue growth as extremely difficult, margin growth has been underwhelming, and really the primary driver of EPS growth is share repurchases. I quite like Seeking Alpha’s Quant Rating system, which shows some of the same issues that I have highlighted above.
Seeking Alpha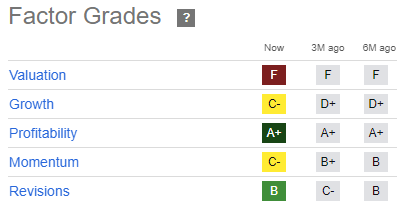
The valuation gets an F rating, which I very much agree with, as noted above. Growth is also a C-, and I think that’s a fair rating given how much stock the company is buying back, which is covering up weakness elsewhere. I’d suggest revisions are probably generous at a B rating, but regardless, the point is that the Quant Rating is a Hold, and hasn’t been a Buy for a long time. That’s congruent with my assessment.
For all of these reasons, I’m short Apple. I think we’re going to see the stock break the $180 level and complete the descending triangle pattern. The price chart and relative strength are pretty awful, and the stock is simply far too expensive.
I’m choosing to short Apple through the Direxion Daily AAPL Bear 1X Shares ETF (AAPD). It’s a -1X daily target return exchange-traded product that essentially shorts Apple for you. The expense ratio is just over 1% annually so the cost to do so is pretty minimal, and it tracks Apple at a -1X rate pretty well. You can also use puts if you prefer that, but I’m sticking with AAPD rather than puts, or outright shorting Apple itself.
From a risk management perspective, I’ll exit my short if the stock clears the 50-day simple moving average, as that would not only negate the pattern I mentioned above, but signify a potential major trend change. Given that, I don’t want to be short something that’s potentially on the move higher again.
I’m targeting a test of the ~$165 low from a few months ago for this move down, so I’m looking to exit my short at somewhere between there and $170. On the upside, the 50-day SMA is at about $188 but rapidly declining, and as I said, I don’t want to be short above that.
Analyst’s Disclosure: I/we have a beneficial short position in the shares of AAPL either through stock ownership, options, or other derivatives. I wrote this article myself, and it expresses my own opinions. I am not receiving compensation for it (other than from Seeking Alpha). I have no business relationship with any company whose stock is mentioned in this article.
Seeking Alpha’s Disclosure: Past performance is no guarantee of future results. No recommendation or advice is being given as to whether any investment is suitable for a particular investor. Any views or opinions expressed above may not reflect those of Seeking Alpha as a whole. Seeking Alpha is not a licensed securities dealer, broker or US investment adviser or investment bank. Our analysts are third party authors that include both professional investors and individual investors who may not be licensed or certified by any institute or regulatory body.
If you liked this idea, sign up for a no-obligation free trial of my Seeking Alpha Marketplace service, Timely Trader! I sift through various asset classes to find the best places for your capital, helping you maximize your returns. Timely Trader seeks to find winners before they become winners, and keep you out of losers. In addition, you get access to our community via chat, direct access to me, real-time price alerts, a model portfolio, and more.

