Summary:
- F has outperformed expectations, with the promising FY2024 guidance and excellent supplementary FQ1’24 payouts demonstrating the safety of its dividend investment thesis.
- It is apparent by now that its legacy businesses remain the backbone of the company, with robust consumer demand and expanding profit margins.
- With the moderated EV cash burn well balancing the UAW headwinds, we may see F continue to deliver excellent bottom lines ahead, further aided by the stable balance sheet.
- Combined with the excellent support at current levels and the management’s intensified hybrid efforts, the stock has been upgraded as a Buy.
Tomwang112
We previously covered Ford Motor (NYSE:F) in December 2023, discussing its uncertain prospects then, attributed to the reduced EV productions through 2024 and the intensified competition from multiple legacy/ start up automakers.
With the moderated EV cash burn negated by the impact of $8.8B in profit headwinds through 2028 from the UAW contracts, we had preferred to prudently reiterate our Hold rating then.
In this article, we shall discuss why we are cautiously upgrading the F stock to a Buy, attributed to the management’s exemplary FY2024 profit guidance, well exceeding our expectations.
Combined with the relatively healthy balance sheet and the payment of supplementary dividends, we believe that its dividend investment thesis remains robust in the intermediate term.
F’s Dividend Investment Thesis Remains Robust In The Intermediate Term
For now, F has reported a bottom line beat in the FQ4’23 earnings call, with automotive revenues of $43.22B (+4.9% QoQ/ +3.5% YoY) and adj overall EPS of $0.29 (-25.6% QoQ/ -43.1% YoY), with FY2023 numbers of $165.9B (+11.2% YoY) and $2.01 (+6.9% YoY), respectively.
Much of the bottom line tailwinds are attributed to the robust profitability reported by Ford Blue at EBIT of $7.46B (+8.9% YoY)/ EBIT margins of 7.3% (+0.1 points YoY) and Ford Pro at $7.22B (+124.1% YoY)/ 12.4% (+5.9 points YoY) in FY2023, respectively.
These numbers well negate the cash burn consistently reported by Ford Blue at EBIT of -$4.7B (-120.3% YoY) and EBIT margins of -79.7% (-39.1 points YoY) in FY2023.
This perhaps explains why the management has opted to “defer certain capital investments in EVs until they’re justified by demand and prospects for acceptable returns,” given that “mainstream customer adoption of EVs happening at a slower rate than the industry expected.”
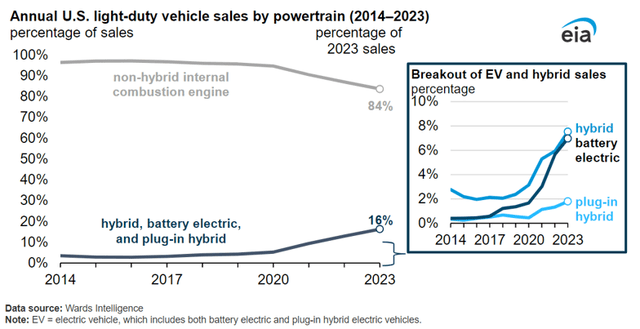
Annual Sales Of Light-Duty Vehicles By Power Train
As the early EV adopter wave ended in the US, it is apparent that the next group of consumers are more wary, attributed to range anxiety and elevated borrowing costs.
This is worsened by the higher average EV price of $66.99K, compared to hybrids at $39.04K and ICE vehicles at $33.79K, further increasing the barrier to entry.
The same has been reported by the EIA, as hybrid vehicle sales hits a higher market share of over 7.5% compared to BEVs at approximately 7% in 2023.
As a result of the market trend, it is unsurprising that F’s Hybrid vehicles quickly grew in demand to 12.04K units by February 2024 (+7.9% MoM/ +31.5% YoY), building upon the EV sales at 6.36K (+36.1% MoM/ +80.6% YoY) and ICE vehicles sales at 155.77K (+13.8% MoM/ +7.4% YoY).
Assuming that the trend continues for the next few quarters and the management is able to execute the doubled F-150 hybrid production ramp ups, we may see the legacy automaker report accelerated growth in Hybrid vehicle sales in FY2024, compared to the 133.74K units reported in FY2023 (+25.3% YoY).
Readers must also note that F offers a well-diversified automotive portfolio across gas, hybrid, and electric vehicles, trumping that of General Motor (GM), which has yet to launch hybrid models in the North American market.
As a result of its market leadership, we may see F getting off to an exemplary start with hybrids increasingly embraced as the bridge between internal combustion and full electric vehicles.
This dramatic shift has also contributed to F’s excellent FY2024 guidance, with adj EBIT of $11B (+5.7% YoY) and adj Free Cash Flow generation of $6.5B at the midpoint (-4.4% YoY).
These numbers are better than expected indeed, despite the higher capex guidance of $8.75B (+6.3% YoY) and the additional UAW-related costs at approximately $2.2B annually.
As a result of the improved bottom-line in FQ4’23, promising FY2024 guidance, and the relatively healthy balance sheet at net cash of $9.26B (-4.1% QoQ/ -26.8% YoY/ +3.5% from FY2019 levels of $8.94B), we can also understand why the F management feels confident enough to offer a supplemental dividend of $0.18 per share, on top of the regular dividends of $0.15 per share in FQ1’24.
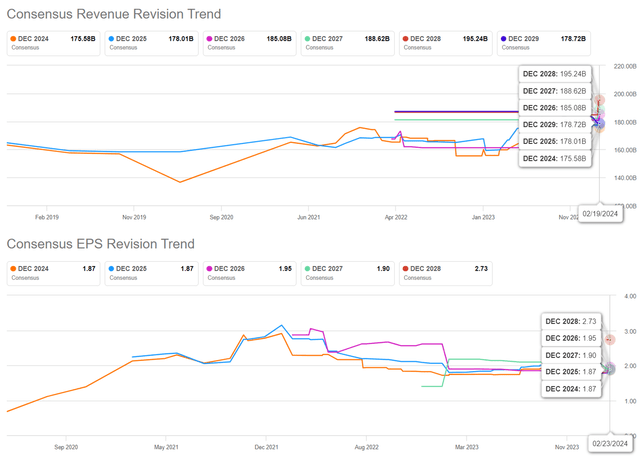
The Consensus Forward Estimates
The consensus have also moderately raised their forward estimates, with F expected to record a top/ bottom line growth at a CAGR of +3.7%/ -1.1% through FY2026.
This is compared to the previous estimates of +2.9%/ -3.9% and the historical expansion at +2.3%/ +1.9% between FY2016 and FY2023, respectively.
F Valuations
As a result of the improved bottom line, the market has also moderately upgraded F’s FWD P/E valuations to 6.75x and FWD Price/ Cash Flow valuations to 5.20x, up from the 5.98x and 2.87x recorded in the October 2023 bottom, respectively.
The same re-rating has also been observed in GM from FWD P/E of 4.19x to 4.63x and Stellantis (STLA) from 2.97x to 4.71x, implying the market’s increased conviction surrounding the legacy automakers’ improved profitability through ICE vehicles.
While there remains a great distance to the sector P/E median of 15.68x, the upgraded numbers also bring F’s prospects nearer to its 3Y pre-pandemic P/E mean of 7.11x, implying that it is moderately undervalued at current levels.
So, Is F Stock A Buy, Sell, or Hold?
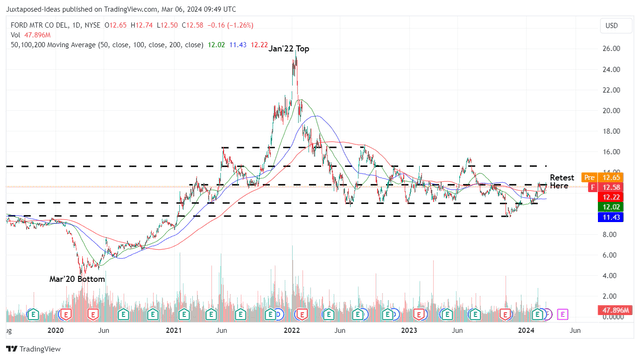
F 4Y Stock Price
While stock prices are usually corrected after dividend payouts, F remains well supported at current levels after the March 01, 2024 payout date, lending further credibility to its dividend investment thesis.
The same has been observed in the relatively stable Interest Coverage Ratio of 4.07x and Dividend Coverage Ratio of 3.11x.
Based on the quarterly payouts of $0.15 per share and stock prices at the time of writing, F also offers a relatively decent forward yield of 4.7%, compared to the US Treasury Yields of between 4.12% and 5.38%.
With the Fed pivot likely to be prolonged and mass-market electrification delayed until second gen EVs are introduced by 2025/ 2026, we may see legacy automakers, F included, report improved profitability in the intermediate term.
If anything, the F management has offered an excellent EBIT midpoint guidance of -$5.25B for Ford Model e in FY2024 (-11.7% YoY), implying narrowing losses compared to the -$4.7B reported in FY2023 (-120.3% YoY).
This is further aided by the other segment’s projected growth in profitability, with $8.5B from Ford Pro (+17.7% YoY), $7.25B from Ford Blue (-2.8% YoY), and $1.5B for Ford Credit (+15.3% YoY) in FY2024.
As a result of the near-term tailwinds, we are cautiously rerating the F stock as a Buy at every dip.
Analyst’s Disclosure: I/we have no stock, option or similar derivative position in any of the companies mentioned, and no plans to initiate any such positions within the next 72 hours. I wrote this article myself, and it expresses my own opinions. I am not receiving compensation for it (other than from Seeking Alpha). I have no business relationship with any company whose stock is mentioned in this article.
The analysis is provided exclusively for informational purposes and should not be considered professional investment advice. Before investing, please conduct personal in-depth research and utmost due diligence, as there are many risks associated with the trade, including capital loss.
Seeking Alpha’s Disclosure: Past performance is no guarantee of future results. No recommendation or advice is being given as to whether any investment is suitable for a particular investor. Any views or opinions expressed above may not reflect those of Seeking Alpha as a whole. Seeking Alpha is not a licensed securities dealer, broker or US investment adviser or investment bank. Our analysts are third party authors that include both professional investors and individual investors who may not be licensed or certified by any institute or regulatory body.


