Summary:
- In my last article from March 2023, I underestimated the strength of Amazon’s balance sheet.
- Amazon’s financial performance in 2023 was in line with my assumptions.
- The bull case is further margin expansion.
- The deconsolidated financials statements show the reasons for Amazon’s incredible share-price performance over the past year.
- My SOTP valuation leaves me to assume that future margin expansion is heavily priced into the current share price.
Daria Nipot
Introduction
Nearly one year ago, I wrote my first article on Amazon (NASDAQ:AMZN), called “Amazon: Breaking Up The Company From An Accounting Standpoint”.
Here are my closing words from that article:
I rate Amazon as a hold at the current price of $98.95 per share and will probably reevaluate my thesis sometime next year to check if management was able to deliver on their promises for improvements in 2023.
Source: Author’s March 2023 article – Conclusion
The improvement promises I referred to were targeted at comments from Amazon’s CFO Brian Olsavsky in the FY2022 earnings call. In that call, the CFO said that Amazon was trying to regain its past cost structure (I will come back to this later). Simply said, Amazon promised to increase margins.
In this article, I will deliver on my promise and revisit my thesis by looking at what has happened since then. I will also have to address a mistake I made regarding Amazon’s debt situation. So let’s start with that.
Admitting Mistakes
In my last article, I argued that Amazon’s balance sheet deteriorated greatly, with the net debt rising from $20.3 billion in 2020 to $99.9 billion in 2022. Here is the chart from Tikr.com I used back then:
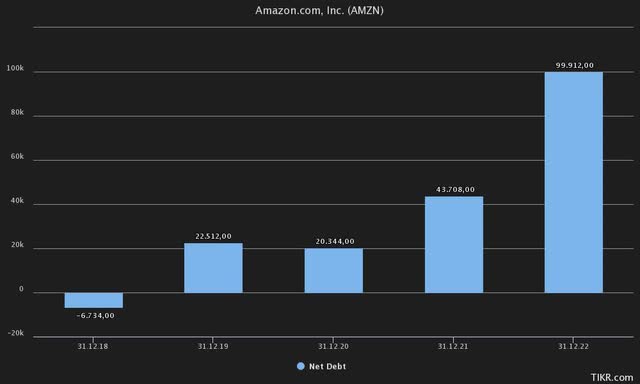
Amazon net debt 2018-2022 (Tikr Terminal)
Note that Tikr uses S&P Capital IQ as a data source, the same source Seeking Alpha uses (as far as I know). I recently realized that these net debt numbers include lease liabilities. Let me show you what I mean. Here is a screenshot from Amazon’s 2023 balance sheet:
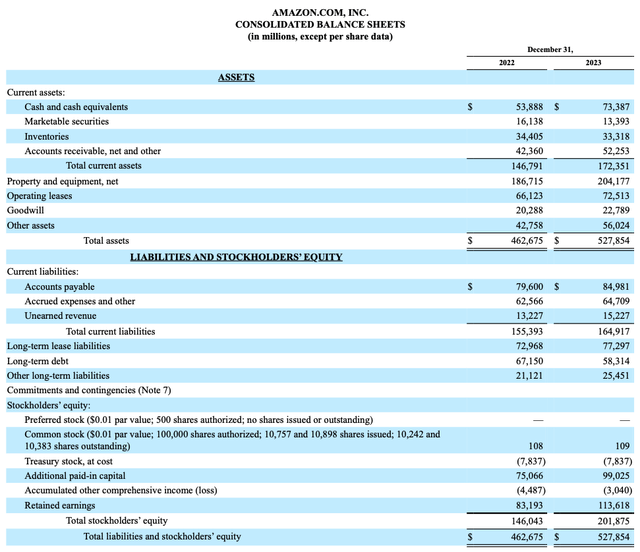
Amazon 2023 Balance Sheet (FY2023 10-K Filing)
If we calculate net debt by simply deducting long-term debt from cash & equivalents and marketable securities, Amazon would have had a net cash position of $2,876 million (2022) and $28,466 million (2023). The problem is that Amazon’s way of reporting the balance sheet is not that easy to understand because some relevant positions are buried under “Other” liabilities. It is safe to say though that the lease liabilities are included in S&P’s net debt calculation.
So I did the following to arrive at actual net debt: I used the net debt numbers provided by S&P and adjusted them for current and non-current operating lease liabilities. The operating lease liabilities are reported in Note 4 of the 10-K filing, but I will not bother you with more screenshots. Here is a table showing my new calculation (numbers in $million):
| Year | 2017 | 2018 | 2019 | 2020 | 2021 | 2022 | 2023 |
| Net Debt (according to S&P) | 13,122 | -6,734 | 22,512 | 20,344 | 43,708 | 99,912 | 74,794 |
| – Operating Lease Liabilities | 0 | 0 | 25,835 | 39,099 | 58,330 | 69,040 | 75,639 |
| = Net Debt | 13,122 | -6,734 | -3,323 | -18,755 | -14,622 | 30,872 | -845 |
Author’s Note: Lease liabilities were first reported in 2019 due to the implementation of new accounting standards.
In conclusion, my statement back then that “Amazon’s net debt rose by close to $80 billion from the end of FY2020 to the end of FY2022″ was wrong (at least by my definition, which excludes operating lease liabilities) and I have to admit that mistake. All of this also makes a lot of sense if we look at the last three years of interest income/expenses. Here is a short table showing you what I mean (numbers in $million):
| Year | 2021 | 2022 | 2023 |
| Net Debt | -14,622 | 30,872 | -845 |
| Cash & Equivalents + Marketable securities | 96,049 | 70,026 | 86,780 |
| Interest Income | 448 | 989 | 2949 |
| Long-term Debt | 48,744 | 67,150 | 58,314 |
| Interest Expense | -1,809 | -2,367 | -3,182 |
Due to interest rate increases, the interest income has risen while the cash position hasn’t changed that much. The same is true for interest expenses, albeit on a smaller scale (interest rates for borrowing increased less than interest rates on Amazon’s cash balance). The interest result, expressed as interest income minus interest expenses, reached a negligible negative $233 million in 2023. This shows that Amazon’s balance sheet is indeed very strong.
Since operating lease liabilities are mainly rental contracts for warehouses et cetera, it only makes sense to exclude them from the calculation of net debt because the costs that arise from those liabilities are already accounted for as (a) an amortization of the right-of-use asset and to a lesser degree (b) hypothetical interest expenses. So operating lease liabilities are not interest-bearing in the form of actual interest expenses.
Quick Recap on my prior Thesis
I want to make a quick summary of my prior investment thesis. Spoiler, the main things haven’t changed. In my opinion, the only way to value Amazon is by using a sum-of-the-parts (SOTP) approach. For this, I divide Amazon into two segments: (1) AWS and what I will call (2) Amazon retail. Amazon retail is simply Amazon, excluding AWS.
In the segment information of the 10-K filings, Amazon gives us some important metrics to make this approach work. These metrics (for each segment) are:
- Net sales
- Operating expenses (OPEX)
- Operating income (loss) or EBIT
- Net sales by group
- Property and equipment by segment
- Net additions to property and equipment by segment
- Depreciation and amortization by segment
I used all of these metrics to deconsolidate Amazon’s financial statements and arrived at two separate income and cash flow statements for the two business units. I will cover this topic later when I go over the 2023 numbers.
Long story short: The result was that AWS is an outstanding business, generating returns on capital well above 30% in recent years, while the rest of Amazon’s operations generated very low returns on capital. In conclusion, Amazon retail is a mediocre business (from an investor’s view, not from a customer’s view. This is a very important distinction to make!).
Performance since the last article
To begin with, I want to outline my prior valuation assumptions. For AWS, I assumed the following:
- 17% growth until 2029
- 6% growth into perpetuity
- A fair value at around 50x Free Cash Flow (a very high multiple)
- A cash conversion rate between 60-100%
Assuming $18 billion net income for AWS, and a cash-conversion rate of 80% (midpoint of my assumed range), I valued AWS somewhere around $720 billion ($18 billion x 80% cash conversion rate x 50 FCF multiple).
Regarding results, AWS 2023 revenue growth came in at 13.3%, well below my expectation of 17% CAGR until 2029. The cash conversion rate came in at 25%, also well below my estimate (more on that later). So AWS underperformed my assumptions. This is not a huge problem though, because the timeframe of one year is very short.
Regarding Amazon retail, I assumed that what I call “core gross margin” (more on that later) would come back to 15% (2022: 11.88%). For the overall EBIT margin, I assumed an improvement to 2.6%, just 10 basis points below the all-time high reached in 2020. Here is a short table showing the actual results compared to my assumptions:
| Year | 2022 (Actual) | 2023 (My estimate) | 2023 (Actual) |
| Core gross margin | 11.88% | 15.00% | 15.37% |
| EBIT margin | -2.4% | 2.6% | 2.5% |
So my estimates were pretty accurate. The big plus is that Amazon managed to greatly improve core gross margins, even above my assumption which I thought was already bullish back then. The EBIT margin came in very close to my estimate.
So in summary, AWS performed worse while Amazon retail performed slightly better than I expected. What did the market make out of it?
Here is a screenshot from last year’s article:
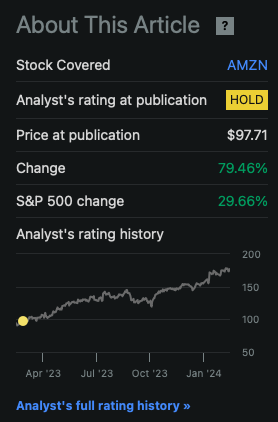
Amazon performance since 2023 article (Seeking Alpha – Author’s article from March 20, 2023)
The market sent Amazon’s shares up nearly 80% over the past year. My neutral rating didn’t go well. I will come back to my thoughts on reasons for this later in the valuation section. For now, let’s look at how Amazon performed in 2023.
Update on 2023 results
Since I already covered the balance sheet earlier, I will directly start with the income and cash flow statements.
Revenues
I will start with two charts regarding the consolidated revenue composition:
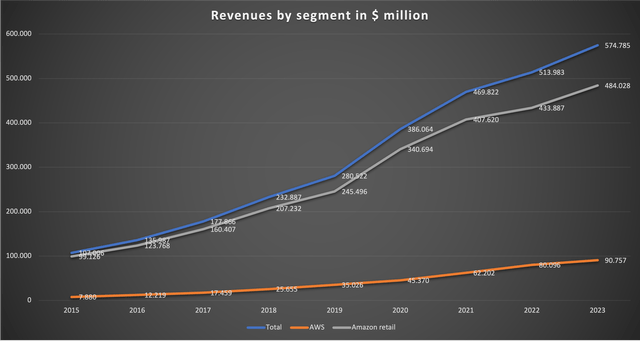
Revenue by segment (Amazon 10-K reports)
Total revenue grew by 11.8% in 2023, driven by 13.3% revenue growth for AWS and 11.6% for Amazon retail.
Since both segments grew revenue at a similar rate, the revenue share of AWS as a percentage of total revenue remained nearly flat in 2023:
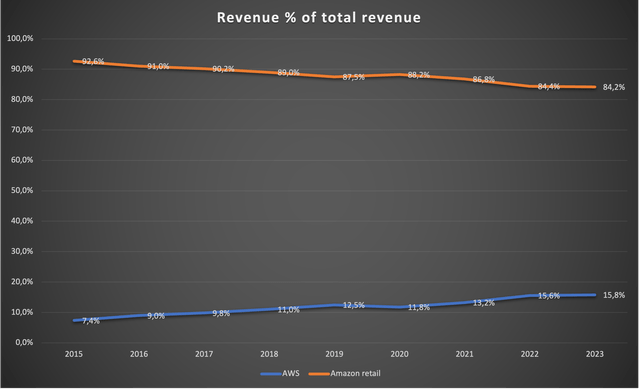
Segment revenue as % of total revenue (Amazon 10-K reports)
The slowdown in AWS revenue growth is a bit concerning because I calculated with higher revenue growth in my prior article.
Since Amazon’s retail revenue includes many different revenue sources, we have to look at these revenue sources as well. I will use the percentages instead of total numbers:
Author Note: I estimated Advertising revenue from 2015-2018 because Amazon only started to disclose this number in 2019.
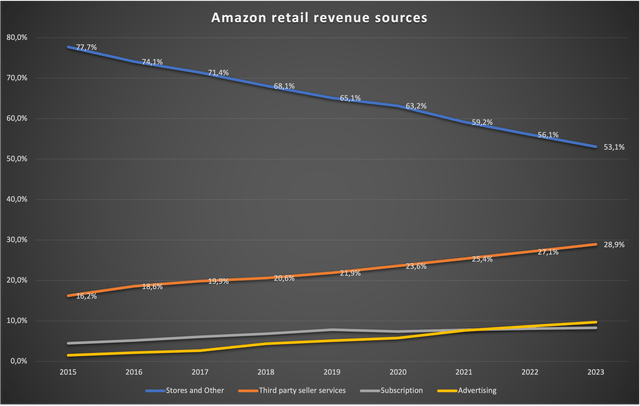
Amazon retail revenue sources (Amazon 10-K reports)
As we can see here, the trend towards a higher share of third-party seller services continues. This remains, besides the outstanding business model of AWS, the main bull case for Amazon. As long as “Store revenue” as a % of total revenue declines, the margin should increase. Taking into account the huge revenue base, Amazon retail could be able to generate incredibly high profits. I will come back to this later in the valuation section.
Subscription revenue, as a percentage of total revenue, only increased from 8.1% in 2022 to 8.3% in 2023. Another big bull case besides AWS and rising third-party seller services is the development of the advertising business. Here is a table showing the development of Amazon’s advertising revenue over the years:
| Year | 2016 | 2017 | 2018 | 2019 | 2020 | 2021 | 2022 | 2023 |
| Advertising YoY growth (%) | 75.5 | 60.5 | 114.2 | 38.6 | 56.6 | 57.6 | 21.1 | 24.3 |
The growth rate of advertising revenue declined significantly over the past two years but it is still growing at a high rate. Amazon tries to keep these growth rates high by including advertising in Amazon Prime Video if users don’t pay an additional $2.99 per month. This will either boost advertising (if users don’t pay the $2.99 per month) or subscription revenue (if they do pay), but only if Amazon Prime users don’t cancel their memberships.
EBIT and EBIT Margin
Coming back to margins, I will use two updated charts:
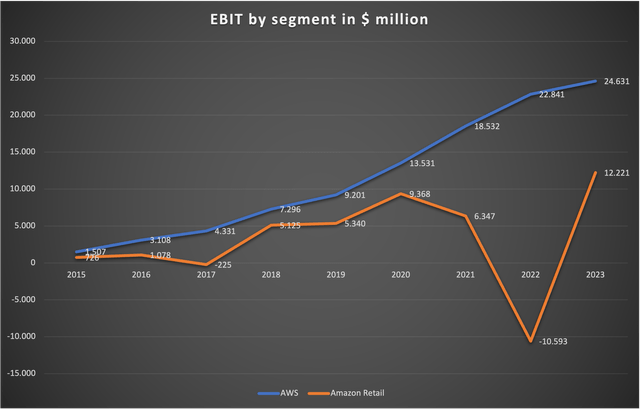
EBIT by segment (Amazon 10-K reports)
These numbers are reported in the segment information of the 10-K filings. We can see that AWS revenue growth slowdown directly impacted the bottom line, with AWS EBIT only growing 7.8% YoY in 2023, quite a bit slower than revenue growth (more on that later). Amazon retail on the other hand delivered a great turnaround (as I already touched on earlier). Amazon’s management was able to deliver on their promise in the FY22 earnings call to regain cost structure, aka greatly improving margins. This is bullish because it reinforces the thesis of rising margins for the Amazon retail segment.
Here is a chart showing the development of the EBIT margins:
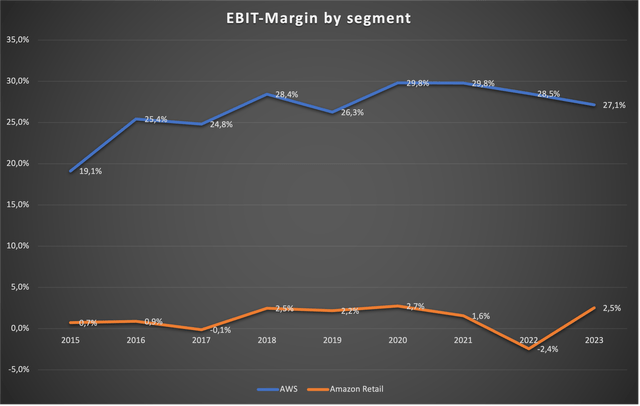
EBIT margins by segment (Amazon 10-K reports)
While AWS margins have declined over recent years, the margins in the retail business have recovered greatly, nearly reaching the record level of 2020. While the margin declines at AWS are a bit concerning, I won’t bother with them any further. Instead, let’s look at what caused the great margin improvement for the retail segment.
Here is the updated chart for the consolidated operating expenditures (OPEX):
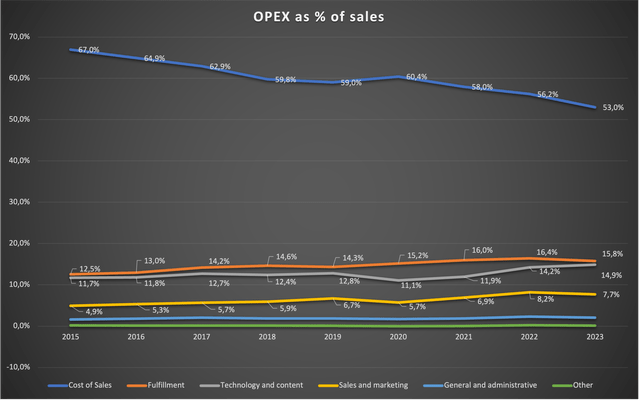
OPEX as % of sales – consolidated (Amazon 10-K reports)
The main driver for margin improvement was cost of sales + Fulfillment. The OPEX for these two expense items as % of sales decreased by 380 basis points YoY, a great improvement. The other expense items pretty much negate each other so I won’t bother with them. Overall, the developments seen in the above chart are very good. We mainly want to see declining costs of sales and fulfillment costs because these two items show that Amazon’s network is getting more efficient over the years.
Now let’s transition to what has been and still is my main thesis: The deconsolidation of Amazon’s financial statements.
Separated Income Statements
I will first outline some of my assumptions:
- I assume AWS’s gross margin at 70% until 2022 and 72% in 2023 (Microsoft (NASDAQ:MSFT) reported a 72% Cloud gross margin for 2023)
- Fulfillment costs are 100% attributable to the retail segment
- Sales and marketing, G&A, and other expenses are attributed at the % of revenue share for each segment in comparison to the total revenue
- Technology and content expenses can then be directly calculated
Here is the income statement for AWS I came up with using these assumptions (numbers in $million):
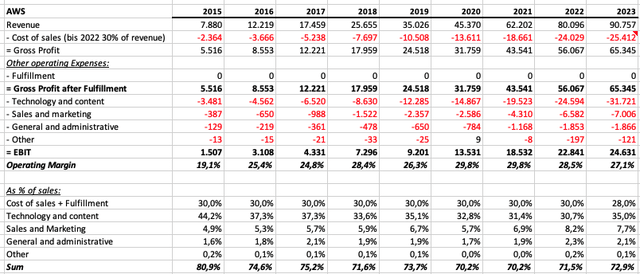
Estimated AWS Income Statement (Author estimates off disclosed segment information)
AWS is still doing great, despite some operating margin pressure. Assuming that AWS was able to increase gross margin YoY just as Microsoft did, gross profit increased 16.5% YoY, a healthy growth rate, albeit below my prior expectations. We can see that most of the expense increases should come from technology and content expenses. Here is what Amazon states regarding this in the 10-K filing:
Costs to operate our AWS segment are primarily classified as “Technology and infrastructure” as we leverage a shared infrastructure that supports both our internal technology requirements and external sales to AWS customers.
Source: Amazon 10-K – Item 7. Results of Operations – Cost of Sales
So it does seem reasonable that most of the expenses in my estimated income statement stem from technology and content expenses.
Since we now have a separate income statement for AWS, we can derive the income statement for the retail segment (numbers in $million):
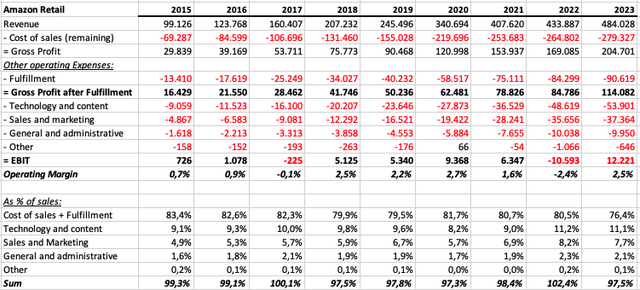
Estimated Amazon retail Income Statement (Author estimates off disclosed segment information)
The most important takeaway from this overview is that the costs of sales + Fulfillment costs as a % of sales declined to 76.4% in 2023, a number that is far below what Amazon has been reporting in the past. This is the main reason for Amazon’s incredible share price performance over the past year. The market not only rewarded these efficiency improvements but also prices in further improvements going forward. I will also admit that I didn’t expect an efficiency improvement at the level Amazon has shown here. I have to give Amazon’s management credit for this outstanding performance.
Now I want to turn toward something I highlighted earlier, which is what I call the “Core Gross Margin”. This is, in my opinion, one of the most important metrics to keep an eye on when looking at Amazon. Here is my calculation for this metric:

Core Gross Margin calculation (Author’s calculation)
Since Advertising revenue is not directly related to the retail operations, I deduct it from total retail revenue. The “Core Gross Margin” is what is left after deducting the cost of sales & Fulfillment costs from that adjusted revenue number. As you can see, the core gross margin rebounded sharply in 2023. Amazon’s share price reached an all-time high with it which might be a coincidence or not. All I can say is that it seems like Amazon’s share price is tied to the development of the core gross margin. In my table above, we can see that Amazon struggled with the core gross margin from 2020 to 2022. Look at the share price during that timeframe:
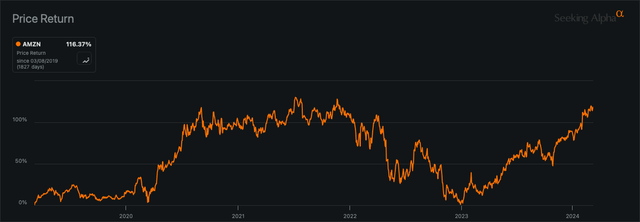
Amazon 5Y share price (Seeking Alpha Charting)
After rising in the aftermath of the pandemic, Amazon traded sideways from the middle of 2020 to the start of 2022. In 2022, the share price tanked by 50%. I can only assume that this is at least partly due to concerns over the core gross margin. I will come back to the margin topic later in the valuation section.
Separated Cash Flow Statements
Now let’s turn to the cash flow statements. I will start with an overview of the consolidated cash flow statement:

Free Cash Flow Calculation (Author’s calculation using reported cash flow statements)
As you can see, I treat stock-based compensation as a cash expense because I think that it belongs to financing cash flow. Here we can see that Amazon was able to generate positive Free Cash Flow (FCF) in 2023 after being FCF negative in both 2021 and 2022. The total number for FCF of only $8.2 billion is still very low compared to the market value of Amazon. This doesn’t concern me that much though, because I know that Amazon spends a lot on growth CAPEX.
Now how can we deconsolidate the cash flow statement? I will use the following numbers that Amazon is giving us in the 10-K segment reporting:
- EBIT per segment
- Net additions to Property & Equipment per segment
- Depreciation and amortization by segment
With these metrics, we can gauge FCF for AWS and deduct FCF for the retail segment using that FCF number. Here is my calculation:

FCF Estimates by segment (Author’s calculations using reported Segment Information)
I assume a 21% Tax Rate for AWS, add back the depreciation number Amazon is giving us, and deduct an estimate for AWS capital expenditures (CAPEX). The CAPEX estimate is based on the reported net additions to property & equipment so it should be accurate.
As we can see here, both segments seem to have been cash flow positive in 2023, even taking into account stock-based compensation. The highly negative FCF in 2021 and 2022 for the retail segment was attributable to the buildout of Amazon’s logistic network.
Returns on Capital
Lastly, I briefly want to touch on returns on capital. I use EBIT as the numerator and the Property & Equipment for each segment (that Amazon reports in the Segment Information) as the denominator. Here is the calculation:

Property & Equipment and Return on Capital by segment (Amazon 10-K reports)
Here we can see that AWS is still generating returns on capital above 30%, while the retail segment struggles around 10%. Increasing returns on capital due to increasing margins for the retail segment and organic growth for AWS should be the main share price drivers in the future.
Takeaways from the 2023 Earnings Call
I can’t write a yearly update without talking about the key takeaways from the full-year earnings call, especially the parts that relate to my outlined thesis. I will split this into two parts: (1) AWS and (2) “cost to serve”.
AWS
Let’s start with AWS. I wrote earlier that AWS has seen some margin pressure in 2023, with the operating margin declining 140 basis points YoY. I want to highlight two statements regarding AWS’s margins:
AWS’ operating income was $7.2 billion, an increase of $2 billion year-over-year. Our operating margin for the quarter was 29.6%, up more than 500 basis points year-over-year and effectively flat on a quarter-over-quarter basis. This margin improvement reflects our headcount reductions from earlier in the year and a slowdown in the pace of hiring.
Source: Brian Olsavsky (CFO) – Amazon Q4 23 Earnings Call
This refers to Q4 23 margins. It seems that margins are already back at past levels (FY20 and FY21 operating margins came in at 29.8%), so the margin compression we have seen in FY23 should not the taken too seriously.
Here are some words on future margin expansion for AWS:
First of all, I think that the lion’s share of cost optimization has happened. It’s not that there won’t be any more or that we don’t see anymore, but it’s just attenuated very significantly.
Source: Andrew Jassy (CEO) – Amazon Q4 23 Earnings Call
So while future margin upside might be there, most of the short-term upside has happened already. In conclusion, I wouldn’t bet on significant margin expansion for AWS in the near term.
Regarding a possible acceleration of revenue growth, the CFO said the following:
And then if you look back at the revenue growth, it accelerated to 13.2% in Q4 as we just mentioned. That was an acceleration. We expect accelerating trends to continue into 2024.
Source: Brian Olsavsky (CFO) – Amazon Q4 23 Earnings Call
This sounds good but he fails to mention that the “acceleration” only means going from 12% YoY growth (Q2 and Q3) to 13% YoY growth in Q4. This is technically an acceleration, but not meaningful. He expects revenue growth acceleration to continue, which fits to another statement he made:
And then on the Gen AI side, it’s — if you look at the Gen AI revenue we have, in absolute numbers, it’s a pretty big number, but in the scheme of a $100 billion annual revenue run rate business, it’s still relatively small, much smaller than what it will be in the future, where we really believe we’re going to drive tens of billions of dollars of revenue over the next several years. But it’s encouraging how fast it’s growing, and our offering is really resonating with customers.
Source: Brian Olsavsky (CFO) – Amazon Q4 23 Earnings Call
Gen AI revenue is expected to grow fast, albeit from a small starting point. This might be a driver for faster revenue growth at AWS. I will take this into account later by staying at my 17% CAGR revenue growth estimate for the future.
Cost to serve
When talking about “cost to serve” Amazon seems to refer to something similar to my aforementioned “core gross margin”. Here is what was stated in the opening remarks:
As we look toward 2024 and beyond, we’re not done lowering our cost to serve. We’ve challenged every closely held belief for our fulfillment network and reevaluated every part of it, and found several areas where we believe we can lower costs while also delivering faster for customers. Our inbound fulfillment architecture and resulting inventory placement are areas of focus in 2024, and we have optimism there’s more upside for us.
Source: Andrew Jassy (CEO) – Amazon Q4 23 Earnings Call
The CEO highlights that Amazon has been lowering its cost to serve and states that there is more way to go. In conclusion, further core gross margin improvements seem to be in the cards. Remember what I said earlier? Improving core gross margins should be one of the main drivers for Amazon’s profits and share price.
In the Q&A session, he elaborated on this:
On the cost to serve coming down, as I mentioned in my opening remarks, I don’t think that we feel like where we’re going to ultimately be. I think we feel like we have meaningful upside there. And I think one thing that it’s easy to make as large a change as we made in regionalization in the U.S. and saying, check, we got that done. But the reality is, we still have several improvements and a bunch of ways that we can hone the regionalization improvements that we made in 2023 and in 2024.
Source: Andrew Jassy (CEO) – Amazon Q4 23 Earnings Call
“Meaningful upside” is what investors want to hear. I can only guess that the share price would have reacted negatively if he had said that lowering the cost to serve is becoming more difficult (or something pointing in that direction).
Valuation
I will value Amazon by using a sum-of-the-parts approach. But let’s start by getting some general valuation things out of the way. Amazon currently trades at $178.85 per share, and there are 10,610 million shares outstanding as of Q4 23. So the market capitalization amounts to $1.9 trillion.
AWS
I will start with AWS. In last year’s article, I assumed the following 17% CAGR FCF growth for 7 years, 6% CAGR into perpetuity, and a 10% discount rate. This would value $1 of AWS FCF at $50 per share. So using these estimates, AWS should be worth 50x FCF, undoubtedly a high valuation multiple. I also assume that AWS might be able to deliver cash conversion rates somewhere between 60-100% in the future. So at the midpoint of 80%, AWS should be worth somewhere around 40x Earnings, also a high valuation multiple. This time I will look at forward numbers.
AWS revenue came in at $90,757 million in 2023. Since I expect 17% revenue growth going forward, AWS could be able to generate around $106.2 billion in revenue in 2024. As I highlighted earlier, we can expect operating margins in line with the all-time highs of around 30%. I will just assume 30% for now. In this scenario, AWS might generate somewhere around $32 billion in operating income in 2024. Assuming a tax rate of 21%, net earnings could come in at $25 billion.
So if I assume 40x Earnings as a reasonable multiple, AWS should be worth around $1 trillion on FY2024 earnings.
Amazon retail
By deducting this hypothetical $1 trillion from the $1.9 trillion market capitalization, the market seems to value Amazon retail at $900 billion.
Amazon retail revenue came in at $484 billion in FY2023. Assuming around 10% revenue growth for FY2024, FY2024 revenue could come in at somewhere around $530 billion. The all-time high operating margin for this segment stands at 2.7% in FY2020. Let’s be bullish and assume an operating margin of 3.5% for 2024, way above the all-time high that we have seen in the past (I think that this isn’t unreasonable). This would put the operating income for Amazon retail at $18.5 billion and the net earnings at $14.65 billion (assuming a tax rate of 21%).
A $900 billion valuation for Amazon retail divided by $14.65 billion forward earnings would put the Amazon retail segment at a forward P/E of 61.4, a very high valuation multiple.
Bringing it together / Conclusion
The implied valuation multiples look very high. There might be several reasons for this. I might be undervaluing AWS by assuming lower growth rates than we will see or underestimating the possibility of future margin expansion. Maybe I underestimated the significant margin expansion that will take place at Amazon retail.
I have been thinking about this for quite some time and concluded that Amazon is simply trading on future margin expectations. The current valuation can’t be explained with current or one-year forward earnings numbers, so the only explanation can be that the market is pricing in significant margin expansion over the next few years, especially for the retail segment. This is further undermined by the fact that the severe share price decline we have seen in 2022 (and also the share price trading sideways the two years before that) fell into a timeframe where Amazon reported severely declining “core gross margins” or as the management calls it “cost to serve”. This might have been a coincidence, but I highly doubt it.
Since I am not confident in predicting possible margin expansion going forward, I remain neutral on Amazon, expressed by my “hold” rating. Looking back now, Amazon was a clear buy when I last covered it in March 2023, especially as my predictions for 2023 were rather accurate. Back then, I estimated that Amazon retail might be trading somewhere around 30x earnings (with my operating margin estimate for 2023 of 2.6%). Would I buy Amazon today at such a valuation? Probably yes, but it is easy to say when looking in the rear-view mirror.
At the end of the day, an investment in Amazon today is a statement of confidence in future margin expansion. I might come to the same conclusion (that Amazon was a clear buy as of today) when I write my next update sometime next year, in March. It will come down to margin performance and management comments on the possibility of further margin expansion throughout the year.
Analyst’s Disclosure: I/we have a beneficial long position in the shares of MSFT either through stock ownership, options, or other derivatives. I wrote this article myself, and it expresses my own opinions. I am not receiving compensation for it (other than from Seeking Alpha). I have no business relationship with any company whose stock is mentioned in this article.
Disclaimer: Any material in this article should not be relied on as a formal investment recommendation. Never buy a stock without doing your own thorough research.
Seeking Alpha’s Disclosure: Past performance is no guarantee of future results. No recommendation or advice is being given as to whether any investment is suitable for a particular investor. Any views or opinions expressed above may not reflect those of Seeking Alpha as a whole. Seeking Alpha is not a licensed securities dealer, broker or US investment adviser or investment bank. Our analysts are third party authors that include both professional investors and individual investors who may not be licensed or certified by any institute or regulatory body.
