
Summary:
- Previous assessment: Initially rated Adobe as a “hold” due to fair valuation at $595.7 and potential annual returns of 14-15%, based on Q3 2023 data.
- Recent stock performance: The stock fell post Q1 2024 earnings due to a slightly softer Q4 revenue forecast.
- Revenue growth and market dynamics: Adobe Creative Cloud’s 40.81% annual revenue growth since 2014 and the expanding creator economy signal robust potential.
- Valuation and future outlook: DCF model projects a fair price of $660.81 and a 2029 price of $1,213.98, suggesting 34.2% upside and 24.4% annual returns, bolstering the “strong buy” rating.
Sundry Photography
Thesis
In my previous article about Adobe, Inc. (NASDAQ:ADBE) I rated the stock as a hold citing that the stock had reached fair valuation when it was trading at $595.7 and the potential annual returns oscillated between 14-15% which was not a very favorable risk-reward situation. Since that article, the stock has fallen by 19.68% and the price now stands at $492.46, with the main cause being the slightly below-estimate forecast Adobe issued for Q2 2024.
My previous article was released just before Q4 2023 earnings, which were released on January 16. This means that the financial data present in my previous article was from Q3 2023, which was released on September 27. The company reported Q1 2024 earnings on March 14, 2024. Analyzing the stock and updating the financial models I have arrived at a fair price of $660.81 and a future price for 2029 of $1,213.98. Therefore I concluded that an opportunity has opened and I will upgrade Adobe from “hold” to “strong buy”.
Seeking Alpha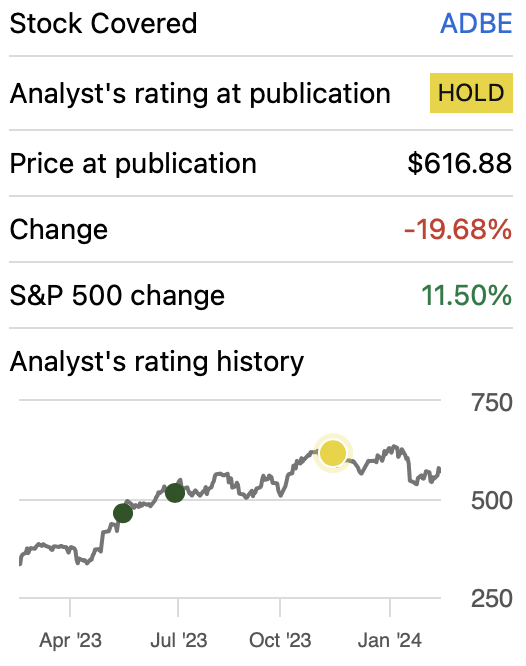
Overview
Growth Plans
Adobe’s growth plan is to keep expanding its addressable market. In 2019 they said that they expected their addressable market to be $128 billion by 2022. So, in short words, Adobe’s strategy is to keep innovating and staying as one of the industry leaders. They may do this via M&As (like the one they attempted with Figma) or directly launching more products to expand its addressable market. Proof of this is what Adobe’s CEO said in 2022:
Our strategy to empower everyone to imagine and express their ideas, create the world’s best content and applications, and power personalized digital experiences represents a massive market opportunity that will drive Adobe’s next decade of growth.
Now, concerning upcoming products, Adobe hasn’t announced anything of that caliber. Until now Adobe has focused on improving their existing products by adding new functions. The last one was Adobe Photoshop Elements 2024 & Premiere Elements 2024. This update included things such as matching colors, UI improvement, selecting a photo or background with one click, new effects, etc.
How does Adobe Compare against Peers?
Adobe is by far the largest player in the graphic software market. Adobe Photoshop has 41.74% of the market, followed by Adobe InDesign with 26.13% and Adobe Illustrator with 12.24%. If we sum all this up, we get that Adobe’s market share in this market is a massive 80%.
Statista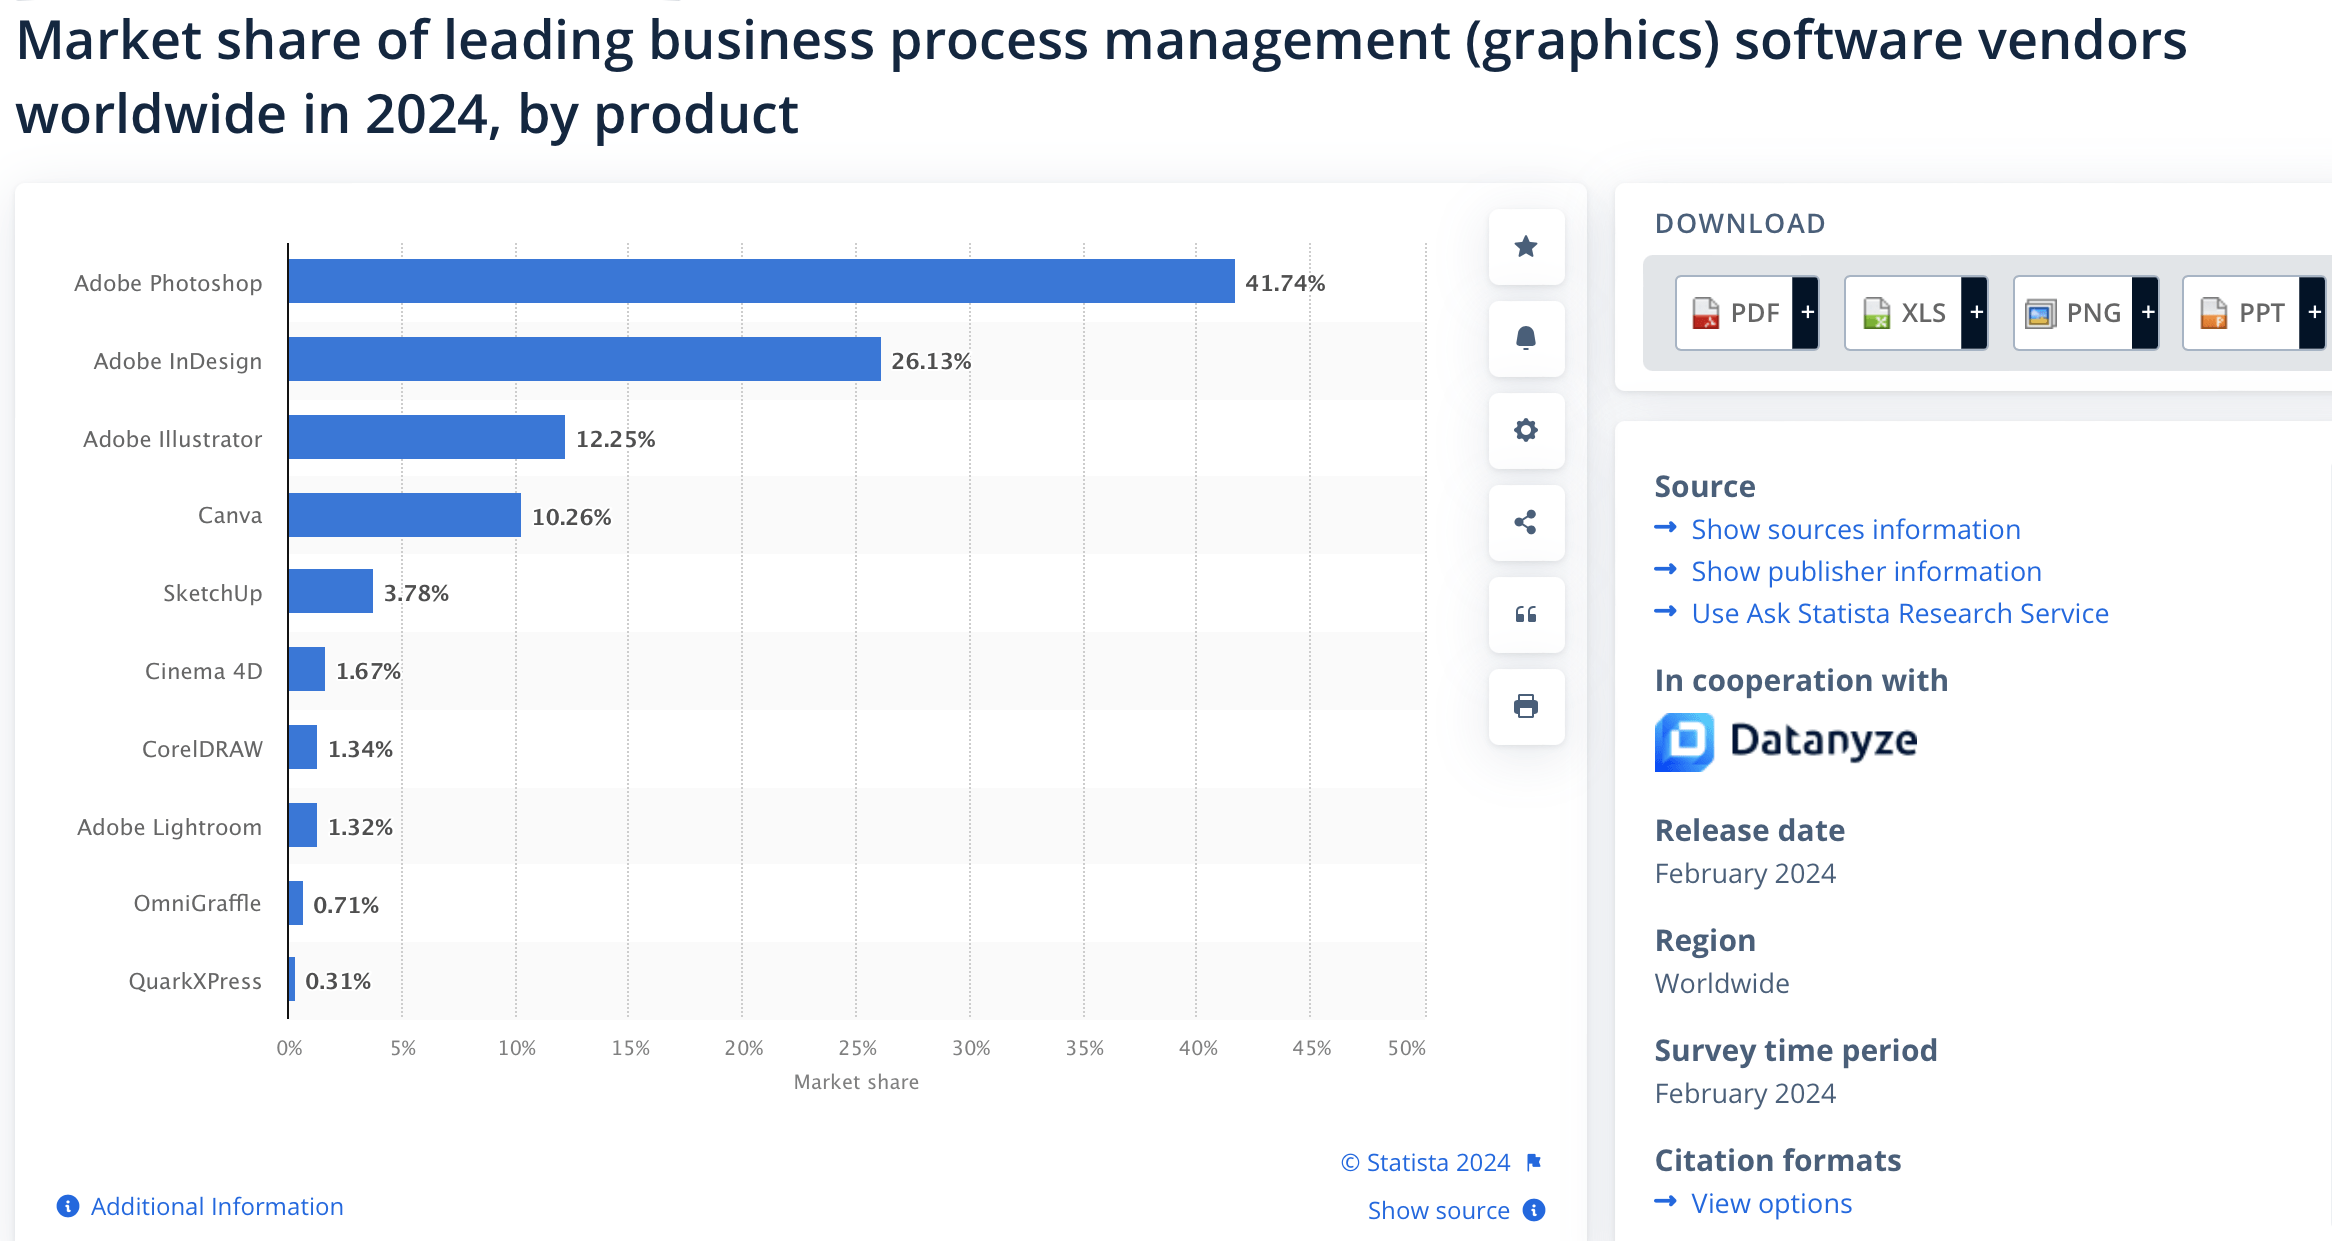
As you can see, the second largest competitor here is Canva which specializes in simple graphic design that users can make with pre-existing models or from scratch. Then its SetUp was bought by Google in 2006 and later sold to Timble in 2012. This software specializes in 3D design.
Nevertheless, those software are not at the level of Adobe because they have a different target audience. Figma is the real competitor here, since in the collaborative design segment, it concentrates around 38.60% of the market. This software centers on the design of UX (user experience) and UI (user interface) as well as supporting vector design. Furthermore, Figma appears to be cheaper than Adobe, since Adobe’s Creative Cloud costs $59.99/month, meanwhile, Figma’s cheapest plan costs €12/month (US$ 13.03/month).
I searched for opinions on Figma and Adobe XD and it looks like Figma is the favorite one because Figma autosaves changes, it releases more features per year than XD, it’s more organized, etc. These opinions guide us to the conclusion that Figma is now the reference in the industry.
Lastly, I think that in the near term, users will opt for a mix of Adobe and Figma because of Adobe’s wide range of offerings (like Premiere Pro, and advanced video editing that Figma does not offer). However Adobe needs to improve its XD software, and I am sure they will, since they acknowledge that Figma can become a formidable competitor, which is the reason why they tried to buy it for $20 billion.
Industry Outlook
Adobe is part of the creator economy, and they published a study on this booming market but only went up to 2022. It’s worth clarifying that I am not saying that the market has not priced this yet, I am just proving that my statement implying that Adobe is part of the creator economy is true. For 2023-2027, the creator economy is expected to grow at an annual rate of 10-22.5% and reach a valuation of $480 billion by 2027.
As previously said, in 2019 they said that they expected their addressable market to be $128 billion by 2022. After that date, Adobe has not released a similar report. The worldwide online advertising market is expected to reach a valuation of $257.97 billion in 2024 and $431.76 billion in 2029. This means that since 2022, Adobe’s addressable market will have been increasing by 33.91% until 2029.
Headwinds
The industry is dependent on advertising spending which, if it’s cut, can lead to Adobe subscriptions being canceled. Nevertheless, it’s expected that for 2024, advertising spending will remain solid. This leaves the industry with no current headwinds. The major risk now is inside the industry since its nature as a light-capital market, is the cause of why many competitors can appear
Financials
In Q1 2024, Adobe beat estimates. More specifically, EPS was $4.48, $0.10 higher than the consensus, and revenue was $5.18 billion, $30 million higher than the consensus. Nevertheless, the stock slumped because the Q2 revenue outlook came out at $5.25-5.30 billion which was lower than the expected $5.31 billion. Nevertheless, EPS estimates came almost in line, since the company anticipates $4.35-4.40 which is close to the estimated $4.37.
My previous article was released just before Q4 2023 earnings, which were released on January 16. After Q3 2023 earnings (which is the earnings report on which my previous article was based), Adobe displayed slightly contracted margins, net income, operating income, free cash flow, and cash reserves. On a TTM basis, revenue increased by 5.56%, operating income decreased by 6.87%, and net income decreased by 6.24%.
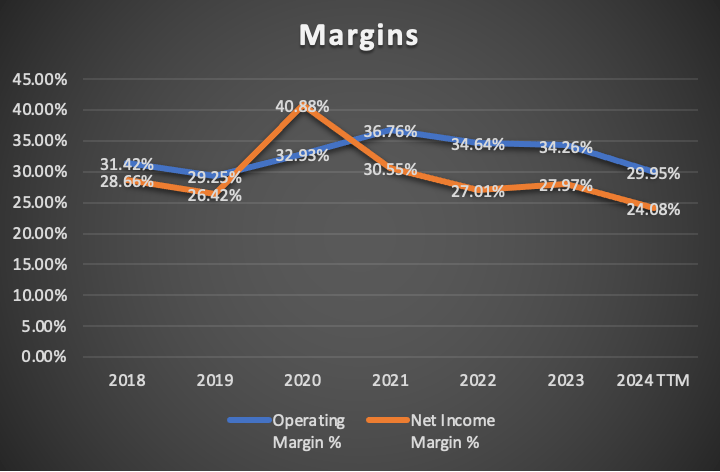
Margins contracted a little bit and now the net operating margin stands at 29.95% down from the previous 33.95% figure, and the net income margin stands at 24.08%, down from the previous 27.12%.
Author’s Calculations Author’s Calculations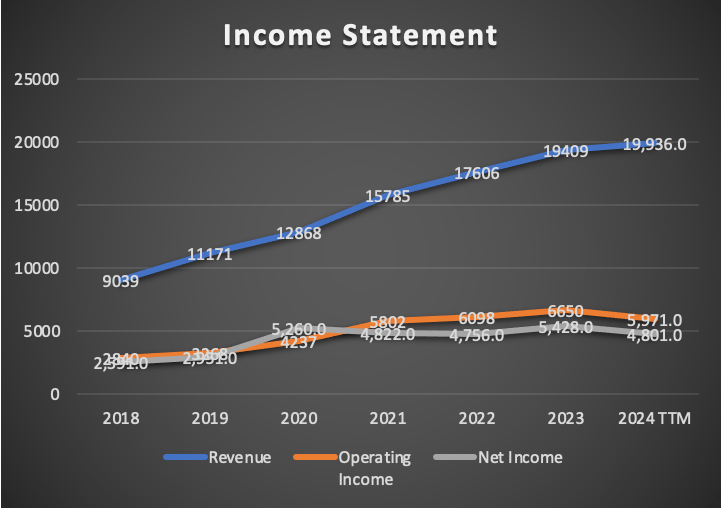
The balance sheet continues to be in excellent condition. Cash reserves decreased to $6.82 billion from Q3’s figure of $7.5 billion. Meanwhile, long-term debt decreased from $3.6 billion to $2.13 billion, and short-term debt increased from $463 million to $1.94 billion. This signals that a portion of the long-term debt has matured.
Author’s Calculations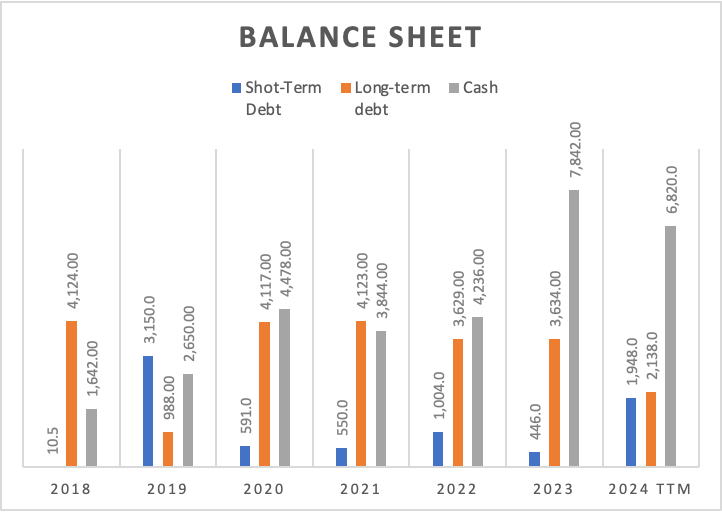
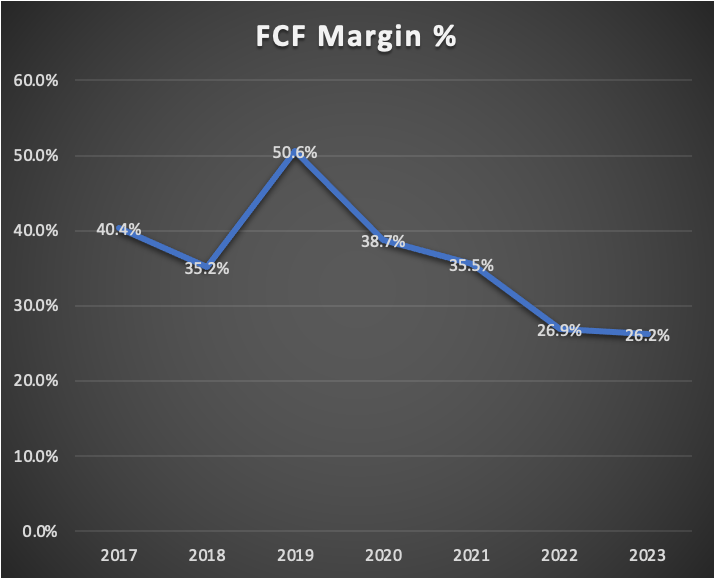
However now comes something concerning, free cash flow decreased from $6.35 billion to $5.22 billion, which is a 17.79% contraction. Because of this, the FCF margin decreased from 33.6% to 26.2%. This was caused by a 7.10% contraction in cash flows from operations which now stand at $6.78 billion, lower than Q3’s $8 billion.
Author’s Calculations Author’s Calculations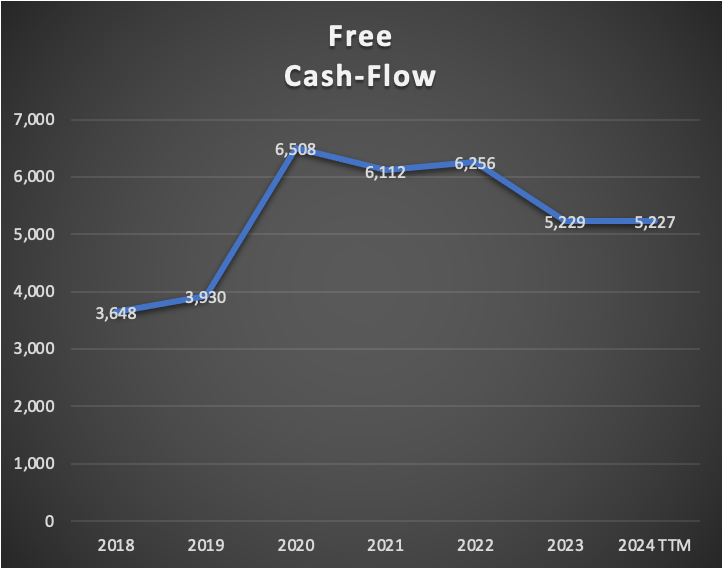
Valuation
In this article, I will value Adobe through a DCF model. The table of assumptions you will see below has all its financial information updated to Q1 2024 on a TTM basis. The WACC was calculated with the already-known formula, and for Adobe it came out at 11.99%. The equity market price is the market cap at the time I started building the model. For a more detailed view of the process, you can see the section labeled “WACC calculation” in the DCF model. You will also see that CapEx and D&A are calculated with a margin tied to revenue. This means that as Adobe earns more, it will spend more.
| TABLE OF ASSUMPTIONS | |
| (Current data) | |
| Assumptions Part 1 | |
| Equity Market Price | 258,150.00 |
| Debt Value | 4,086.00 |
| Cost of Debt | 2.64% |
| Tax Rate | 22.18% |
| 10y Treasury | 4.186% |
| Beta | 1.26 |
| Market Return | 10.50% |
| Cost of Equity | 12.14% |
| Assumptions Part 2 | |
| CapEx | 296.00 |
| Capex Margin | 1.48% |
| Net Income | 4,801.00 |
| Interest | 108.00 |
| Tax | 1,368.00 |
| D&A | 243.00 |
| Ebitda | 6,520.00 |
| D&A Margin | 1.22% |
| Interest Expense Margin | 0.54% |
| Revenue | 19,936.0 |
22.5% Subscriber Growth
The first step is predicting pricing. Adobe Creative Cloud started at $50 per month when launched in 2012. Since then the price has been increasing by 1.81% annually until today’s $59.99 per month. Therefore I will imply throughout the projection that Adobe will continue to increase its pricing at 1.81% annually.
The second aspect is Adobe’s customer base. Since 2014, revenue has been growing at 40.81% annually which indicates that there has been a growth in the customer base over the years. In 2017 Adobe had around 12 million subscribers and it’s estimated that at the end of 2023, Adobe had around 33 million subscribers. This is a huge 29.16% annual growth in the user base since 2017. However for 2024-2029, I will use a 22.5% growth rate which is in line with the expected growth of the “creator economy”, and 9.16% lower than the historical growth rate of Adobe’s user base.
| User Base (In millions) | Pricing (In USD) | |
| 2023 | 33.00 | 59.99 |
| 2024 | 39.60 | 61.08 |
| 2025 | 47.52 | 62.18 |
| 2026 | 57.02 | 63.31 |
| 2027 | 68.43 | 64.45 |
| 2028 | 82.11 | 65.62 |
| 2029 | 98.54 | 66.81 |
Finally, the net income will be calculated using the 2017-2023 net income margin average, which is around 29.24%. Adobe’s net income margin peak was in 2020 when this margin touched the 40.88% mark with the help of a $1.08 billion tax credit, which just happened this year because of the Pandemic and all the relief measures being taken by the US government. Adobe’s tax rate currently sits at 20.16%.
| Revenue | Net Income | Plus Taxes | Plus D&A | Plus Interest | |
| 2024 | $24,676.2 | $7,215.32 | $8,815.34 | $9,116.12 | $9,224.12 |
| 2025 | $31,111.2 | $9,096.92 | $11,114.20 | $11,414.98 | $11,526.54 |
| 2026 | $38,973.0 | $11,395.71 | $13,922.76 | $14,397.80 | $14,513.05 |
| 2027 | $48,577.9 | $14,204.19 | $17,354.03 | $17,946.14 | $18,065.20 |
| 2028 | $60,312.5 | $17,635.37 | $21,546.08 | $22,281.23 | $22,404.22 |
| 2029 | $74,648.8 | $21,827.31 | $26,667.60 | $27,577.49 | $27,704.54 |
| ^Final EBITA^ |
Additionally, the model will also suggest the stock price for 2029. This will be done by taking the undiscounted cash flows and then predicting the value of each of the elements that conform to equity. For this last thing, I will imply that long-term debt, short-term debt, marketable securities, and current assets will continue to evolve at the pace displayed in 2021-2023. Which is as follows: short-term debt -6.1%, long-term debt -2.9%, cash & ST Investments 18.8%, and current assets 13.92%. Lastly, interest payments will mirror the -3.3% annual reduction in total debt displayed in 2020-2023.
Author’s Calculations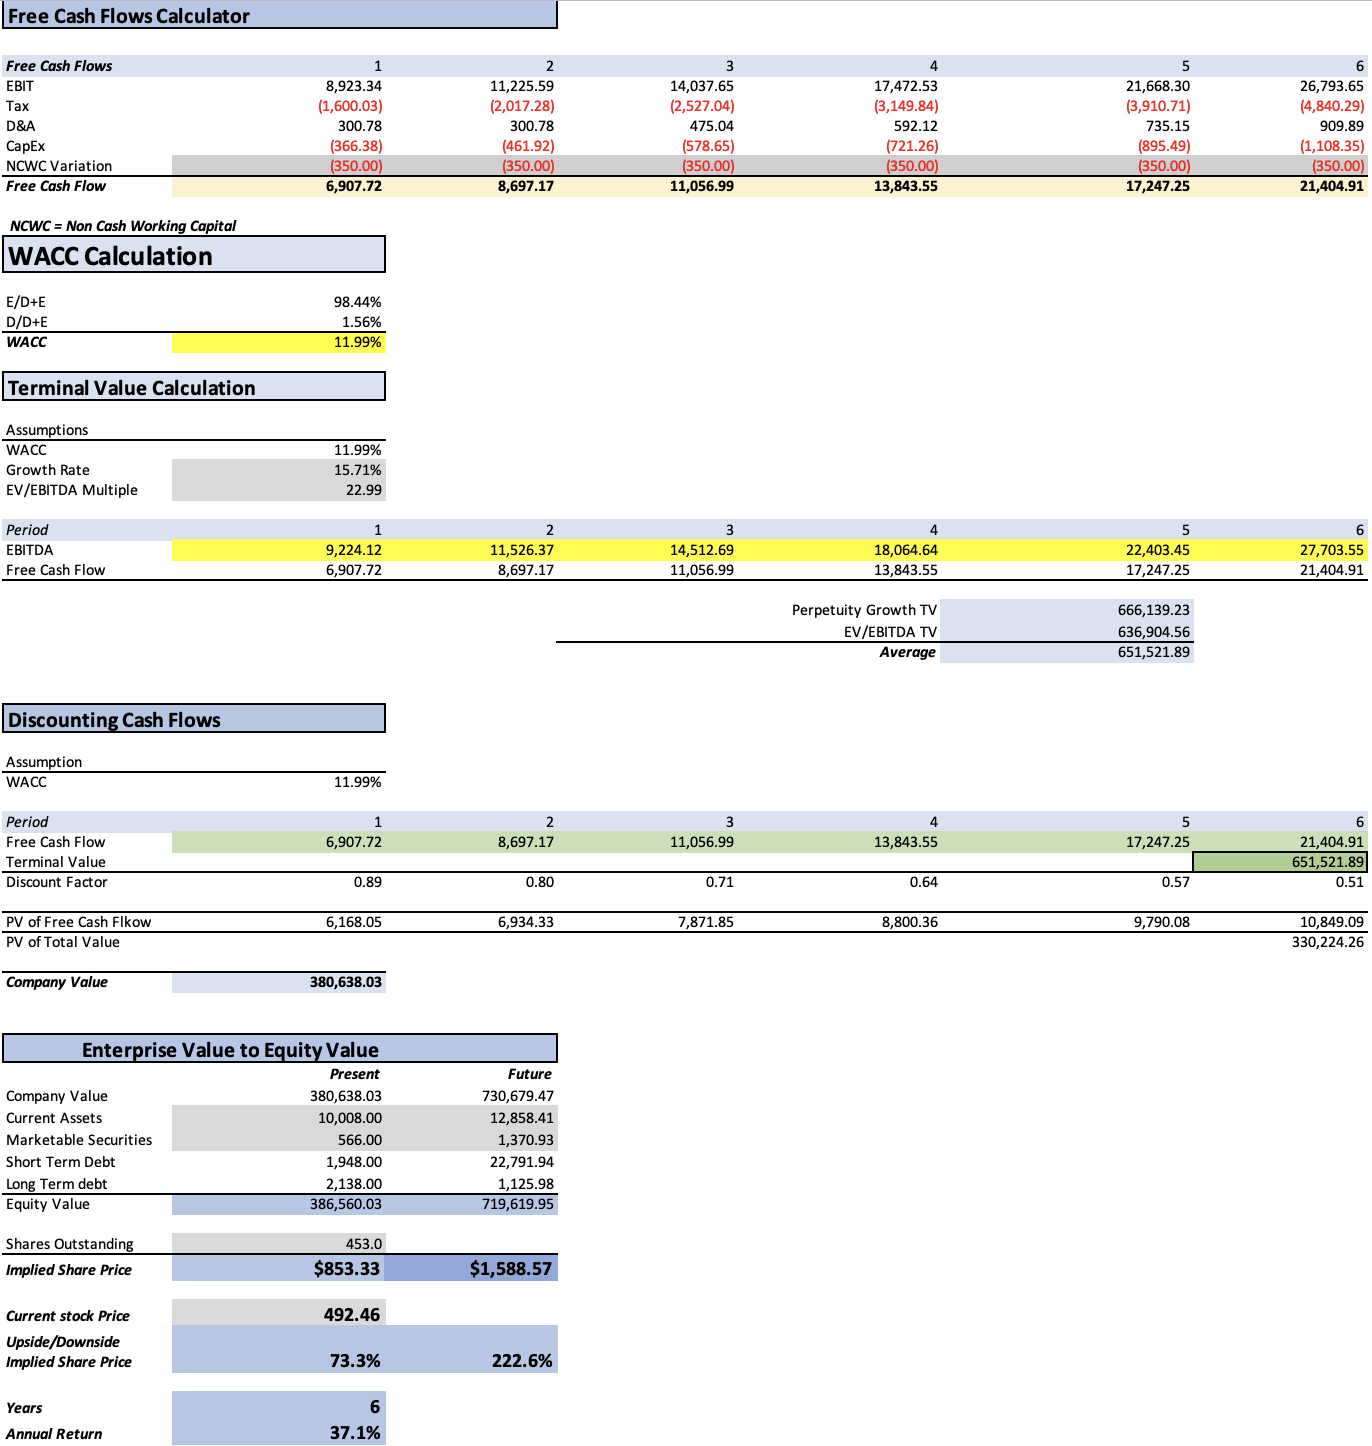
As you can see, the model suggests that Adobe has a considerable upside of 71.3% if it adjusts to the suggested fair price of $853.33. The future price suggested is $1,588.57 which translates into annual returns of 37.1% throughout 2029.
15% Subscriber Growth
In this second scenario, I will make Adobe’s subscriber base grow at a pace of 15% annually. Meanwhile, the pricing growth will stay at the same at 1.81%. As you can see in the table below, this severely reduces the projected customer base of Adobe throughout the years, but it’s more notable in 2029.
Lastly, net income margin will be maintained at 29.24% throughout the projection as well as the other variables concerning D&A, interest expenses, and equity.
| User Base (In millions) | Pricing (In USD) | |
| 2023 | 33.00 | 59.99 |
| 2024 | 37.95 | 61.08 |
| 2025 | 43.64 | 62.18 |
| 2026 | 50.19 | 63.31 |
| 2027 | 57.72 | 64.45 |
| 2028 | 66.37 | 65.62 |
| 2029 | 76.33 | 66.81 |
| Revenue | Net Income | Plus Taxes | Plus D&A | Plus Interest | |
| 2024 | $23,466.9 | $6,861.72 | $8,383.33 | $8,669.37 | $8,777.37 |
| 2025 | $28,217.9 | $8,250.92 | $10,080.60 | $10,366.63 | $10,478.20 |
| 2026 | $33,780.5 | $9,877.42 | $12,067.78 | $12,479.53 | $12,594.78 |
| 2027 | $40,293.3 | $11,781.75 | $14,394.40 | $14,885.54 | $15,004.59 |
| 2028 | $47,918.5 | $14,011.37 | $17,118.45 | $17,702.52 | $17,825.52 |
| 2029 | $56,846.2 | $16,621.84 | $20,307.80 | $21,000.70 | $21,127.75 |
| ^Final EBITA^ |
Author’s Calculations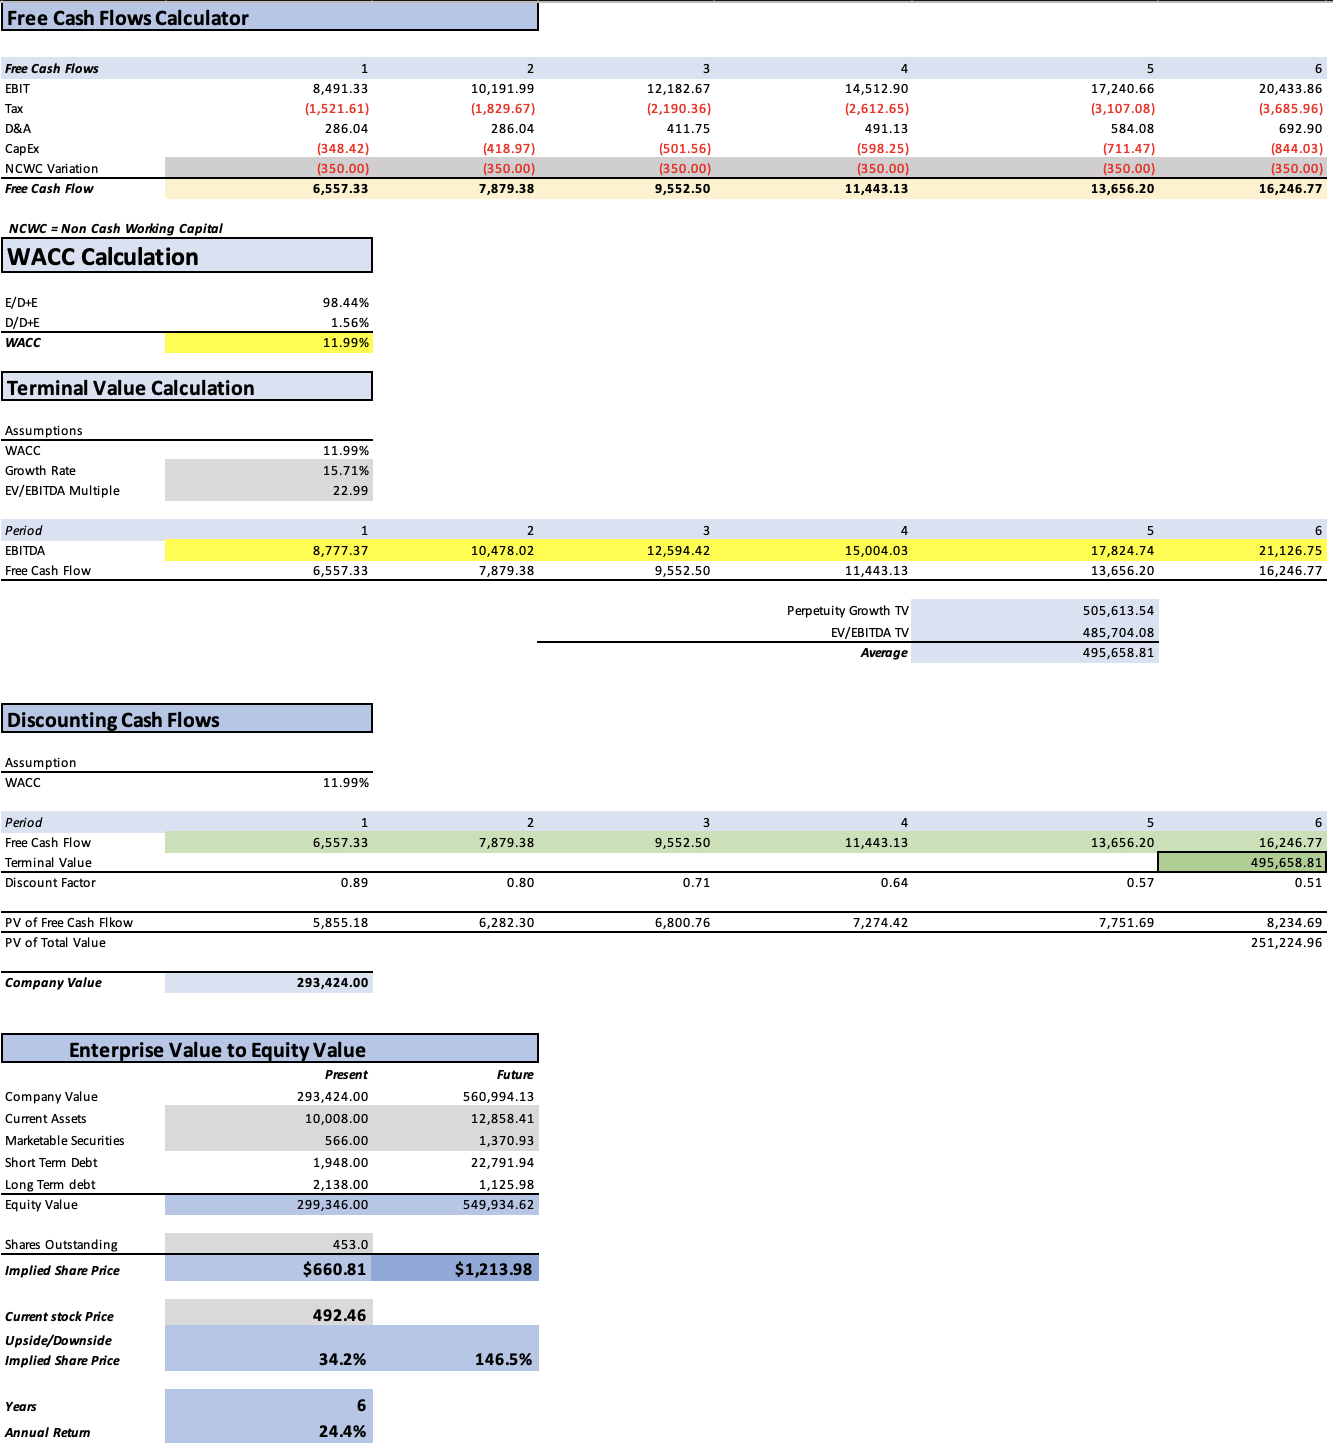
As you can see, this model is more conservative than the previous one by suggesting a significantly lower upside of 34.2% (which is still high). The suggested fair price is $660.81 and the future price for 2029 stands at $1,213.98. This last one implies annual returns of 24.4% throughout 2029.
How do My Estimates compare to the Average Consensus?
If I were to do a model completely based on average estimates, I would arrive at a fair price of $625.05 (which is a 26.9% upside from the current stock price of $492.46) and a future price of $1,139.18 (which translates into annual returns of 21.9% throughout 2029).
The results yielded by my models are lower for the years 2024 and 2025, however, in the case of the second model, It continues to be lower until 2027. From this, we can conclude that the first model is very optimistic, however, since for years 2024 and 2025 its results are lower than the average consensus, nothing is impeding Adobe from following this path and surprising us in 2026. Nevertheless, the second model already suggests a very good upside of 34.2% if the stock price adjusts to the suggested fair price of $660.81. Furthermore, it suggests a future price of $1,213.98 which translates into annual returns of 24.4% throughout 2029.
Author’s Calculations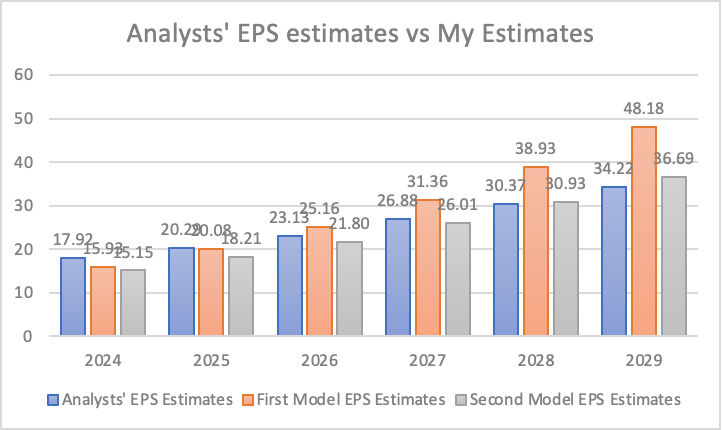
Lastly, in the graph below you will be able to observe the evolution of my fair & future price suggestions throughout my previous articles until this one. As you can see, since my first fair price of $490.99, the fair price has grown by 34.60%.
Author’s Calculations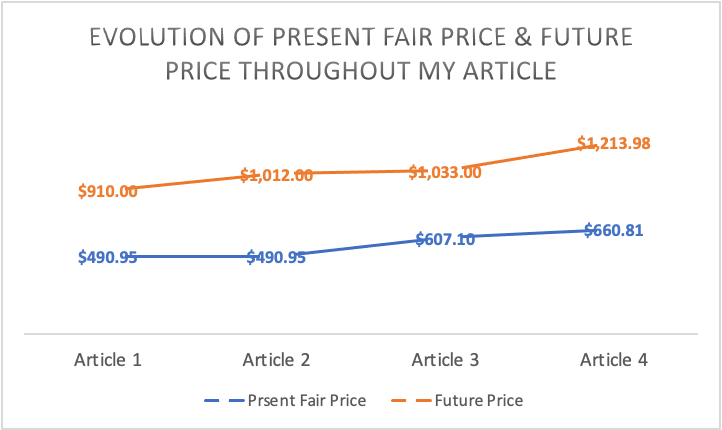
There have been two reasons for this. The first one relates to the continuous quarterly beats of Adobe. The second one is because all valuation models will be updated by taking out the year 2023 from the projections and adding the year 2029. This will cause the amount of cash flows will display an overall increase in the models. This has a simple explanation: in 2029 Adobe should generate more cash flows than in 2023.
Outlook
I expect Adobe to register a revenue of $23.4 billion for 2024 and $28.21 billion for 2025. This will be followed by EPS of $15.08 and $18.13 for 2024 and 2025 respectively. The driver of this growth will be a 1.81% increase in its Creative Cloud subscription, which would increase the pricing from $59.99 to $61 for 2024 and $62.18 for 2025. As previously said, this has been the historic price hike of Adobe, and they will do it because they need to keep up with inflation as any other company. Furthermore, I expect the subscriber base to grow by 15% for 2024 and 2025, which would bring the total customer base to 43.64 million by 2025.
Risks to Thesis
The main risk currently is sentiment, which is directly driven by the fact that Figma is now a competitor and that many people rate it as better than Adobe XD. This is putting a downward force on Adobe’s stock.
Nevertheless, as displayed by my estimates, Adobe has 3 years in which it can report lower-than-expected estimates. This helps in giving the company time to improve its software so it can compete with Figma.
Furthermore, this should have been seen coming because the software industry is very light on capital which makes it easy for entrepreneurs to start in this sector without worrying much about funding.
I don’t see any other major risk since software, as previously said, is very light on capital, which means that Adobe will not have trouble financing its main activity. This same reason makes it also difficult for Adobe to damage its net income margin, for this the company would need to make several wrong decisions.
Conclusion
Adobe currently offers a huge opportunity to capitalize on the pessimism that followed the slight miss in the Q2 2024 forecast. According to my model, Adobe has a 34.2% upside if it adjusts to the fair price of $660.81. Furthermore, the stock has a future price for 2029 of $1,213.98, which translates into 24.4% annual returns throughout 2029.
In my assessment of how Figma will affect Adobe’s business, I concluded that it will take Figma some time to catch Adobe in what concerns the variety of its software, which will buy Adobe some time to improve Adobe XD and become a formidable competitor to Figma. I am sure Adobe will be fine since the norm in the software industry has been the ease of competitors to appear due to it being light on capital, and if Adobe has survived these many years, it will probably continue to survive.
For these reasons, I am upgrading the stock to “strong buy” from my previous “hold” rating and I will continue to maintain this rating until Adobe fails to continue growing its user base or Figma becomes too strong and starts to aggressively take market share from Adobe
Analyst’s Disclosure: I/we have no stock, option or similar derivative position in any of the companies mentioned, but may initiate a beneficial Long position through a purchase of the stock, or the purchase of call options or similar derivatives in ADBE over the next 72 hours. I wrote this article myself, and it expresses my own opinions. I am not receiving compensation for it (other than from Seeking Alpha). I have no business relationship with any company whose stock is mentioned in this article.
Seeking Alpha’s Disclosure: Past performance is no guarantee of future results. No recommendation or advice is being given as to whether any investment is suitable for a particular investor. Any views or opinions expressed above may not reflect those of Seeking Alpha as a whole. Seeking Alpha is not a licensed securities dealer, broker or US investment adviser or investment bank. Our analysts are third party authors that include both professional investors and individual investors who may not be licensed or certified by any institute or regulatory body.