
Summary:
- Qualcomm Incorporated’s sustainable growth outlook includes anticipated growth in the Handset segment, Automotive segment, and IoT fueled by Wi-Fi advancements and Qualcomm’s entry into ARM-based CPUs.
- Qualcomm’s Automotive segment has experienced robust growth, with a 30% average growth rate over the past four years and a 24.8% growth rate in 2023.
- Qualcomm has gained market share in the ADAS automotive semiconductor market, outperforming its competitors and closing the gap with market leader Intel Mobileye.
JHVEPhoto
In our previous analysis of QUALCOMM Incorporated (NASDAQ:QCOM), we delved into its potential for its sustained growth outlook. Firstly, we projected the Handset segment, particularly buoyed by its dominance in the premium smartphone market, to maintain a forward average growth rate of 10.2% and anticipated a sustainable growth trajectory driven by the continued proliferation of 5G technology. Secondly, we foresaw a consistent expansion in the Automotive segment, propelled by the increasing adoption of Advanced Driver Assistance Systems (ADAS) and strategic partnerships. Lastly, our outlook included sustained growth in the Internet of Things (“IoT”) segment, fueled by advancements in Wi-Fi technology, diverse applications in Extended Reality (XR), and Qualcomm’s foray into ARM-based CPUs.
In this analysis, we focused on Qualcomm’s Automotive segment to delve into the company’s growth outperformance. Looking at the breakdown of the company’s revenue below, we observed robust growth in its Automotive segment over the past four years, boasting the highest average growth rate of 30% compared to its other segments.
Even in 2023, when all other segments experienced declines, Automotive growth remained resilient, recording a growth rate of 24.8%. Moreover, its revenue share has consistently risen, climbing from 3% in 2020 to 5% in 2023. Firstly, we examined the revenue and market share growth of this segment. Additionally, we delved into its new partnerships with top automaker customers. Finally, we assessed the competitive advantages of its Snapdragon Automotive Platform over its competitors.
|
Revenue Breakdown ($ mln) |
2020 |
2021 |
2022 |
2023 |
Average |
|
Handset |
12,533 |
20,477 |
28,825 |
22,570 |
|
|
Growth % |
13.0% |
63.4% |
40.8% |
-21.7% |
23.9% |
|
Automotive |
714 |
1,098 |
1,500 |
1,872 |
|
|
Growth % |
4.4% |
53.8% |
36.6% |
24.8% |
29.9% |
|
IoT |
3,246 |
5,443 |
7,351 |
5,940 |
|
|
Growth % |
13.3% |
67.7% |
35.1% |
-19.2% |
24.2% |
|
QTL |
5,028 |
6,320 |
6,358 |
5,306 |
|
|
Growth % |
9.5% |
25.7% |
0.6% |
-16.5% |
4.8% |
|
QSI |
36 |
45 |
31 |
28 |
|
|
Growth % |
-76.3% |
25.0% |
-31.1% |
-9.7% |
-23.0% |
|
Reconciling items |
1,974 |
182 |
134 |
104 |
|
|
Total |
23,531 |
33,566 |
44,200 |
35,820 |
|
|
Growth % |
-3.1% |
42.6% |
31.7% |
-19.0% |
13.1% |
Source: Company Data, Khaveen Investments.
Automotive Segment Market Share Growth
|
Automotive Segment Revenue Comparison ($ mln) |
2019 |
2020 |
2021 |
2022 |
2023 |
Average |
|
Mobileye (Intel) (INTC) |
879 |
967 |
1,386 |
1,869 |
2,079 |
|
|
Growth % |
10.0% |
43.3% |
34.8% |
11.2% |
24.9% |
|
|
Nvidia (NVDA) |
700 |
536 |
566 |
903 |
1,080 |
|
|
Growth % |
-23.4% |
5.6% |
59.5% |
19.6% |
15.3% |
|
|
Qualcomm |
684 |
714 |
1,098 |
1,500 |
1,872 |
|
|
Growth % |
4.4% |
53.8% |
36.6% |
24.8% |
29.9% |
|
|
NXP (NXPI) |
4,212 |
3,825 |
5,493 |
6,879 |
7,447 |
|
|
Growth % |
-9.2% |
43.6% |
25.2% |
8.3% |
17.0% |
|
|
Texas Instruments (TXN) |
3,020 |
2,892 |
3,852 |
5,007 |
5,956 |
|
|
Growth % |
-4.2% |
33.2% |
30.0% |
19.0% |
19.5% |
|
|
Total |
9,495 |
8,934 |
12,396 |
16,158 |
18,434 |
|
|
Growth % |
-5.9% |
38.7% |
30.4% |
14.1% |
19.3% |
Source: Company Data, Khaveen Investments.
From the table above, Qualcomm’s revenue increased significantly over the years, with the highest average growth rate among all at 29.9% and 10% higher than the average total revenue growth of all companies. Furthermore, Intel Mobileye’s (MBLY) revenue growth also exhibited strong growth with an average growth of 24.9% followed by Texas Instruments (19.5%). In addition, Qualcomm’s growth rate in 2023 was twice the average growth rate, indicating a strong performance compared to the market. In particular, management attributed its growth to the “increased content in new vehicle launches with our Snapdragon digital chassis platform.”
Company Data, Khaveen Investments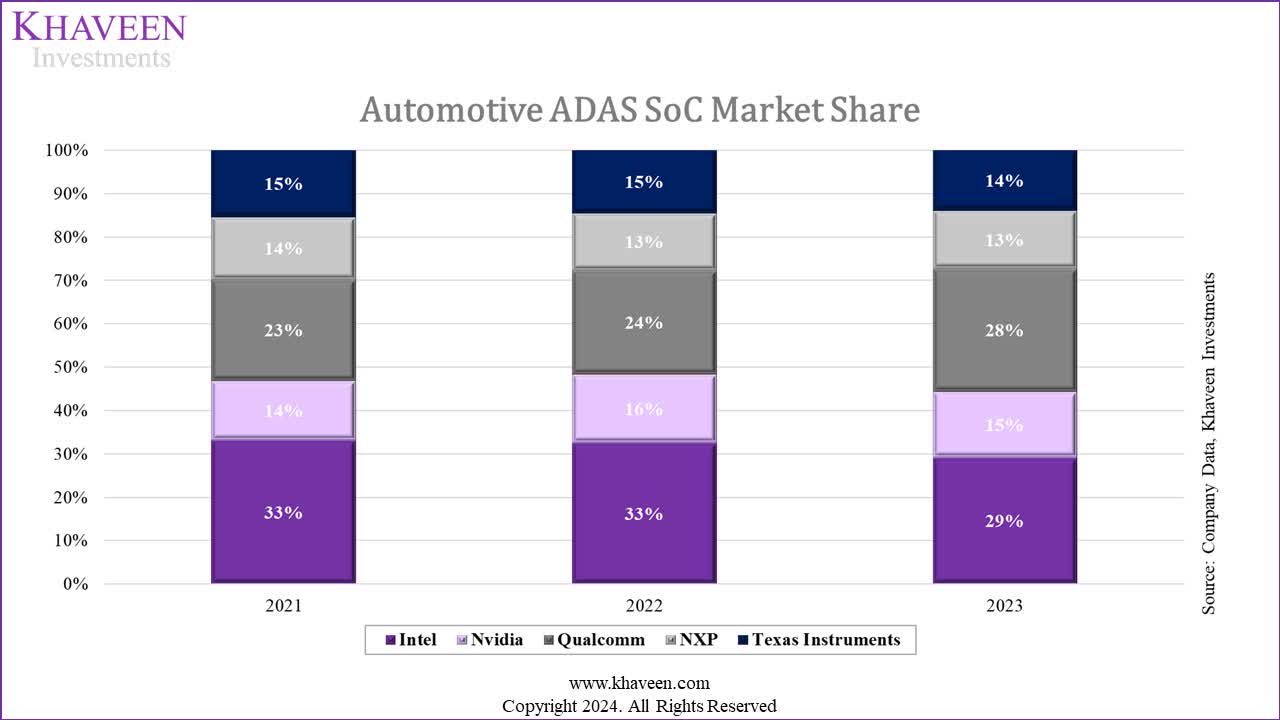
We compiled and calculated the market share of the top Automotive ADAS SoC companies above. Based on the chart, Qualcomm has been gaining market share with a 5% share increase in the past 2 years. Despite remaining the market leader, Mobileye’s market share has eroded to 29% in 2023 compared to 33% in the previous year. Overall, Qualcomm is closing the gap with market leader Intel Mobileye in the ADAS automotive semicon market, outperforming its overall top competitors with a growth rate of 24.8%, the highest among its competitors. Going forward, we believe the automotive ADAS market growth outlook with a market forecast CAGR of 18.7% bodes well for Qualcomm as we previously highlighted that “the share of Level 1 to 2 ADAS is expected to increase from 50% to 65% of total vehicles from 2021 to 2027 whereas the share of Level 3 to 5 is projected to reach 5% from 0% in 2021.” As automakers continue to advance their development of higher level ADAS equipped vehicles, for example, Mercedes’ introduction of a Level 4 ADAS system in its 2024 S-class models, we believe the market growth outlook in ADAS remains promising and sustainable.
Partnerships and Product Pipeline Growth
Next, we examined Qualcomm’s automotive customers as it recently announced various new partnerships such as with BMW (OTCPK:BMWYY) and Hyundai (OTCPK:HYMTF) for Snapdragon Digital Chassis and Snapdragon Automotive Cockpit Platform advancements in their vehicles.
Number of Customers
|
Company |
Total Automaker Customers |
|
Mobileye (Intel) |
50+ (+12) |
|
Nvidia |
26 (-1) |
|
Qualcomm |
59 (+40) |
|
NXP |
14 (+6) |
|
Texas Instruments |
35 (+0) |
Source: Company Data, Khaveen Investments.
In the table above, we updated the number of automakers that have agreements with Qualcomm and its competitors. Qualcomm and Mobileye (Intel) have the most automaker agreements with Qualcomm having 59 identified customers from its presentation. However, Qualcomm has outpaced Mobileye in terms of customer growth, having added 40 new brands since our previous analysis of Intel, including various emerging EV automakers such as BYD Company (OTCPK:BYDDF), ZEEKR (ZK), XPeng (XPEV) and Xiaomi Auto (OTCPK:XIACF), based in China, the largest EV market globally (60% share of sales). Additionally, from its latest earnings briefing, management highlighted 75 new automotive models launched with Qualcomm technologies.
Top Automaker Customer Share
|
Top 10 automakers by Automobile Market Share |
Mobileye (Intel) |
Nvidia |
Qualcomm |
NXP |
Texas Instruments |
|
Toyota (TM) |
13.2% |
13.2% |
|||
|
Volkswagen Group (OTCPK:VWAGY) |
10.4% |
10.4% |
10.4% |
10.4% |
|
|
Stellantis (STLA) |
7.6% |
7.6% |
7.6% |
||
|
General Motors (GM) |
7.5% |
7.5% |
|||
|
SAIC |
6.7% |
||||
|
Ford (F) |
5.3% |
5.3% |
5.3% |
||
|
Honda (HMC) |
5.1% |
5.1% |
|||
|
Hyundai |
5.0% |
5.0% |
|||
|
Nissan (OTCPK:NSANY) |
4.1% |
||||
|
FAW |
4.0% |
4.0% |
|||
|
Total |
43.7% |
45.3% |
40.9% |
30.8% |
18% |
Source: Khaveen Investments.
We compiled data on the market share of the top 10 automakers from 2022 and determined which of them have contracts with Qualcomm and its competitors. Our analysis shows that the top automakers’ market share for Nvidia is the highest, edging out Mobileye and Qualcomm in third. One major reason for Qualcomm’s difference is attributed to Toyota, which we could not identify any partnership with from 2022 and is significant as it is the largest automaker in the world. That said, Qualcomm is the only U.S. chipmaker with 2 top U.S. companies which are General Motors and Ford.
Overall, we believe Qualcomm’s strong performance in 2023 for its automotive segment growth of 24.8% which outperformed the overall market is reflected by the company’s huge increase in the number of automaker customers. We believe this highlights a factor for the company’s automotive revenue growth outperformance in 2023 and indicates that Qualcomm has a competitive advantage which we examine in the following section.
That said, based on their new partnerships with the top 10 automakers, Nvidia has the largest share of top automaker customers combined including Toyota, Volkswagen and Stellantis. However, Nvidia still underperformed its competitors with the lowest growth, which may indicate other factors such as the strength of partnerships.
Snapdragon Platform Advantage
In this point, we examine whether Qualcomm has any competitive advantage in terms of its stack of automotive platform solutions and product performance advantage. The diagram below shows the company’s Snapdragon Digital Chassis which consists of various of its automotive product families including Snapdragon Auto Connectivity, Snapdragon Cockpit Platform, Snapdragon Car-to-Cloud and Snapdragon Ride.
Qualcomm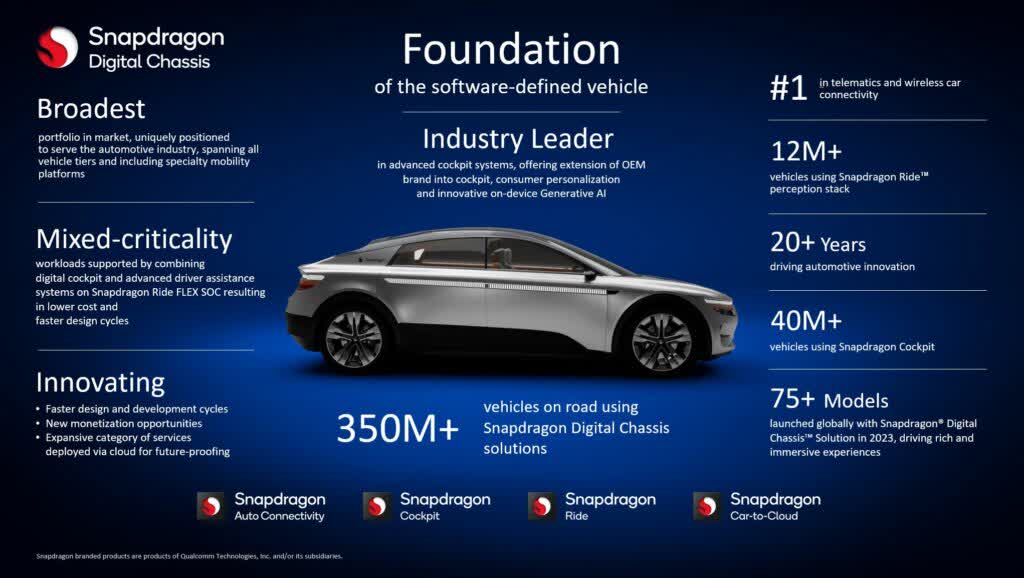
The Snapdragon Auto Connectivity platform is designed to enhance vehicle connectivity and V2X technologies, allowing autonomous vehicles to establish communication with both other vehicles and infrastructure. The Snapdragon Cockpit Platform and Snapdragon Car-to-Cloud consist of infotainment and telematic system products whereas the Snapdragon Ride represents its ADAS processing solution. To determine whether Qualcomm has a full stack advantage, we compared the company with its competitors below.
|
Company |
Connectivity (V2X) |
Infotainment & Telematics (Digital Cockpit) |
Processing/ Control (Domain Controller) |
Vision (Sensor/ Camera/ Radar) |
Software Capabilities |
|
Chips/Chipsets |
Wi-Fi, RF-Modem, Bluetooth |
Processor |
SoC |
LiDAR/Radar Sensors |
Mapping Software, RSS Framework, Robotaxi |
|
Mobileye (Intel) |
N/A |
N/A (SYNC) |
Yes (EyeQ) |
Yes (True Redundancy) |
Yes (REM, RSS Framework, Robotaxi) |
|
Nvidia |
N/A |
Yes (NVIDIA DRIVE Infotainment) |
Yes (Nvidia DRIVE) |
N/A (Sony, onsemi, Omnivision) |
Yes (DRIVE Map, RSS Framework) |
|
Qualcomm |
Yes (Snapdragon Auto Connectivity) |
Yes (Snapdragon Cockpit Platform, Snapdragon Car-to-Cloud) |
Yes (Snapdragon Ride) |
N/A (Luminar) |
Yes (Vision-Enhanced Precise Positioning, RSS Framework) |
|
NXP |
Yes (NXP V2X Communications) |
Yes (eCockpit) |
Yes (S32R) |
Yes (TEF Radar Transceivers) |
N/A (Zendar) |
|
Texas Instruments |
N/A |
Yes (Digital cockpit controller) |
Yes (Jacinto) |
Yes (AWR) |
N/A |
Source: Company Data, Khaveen Investments.
Based on the table above, Qualcomm and NXP are tied with the broadest product breadth encompassing. For Qualcomm, its products span connectivity, infotainment, processing and software capabilities such as Vision-Enhanced Precise Positioning and RSS Framework. Whereas NXP has all product categories except for mapping and RSS software capabilities. Overall, our analysis shows that Nvidia (Processing and Infotainment) and Mobileye (Processing and Vision) both only focus on limited areas whereas Qualcomm has a wider breadth as it is in Processing, Infotainment and Connectivity, which is in line with findings from a Motley Fool analysis. Additionally, we compared the performance capabilities of their ADAS platform below in terms of their topline ADAS SoCs.
|
Company |
Max ADAS Level Support |
Process |
Cores |
|
Mobileye (Intel) |
Level 4 |
7nm |
8 |
|
Nvidia |
Level 5 |
7nm |
12 |
|
Qualcomm |
Level 5 |
4nm |
16 |
|
NXP |
Level 2+ |
28nm |
7 |
|
Texas Instruments |
Level 3 |
16nm |
6 |
Source: Company Data, Khaveen Investments.
Based on the table above, Qualcomm edges out its competitors with the advanced process node and highest core counts, though both Qualcomm and Nvidia are tied as their chipsets support up to Level 5 ADAS.
|
Company |
Product Breadth |
Performance |
Average |
Factor Score |
|
Mobileye (Intel) |
5 |
3 |
4 |
0.8 |
|
Nvidia |
3 |
2 |
2.5 |
1.1 |
|
Qualcomm |
1 |
1 |
1 |
1.5 |
|
NXP |
1 |
5 |
3 |
1.0 |
|
Texas Instruments |
3 |
4 |
3.5 |
0.9 |
Source: Khaveen Investments.
All in all, we believe Qualcomm has an advantage with its Snapdragon Digital Chassis platform. In the table above, we derived a factor score based on product breadth and performance rankings of each company. We ranked Qualcomm as tied as the top in terms of product breadth with NXP due to its broad categories encompassing connectivity, infotainment, vision and software capabilities as well as the top ranking for performance with its advanced process node and core count enabling high-level ADAS capabilities. Based on this, we derived a factor score of 1.5x which we applied to the ADAS market CAGR of 18.7% to project Qualcomm’s automotive segment growth of 28.1%.
|
Qualcomm Revenue Projections ($ bln) |
2024F |
2025F |
2026F |
2027F |
|
Total IoT |
7,412 |
9,023 |
11,143 |
13,450 |
|
Growth % |
22.0% |
21.7% |
23.5% |
20.7% |
|
Handset |
25,785 |
28,603 |
31,240 |
33,663 |
|
Growth % |
13.0% |
10.9% |
9.2% |
7.8% |
|
Automotive |
2,283 |
2,923 |
3,743 |
4,793 |
|
Growth % |
28.1% |
28.1% |
28.1% |
28.1% |
|
QTL |
6,355 |
6,641 |
6,941 |
7,253 |
|
Growth % |
4.5% |
4.5% |
4.5% |
4.5% |
|
QSI |
28.3 |
26.1 |
24.1 |
22.2 |
|
Growth (%) |
-7.8% |
-7.8% |
-7.8% |
-7.8% |
|
Reconciling items |
134 |
134 |
134 |
134 |
|
Total Qualcomm |
41,998 |
47,351 |
53,225 |
59,315 |
|
Growth (%) |
13.7% |
12.7% |
12.4% |
11.4% |
Source: Company Data, Khaveen Investments.
As seen in our projections which we retained since our previous analysis with a revision to its Automotive segment, we expect the company’s Automotive segment growth to be superior to all other segments with higher growth than its larger IoT and Handset segments. However, its Automotive segment contribution to its total revenue remains fairly minor but we see it rising to 8% of total revenues by 2027, supporting the company’s total growth.
Risk: Stronger Competition
We believe one of the risks to the company’s automotive segment growth is stronger competition from key competitors such as Nvidia which has been releasing newly updated products with better performance capabilities such as NVIDIA Drive Thor with TOPS of 2,000 similar to Qualcomm’s Snapdragon Ride Flex. Furthermore, as highlighted above, Nvidia has a higher top 10 automaker customers market share than Qualcomm. Moreover, Nvidia is a GPU market leader which could provide it with an advantage in ADAS SoCs which feature its GPU components. While stronger product developments may affect Qualcomm’s performance standing, we believe it remains advantageous in terms of having wider exposure not only in ADAS but also connectivity, infotainment and software which it integrates with.
Verdict
Khaveen Investments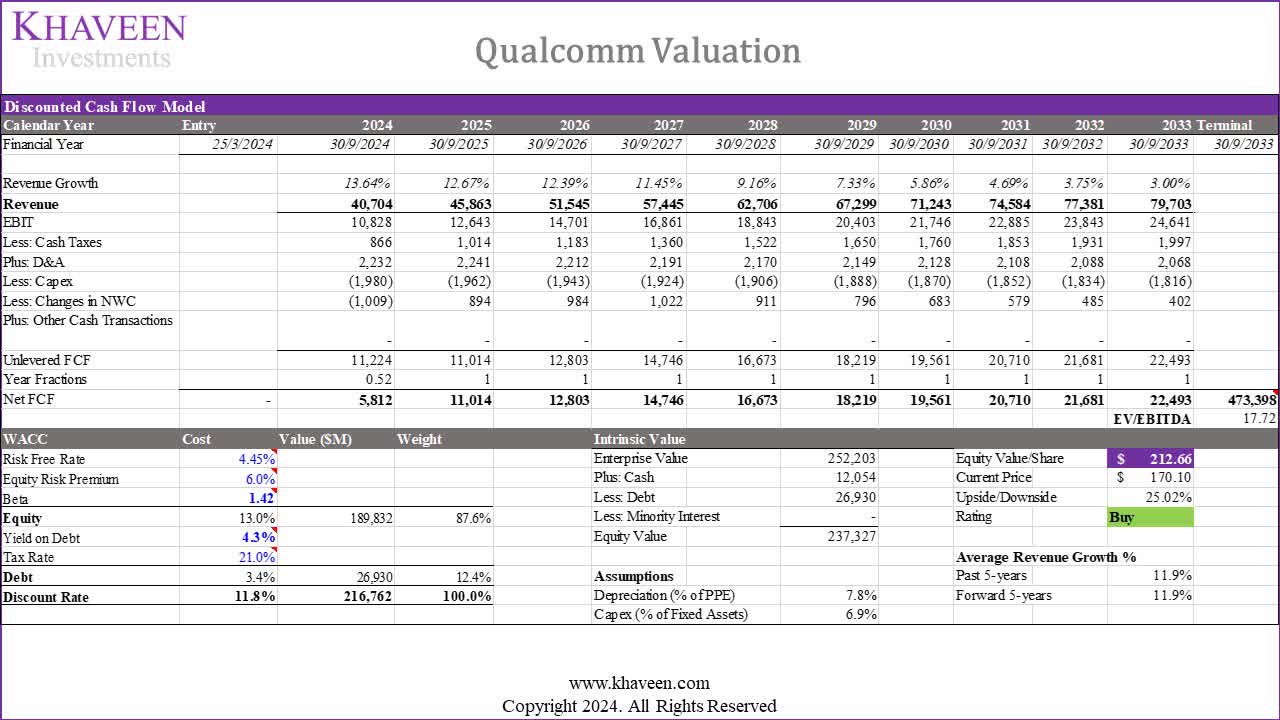
Based on a discount rate of 11.8% (company’s WACC), we derived an upside of 25.02% based on a 5-year average US-only chipmaker EV/EBITDA of 17.72x of 17.72x (excluding high growth companies with 20%+ average)
All in all, we believe Qualcomm is rapidly closing the gap with ADAS automotive semicon market leader Intel Mobileye, boasting a 28% market share in 2023 and the highest growth rate among competitors at 24.8%. We believe Qualcomm’s robust performance is driven by the positive outlook of the automotive ADAS semiconductor market, as well as a significant increase in automaker customers underscoring Qualcomm’s competitive advantage, contributing to its outperformance in its Automotive segment growth in 2023. We also believe Qualcomm’s strength lies in its Snapdragon Digital Chasis platform, ranking top in both product breadth and performance metrics, leading to a competitive factor score of 1.5x, projecting Qualcomm’s automotive segment growth at 28.1%.
Overall, we believe Qualcomm’s strategic positioning and product capabilities position it favorably for continued success in the ADAS semicon market. Based on an updated discounted cash flow (“DCF”) valuation, we derived a price target of $212.66 which is fairly in line compared to our previous price target ($207.78). Our revision to the company’s total revenue projections that reflects updated Automotive segment growth (28.1%) is only minor due to the relatively small contribution of its Automotive segment (6% of total revenue in 2024). Thus, we rate Qualcomm Incorporated as a Buy with a lower upside of 25% compared to 82% previously, as its stock price has already risen by 51% since.
Analyst’s Disclosure: I/we have a beneficial long position in the shares of QCOM either through stock ownership, options, or other derivatives. I wrote this article myself, and it expresses my own opinions. I am not receiving compensation for it (other than from Seeking Alpha). I have no business relationship with any company whose stock is mentioned in this article.
No information in this publication is intended as investment, tax, accounting, or legal advice, or as an offer/solicitation to sell or buy. Material provided in this publication is for educational purposes only, and was prepared from sources and data believed to be reliable, but we do not guarantee its accuracy or completeness.
Seeking Alpha’s Disclosure: Past performance is no guarantee of future results. No recommendation or advice is being given as to whether any investment is suitable for a particular investor. Any views or opinions expressed above may not reflect those of Seeking Alpha as a whole. Seeking Alpha is not a licensed securities dealer, broker or US investment adviser or investment bank. Our analysts are third party authors that include both professional investors and individual investors who may not be licensed or certified by any institute or regulatory body.