Summary:
- Thesis & Performance: Previous analysis suggested a fair price of $137.6; Q3 2024 earnings beat estimates, affirming my “strong buy” recommendation.
- Financial Overview: Q3 2024 earnings reported revenue of $8.1B and EPS of $1.30, surpassing estimates, with steady growth in net income despite segment year-to-date underperformance.
- Two valuation models presented: analyst estimates suggests a $178.12 fair price (107.5% upside), meanwhile the conservative model projects a $126.09 fair price (46.9% upside).
- Risks & Conclusion: I acknowledge the risks concerning EPS revisions and market sentiment, nevertheless I maintain my “strong buy” rating, expecting significant upside even if Medtronic maintains current growth rates.
Bloomberg/Bloomberg via Getty Images
Thesis
In my previous article about Medtronic plc (NYSE:MDT), released in I assigned a fair price of $137.6 which at the time indicated a 71.82% upside. The reason for this targets was because I updated my models following Q2 2024 released in November 30, 2023, and I explained how weight loss drugs will not affect Medtronic. This last one drove me to upgrade Medtronic from “buy” to “strong buy”. So far, my thesis has materialized, since Medtronic reported Q3 2024 and it beat estimates, which means that weight loss drugs didn’t eat at Medtronic’s market share.
In this article I will update my models with the available financial data from Q3 2024 released in February 20 2024. According to my models, a rally in Medtronic’s stock is (at least in theory) almost guaranteed since the most conservative model suggests an upside of around 46.9% and annual returns of 21.2% throughout 2029. Nevertheless, available analysts’ estimates suggest an even higher upside of 107.5% and annual returns of 36.8% throughout 2029.
Furthermore, Estimates are currently at the lowest point, which means upward revisions will boost sentiment, which would help the stock in the near-term.
Performance of the Stock Since My Previous Article (Seeking Alpha)
Overview
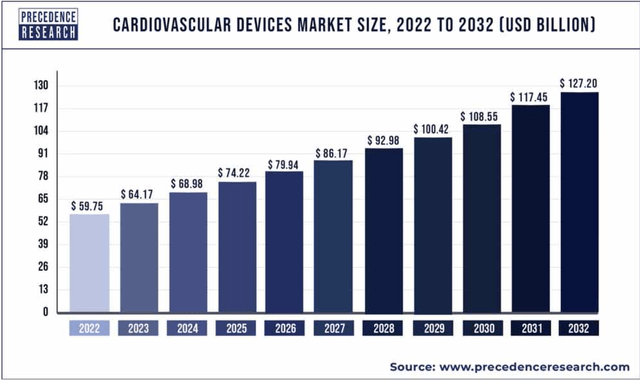
The most important market for Medtronic is cardiovascular, which is responsible for around 36.20% of revenues. However, the dependance is not enormous, which means that if other segments outperform then they can drive the company’s profit upward by themselves without the need of cardiovascular outperforming. The cardiovascular devices market is expected to maintain a decent single-digits CAGR of 7.9% throughout 2032.
If we observe the caption below from Q3 2024, we will observe that on a year-to-date basis, Medtronic has reported a growth in its cardiovascular business of 5.9% 2% lower than the estimated market CAGR. This means that Medtronic is underperforming the market in this segment, however it just needs a little improvement so it can achieve market-perform.
Medtronic Q3 2024 Precedence Research
The second most important market by weight in revenue is Neuroscience, which contributes to 29.11% of Medtronic’s sales. Neuroscience aims to treat conditions in the nervous system, such as pain. For example, Medtronic sells drug infusion systems for chronic pain, spinal cord neurostimulation systems, cranial repairs product, etc.
The neuroscience, market is expected to witness an upward trajectory of 5.95% annually throughout 2027, which means that from all segments, this is the one operating in the slower market. Returning to the Q3 2024 caption, Medtronic’s neuroscience market has grown by 4.8% which is 1.15% lower than the average market CAGR.
Author’s Calculations with base on The Business Research Company
The third most important segment is medical surgical, which is responsible for around 26.55% of revenues. The estimated CAGR for the medical surgical devices market is around 9.4% throughout 2030, which is higher than the 7.9% rate of the cardiovascular devices market. Medtronic is also underperforming in this market, in this case by 2.5% since its medical surgical segment has grown by 5.4% on a year-to-date basis.
Author’s Calculations with base on Grand View Research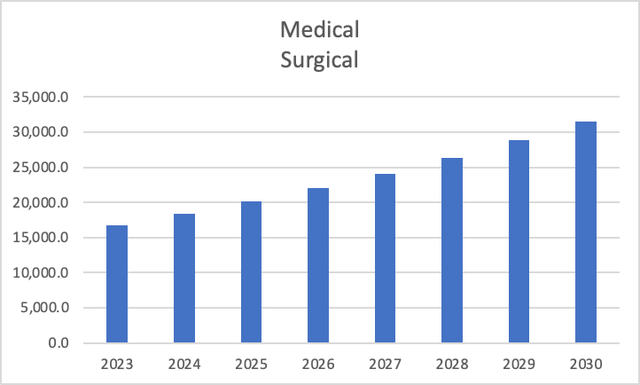
The diabetes segment is the smallest one, contributing to 7.91% of total revenues. However, this segment has grown the most on a year-to-date basis: by 9.7%. Which means that it’s just underperforming by 0.1%, because the diabetes medical devices are estimated to grow at a CAGR of 9.8% throughout 2032.
Financials
In Q3 2024 earnings released on February 20, Medtronic reported revenue of $8.1 billion and an EPS of $1.30 which beat top-line estimate by $150 million and $0.04 respectively. Finally, what finished to cement the rally was the new increased outlook for FY2024. Here Medtronic reported that they expect organic revenue growth to be in the range of 4.75% to 5%, which is far higher than the previous estimate of 2.79%. Furthermore, EPS estimate also was increased to $5.39-$5.21 which is higher by $0.04 than the previous $5.16 estimate.
Diving into the income statement, we will observe that revenue increased by 1.15%, and net income by 2.43%. Meanwhile, operating income decreased by 1.6%. Margins also displayed a small change. Operating margin decreased from 18.88% in Q2 2024, to 18.53%, and net income margin increased from 12.84% to 13%.
This continues to highlight Medtronic’s slow growth, nevertheless it has been steady because, if we go back to 2018, we will observe that net income has been growing by 5.9% annually.
Author’s Calculations Author’s Calculations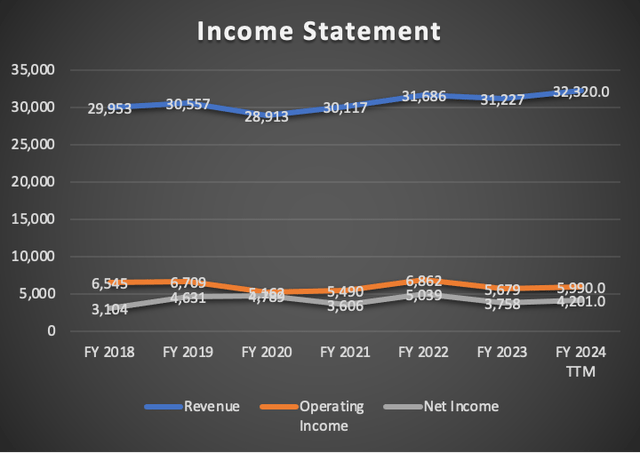
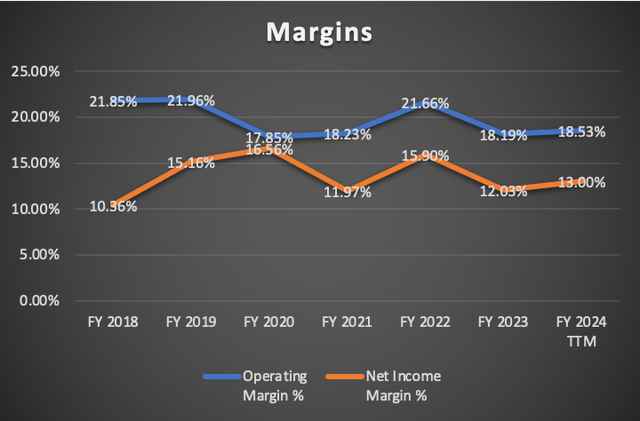
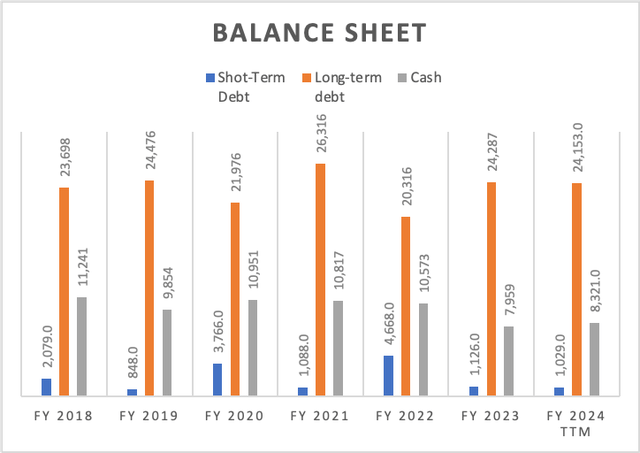
In what concern’s Medtronic financial health, its cash reserves increased from $7.7 billion to $8.3 billion, and short-term debt decreased from $1.39 billion to $1 billion. However long-term debt increased from $23.6 billion to $24.15 billion.
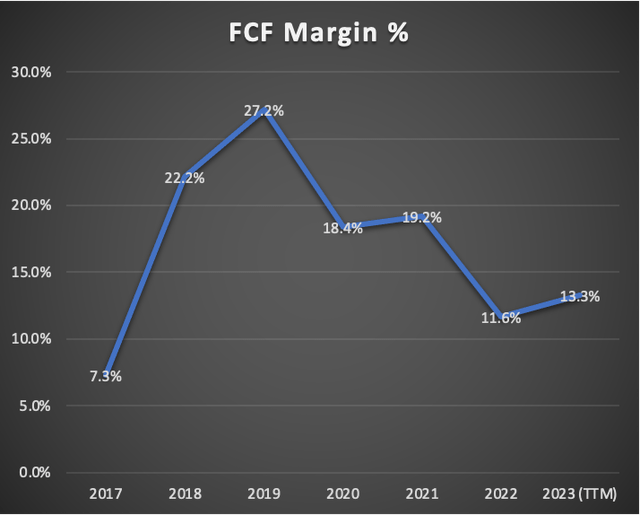
However, the responsible for the rise in Medtronic’s stock was an 8.62% increase in free cash flow since Q2 2024, when the FCF was $3.41 billion. The main factor driving this improvement, was an increase in cash from operations, which passed from $5.57 billion to 6.47 billion. Lastly, the FCF margin increased from 10.7% to 13.3%.
Author’s Calculations Author’s Calculations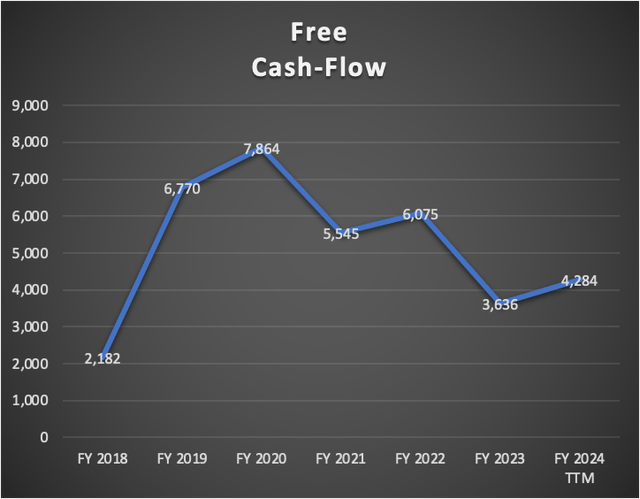
Valuation
In this valuation section, I will perform two valuation models, the first one will be based on available analysts’ estimates and the other one will be partially influenced by market trends. I do this with the objective of getting a low and a high estimate and getting a possible path in which the stock can move.
In the table below you will see all the current available financial data for Medtronic. You can also observe that D&A and CapEx are tied to revenue through a fixed margin, which is the one registered as of Q3 2024.
Finally, each model will suggest the stock price for 2029. This stock price is calculated by taking the undiscounted cash flows and then calculating the equity value by making each of the elements that conform equity evolve at the rate displayed in FY2018-2024. This means that short-term debt will decrease by 8.4% annually, marketable securities by 4.3% (this one is the evolution of total cash reserves), current assets by 1.6%. Lastly, long-term debt will grow at a rate of 0.3%. Lastly, during the FY2018-2024 period, total debt decreased by 0.4% annually, which is the rate I will use to project interest payments.
| TABLE OF ASSUMPTIONS | |
| (Current data) | |
| Assumptions Part 1 | |
| Equity Market Price | 112,225.00 |
| Debt Value | 25,182.00 |
| Cost of Debt | 2.59% |
| Tax Rate | 23.60% |
| 10y Treasury | 4.273% |
| Beta | 0.83 |
| Market Return | 10.50% |
| Cost of Equity | 9.44% |
| Assumptions Part 2 | |
| CapEx | 1,539.00 |
| Capex Margin | 4.76% |
| Net Income | 4,201.00 |
| Interest | 651.00 |
| Tax | 1,298.00 |
| D&A | 2,650.00 |
| Ebitda | 8,800.00 |
| D&A Margin | 8.20% |
| Interest Expense Margin | 2.01% |
| Revenue | 32,320.0 |
Analysts’ Estimates
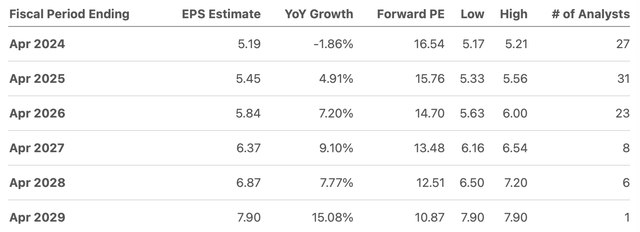
As previously said, this first model will be based on available average estimates which you can find on Seeking Alpha. For FY2024, average estimates indicate an EPS of $5.19 which is a net income of $6.9 billion, and $5.45 for 2025, which is a net income of 7.23 billion. You can observe the rest of EPS estimates in the table below.
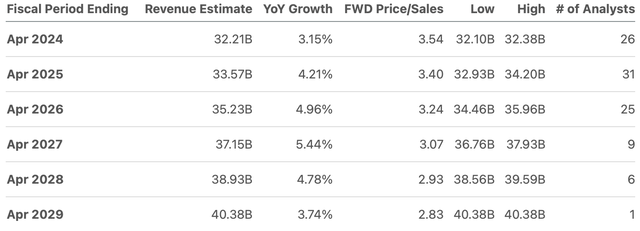
In what concerns revenue, average estimates indicate that for FY2024, Medtronic will generate around $32.21 billion, which is a 3.15% YoY growth. For 2025 Medtronic is expected to generate around $33.57 billion, which is a 4.21% YoY growth.
| Revenue | Net Income | Plus Taxes | Plus D&A | Plus Interest | |
| 2024 | $32,150.0 | $6,901.14 | $8,530.11 | $11,166.17 | $11,813.75 |
| 2025 | $33,520.0 | $7,233.57 | $8,941.00 | $11,577.06 | $12,222.05 |
| 2026 | $35,200.0 | $7,765.45 | $9,598.43 | $12,484.57 | $13,126.97 |
| 2027 | $37,150.0 | $8,456.89 | $10,453.08 | $13,499.11 | $14,138.94 |
| 2028 | $38,930.0 | $9,108.45 | $11,258.43 | $14,450.40 | $15,087.68 |
| 2029 | $40,380.0 | $10,504.63 | $12,984.17 | $16,295.03 | $16,929.76 |
| ^Final EBITA^ |
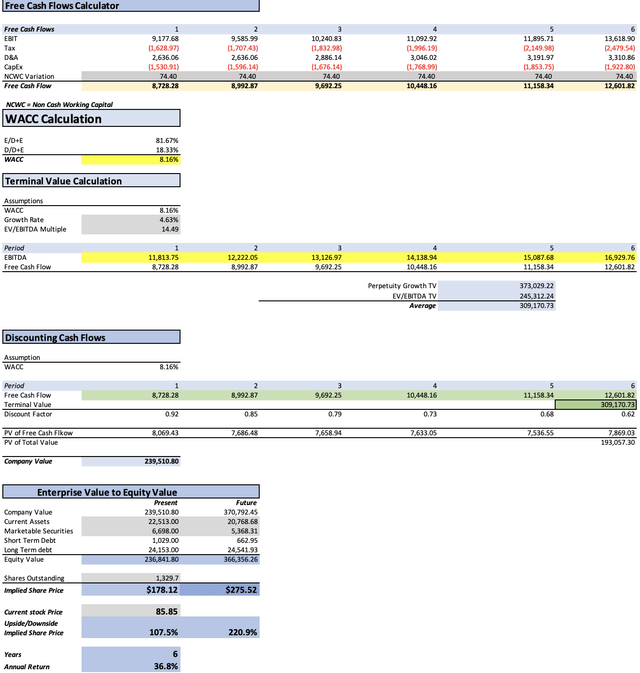
As you can see, this model, based on current average estimates, suggests a fair price of $178.12 which is a 107.5% upside from the current stock price of $85.85. Furthermore, the future price for 2029 suggested by the model is $275.52 which translates into annual returns of 36.8%.
My Estimates
As previously said, this model will be partially influenced by current market trends which means that the revenue of the cardiovascular segment will grow at 7.9%, medical surgical at 9.4%, neuroscience at 5.95%, and diabetes by 9.8%.
| Cardiovascular | Medical Surgical | Neuroscience | Diabetes | |
| FY 2024 TTM | 11,699.8 | 8,581.0 | 9,408.4 | 2,556.5 |
| FY 2025 | 12,624.1 | 9,387.6 | 9,968.1 | 2,807.1 |
| FY 2026 | 13,621.4 | 10,270.0 | 10,561.3 | 3,082.1 |
| FY 2027 | 14,697.5 | 11,235.4 | 11,189.6 | 3,384.2 |
| FY 2028 | 15,858.6 | 12,291.5 | 11,855.4 | 3,715.8 |
| FY 2029 | 17,111.5 | 13,446.9 | 12,560.8 | 4,080.0 |
| % of Revenue | 36.20% | 26.55% | 29.11% | 7.91% |
Lastly, the last step is to project net income. For this I will make it grow at par with revenue by setting a net income margin of 13.57% which is the average net income margin registered in FY2018-FY2024.
| Revenue | Net Income | Plus Taxes | Plus D&A | Plus Interest | |
| 2024 | $32,245.7 | $4,375.74 | $5,408.60 | $8,052.50 | $8,702.01 |
| 2025 | $34,786.9 | $4,720.58 | $5,834.84 | $8,478.75 | $9,125.65 |
| 2026 | $37,534.8 | $5,093.48 | $6,295.76 | $9,373.33 | $10,017.65 |
| 2027 | $40,506.7 | $5,496.77 | $6,794.24 | $10,115.49 | $10,757.23 |
| 2028 | $43,721.4 | $5,933.00 | $7,333.44 | $10,918.27 | $11,557.44 |
| 2029 | $47,199.2 | $6,404.93 | $7,916.77 | $11,786.75 | $12,423.37 |
| ^Final EBITA^ |
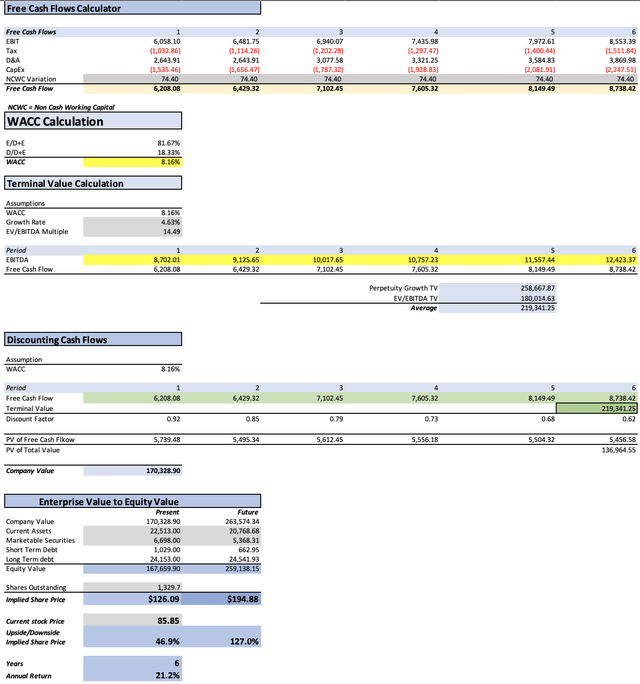
This model is way more conservative than the previous one, which suggested an upside of 107.5%. In contrast, this model suggests an upside of 46.9% and a fair price of $126.09. Finally, the model suggests a future price of $194.88 which translates into annual returns of 21.2% throughout 2029.
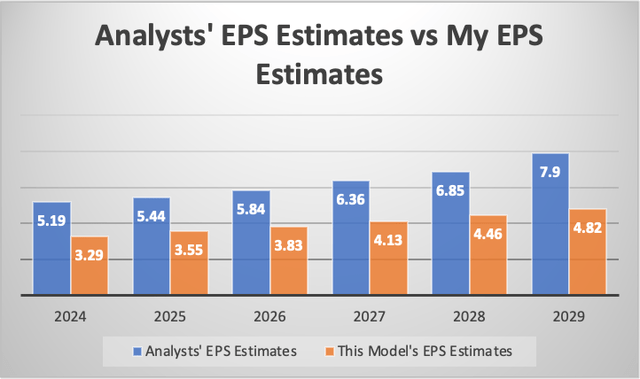
Furthermore, in the graph below you can see that the EPS estimates from this model, are very low when compared to average analysts’ estimates. For instance, EPS for FY 2024 can be 36.6% lower, 34.74% for FY2025, then 34.41% lower for FY2026, and so on.
This means that Medtronic could miss EPS estimates by a huge margin, and it would still be undervalued. This means that Medtronic has no reason to have its stock price suppressed. Finally, if Medtronic does meet average analysts’ estimates, then the rally the stock could witness increases dramatically, as demonstrated by the first DCF model.
What happens if Medtronic maintain the year-to-date growth rates reported in Q3 2024?
As previously said, on a year-to-date basis, all of Medtronic’s segments are underperforming, therefore I think that it would be prudent to create a model in which Medtronic’s segments will continue to underperform.
Starting with revenue, it will grow at the year-to-date growth rates displayed in Q3 2024 for FY 2024. These growth rates are: 5.9% for cardiovascular, 5.4% for medical surgical, 4.8% for neuroscience, and 9.7%n for diabetes. Furthermore, net income will be calculated with the average net income margin displayed in FY2018-2024 which is of 13.57%.
| Cardiovascular | Medical Surgical | Neuroscience | Diabetes | |
| FY 2024 TTM | 11,699.8 | 8,581.0 | 9,408.4 | 2,556.5 |
| FY 2025 | 12,390.1 | 9,044.3 | 9,860.0 | 2,804.5 |
| FY 2026 | 13,121.1 | 9,532.7 | 10,333.2 | 3,076.5 |
| FY 2027 | 13,895.3 | 10,047.5 | 10,829.2 | 3,375.0 |
| FY 2028 | 14,715.1 | 10,590.1 | 11,349.0 | 3,702.3 |
| FY 2029 | 15,583.3 | 11,161.9 | 11,893.8 | 4,061.4 |
| % of Revenue | 36.20% | 26.55% | 29.11% | 7.91% |
| Revenue | Net Income | Plus Taxes | Plus D&A | Plus Interest | |
| 2024 | $32,245.7 | $4,375.74 | $5,408.60 | $8,052.50 | $8,702.01 |
| 2025 | $34,098.9 | $4,627.22 | $5,719.44 | $8,363.35 | $9,010.25 |
| 2026 | $36,063.6 | $4,893.84 | $6,048.99 | $9,005.94 | $9,650.26 |
| 2027 | $38,147.0 | $5,176.54 | $6,398.43 | $9,526.20 | $10,167.94 |
| 2028 | $40,356.5 | $5,476.38 | $6,769.04 | $10,077.98 | $10,717.15 |
| 2029 | $42,700.5 | $5,794.45 | $7,162.19 | $10,663.31 | $11,299.93 |
| ^Final EBITA^ |
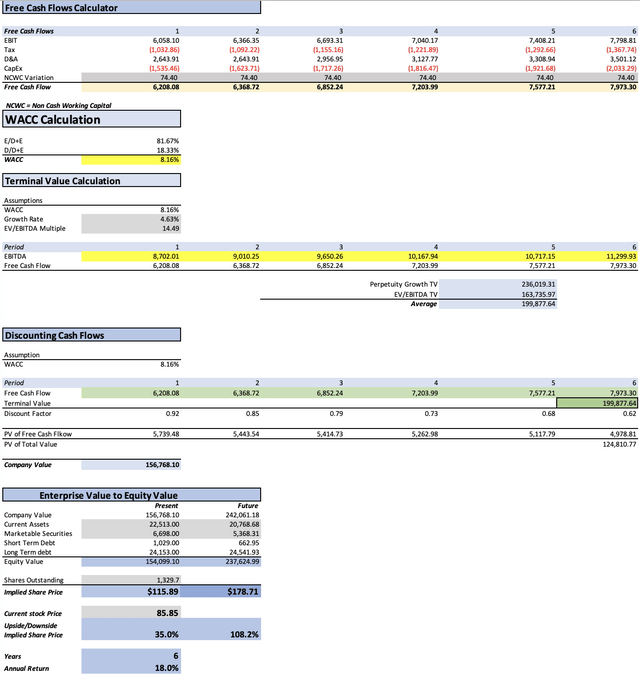
As you can see, Medtronic would still be hugely undervalued even if it continues to underperform the market by maintaining the same year-to-date growth rates for FY2024 released in Q3 2024. The fair price under this scenario would be $115.89 and the future price would stand at $178.71. This means that the stock, if it adjusts to this fair price, would have 35% upside and it would deliver 18% annual returns throughout 2029.
Risks to Thesis
One risk to take into account is that Medtronic, since November 2019 has seen a steady downward revision on EPS, this is the main cause of why the stock price has collapsed since its peak in 2021.
Evolution of Earnings Revisions (Seeking Alpha)
Nevertheless, I think that the EPS estimates are already too low and observing my models I can conclude that the pessimism has gotten out of hand, and now the stock is severely undervalued.
The second risk is market sentiment, because a good company such as Medtronic, an industry leader, that pays a 3.21% dividend, would have quickly adjusted if we were in a full-scale bull market.
Finally, there is the risk that Medtronic in its attempt to cut costs and spin-off underperforming operations, they get rid of a subsidiary that has a great future. This is not supposed to happen, but nothing is impeding it.
Conclusion
In conclusion, Medtronic still maintains the compelling valuation I discussed in my two previous articles. Medtronic comes from beating Q3 2024 earnings estimates which means that the stock could finally gain the required momentum to adjust to the fair price I am projecting, as well as it could revert the downward EPS revision trend that started in November 2019.
The fair price indicated by my conservative model, is around $126.09, a 46.9% upside from the current stock price of $85.85. Additionally, it suggests that the stock will be priced at $194.88 for 2029, which translates into annual returns of 21.2% throughout 2029.
For these reasons, I reiterate my strong buy rating on Medtronic’s stock, and the only event that will make me reconsider my projections is if Medtronic lowers its forecast considerably to the point where the estimates come below those of the third DCF model, which was made assuming that Medtronic maintains the year-to-date growth for FY2024 displayed in Q3 2024.
Analyst’s Disclosure: I/we have no stock, option or similar derivative position in any of the companies mentioned, but may initiate a beneficial Long position through a purchase of the stock, or the purchase of call options or similar derivatives in MDT over the next 72 hours. I wrote this article myself, and it expresses my own opinions. I am not receiving compensation for it (other than from Seeking Alpha). I have no business relationship with any company whose stock is mentioned in this article.
Seeking Alpha’s Disclosure: Past performance is no guarantee of future results. No recommendation or advice is being given as to whether any investment is suitable for a particular investor. Any views or opinions expressed above may not reflect those of Seeking Alpha as a whole. Seeking Alpha is not a licensed securities dealer, broker or US investment adviser or investment bank. Our analysts are third party authors that include both professional investors and individual investors who may not be licensed or certified by any institute or regulatory body.

