Summary:
- General Motors shares have seen a 26.9% increase in the last few months, handily outperforming the S&P 500.
- Analysts’ ratings for General Motors have been mostly “hold” with only a few “buy” or “strong buy” ratings.
- Seeking Alpha’s Quant Rating system gives General Motors a high rating, indicating strong valuation, growth, profitability, momentum, and EPS revisions.
- So far, it looks like the Quant Rating system has it, and shares probably do deserve an upside from here.
jetcityimage
Over the last few months, shares of automotive giant General Motors (NYSE:GM) have been on a real tear. Since I last wrote about the company in the middle of December of 2023, for instance, shares have seen an upside of 26.9%. That dwarfs the 10% increase seen by the S&P 500 over the same window of time. This comes about even as revenue and cash flows have shown signs of weakness. It also makes abundantly clear the fact that analysts don’t always get things right. Of the last 10 articles published on Seeking Alpha about the firm, the most recent having been published on March 18th, and the oldest being published on January 7th, a time in which shares have seen an upside of 27.1% compared to the 11.5% generated by the S&P 500, six have resulted in a ‘hold’ rating for the stock, two have resulted in a ‘buy’, and only two have resulted in a ‘strong buy’.
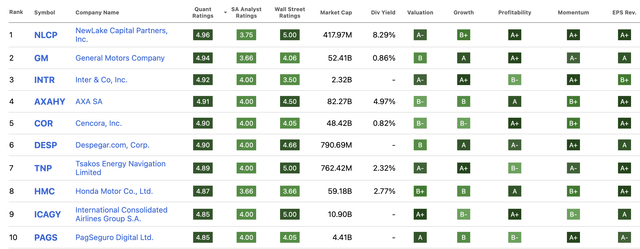
To be perfectly honest with you, I’m not one to talk. After all, my own article on the company rated the business a ‘hold’. In total, the weighting given to General Motors by analysts at Seeking Alpha comes out to only 3.66 on a 1 to 5 scale. When it comes to Wall Street analysts, the rating is only a bit higher at 4.06. However, one source that did get it right was the Quant Rating system that Seeking Alpha promotes. In fact, with a 4.94 on a 1 to 5 scale, the automotive behemoth is the second-highest rated stock right now. This is incredibly bullish. Given this disparity, it might be a wise idea to dig into the ratings a bit more so as to better understand where, at least in this case, the analysts have been wrong.
Diving deeper into General Motors
As you can see in the image above, General Motors is the second-highest-rated stock on the market according to Seeking Alpha’s Quant Rating system. As I pointed out, it has also seen tremendous upside performance compared to the broader market, with its performance outpacing the sentiment that analysts have expressed. But to really understand this, it might be helpful to dig in a bit deeper. The Quant Rating system takes into consideration five primary criteria. The first of these is valuation. According to it, General Motors receives a solid B when it comes to this particular topic.
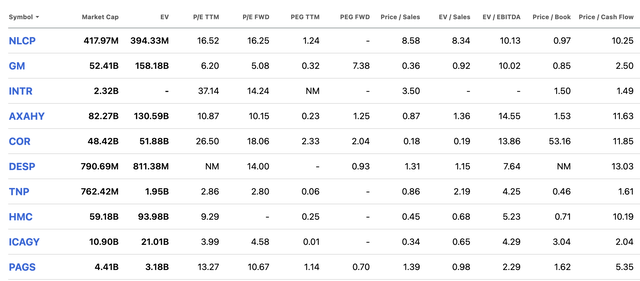
Honestly, I found myself surprised by this rating. I wasn’t surprised because of how high it was. Rather, I was surprised by how low it was. As a value investor, I tend to prioritize valuation above the other four metrics that the Quant Rating system employs. And given how cheap the stock was when I last wrote about it, I would have given it at least an A-, if not better. As you can see in the image below, there are multiple criteria that the Quant Rating system takes into consideration when it comes to valuing a company. This includes the who’s who evaluation metrics. It factors into consideration the market capitalization of the company relative to earnings, cash flows, book value, revenue, and more. It also looks at the PEG ratio and the EV to EBITDA multiple.
Many investors would likely argue that comparing companies that are significantly different from one another is like comparing apples to oranges. While I do believe that cases like this exist, I largely am of the opposite opinion. At the end of the day, for instance, if the present value of cash flows coming from one business makes that company cheaper relative to another business, the first business in question is ultimately the most appealing. The fact of the matter is that, on an absolute basis, General Motors does look very appealing. This is true not only on an absolute basis but also relative to similar firms. In the table below, you can see precisely what I mean. In it, you can see how shares are priced compared to five other major automotive firms. In addition to having a stock that trades in the low to middle single-digit range, the company is also cheaper than all but two of its competitors on a price to earnings basis. This number drops to one of the five when using the price to operating cash flow basis, and it’s tied with one other company as being the second cheapest on an EV to EBITDA basis.
| Company | Price/Earnings | Price/Operating Cash Flow | EV/EBITDA |
| General Motors | 5.2 | 2.7 | 6.3 |
| Ford (F) | 12.3 | 3.6 | 13.7 |
| Stellantis (STLA) | 4.4 | N/A | 1.8 |
| Toyota Motor Corporation (TM) | 10.3 | 11.8 | 8.6 |
| Honda Motor Co. (HMC) | 8.3 | 5.0 | 6.5 |
| Nissan Motor Co. (OTCPK:NSANY) | 5.1 | 2.2 | 6.3 |
The second metric in question is growth. The Quant Rating system looks at growth associated with revenue, profits, cash flows, and a variety of other factors. This is a little more challenging than looking at the picture through the lens of the cash generated by a firm. Having said that, there is no denying that revenue growth achieved by General Motors has been impressive in recent years. We need only look, for instance, from 2022 to 2023 as an example. Sales last year totaled $171.84 billion. That’s 9.6% above the $156.74 billion generated one year earlier.
According to the data provided, growth achieved by General Motors from 2022 to 2023 was driven mostly by two factors. The first was by its GMNA segment, or GM North America. This is the part of the company that focuses on the automotive sales operations of the company. It benefited to the tune of $8.5 billion from higher volume and to the tune of $3.2 billion from increased pricing. The company also saw a combined benefit of $1.4 billion associated with changes in product mix, as well as other miscellaneous factors. This all allowed sales to grow by 10.2% from $128.38 billion to $141.45 billion. Meanwhile, GM Financial sales managed to grow a whopping 11.4% from $12.77 billion to $14.23 billion. As automotive sales increase, so too should demand on the financial service side since financing for vehicle purchases is often needed by consumers.
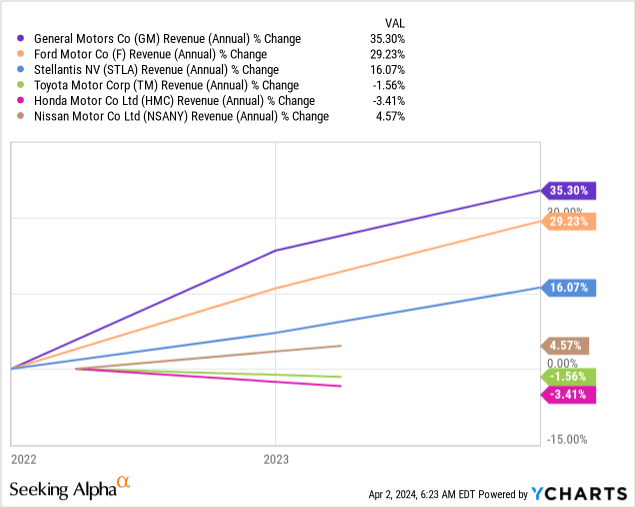
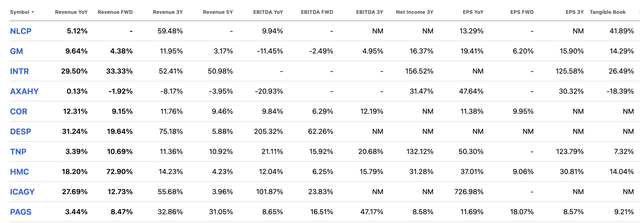
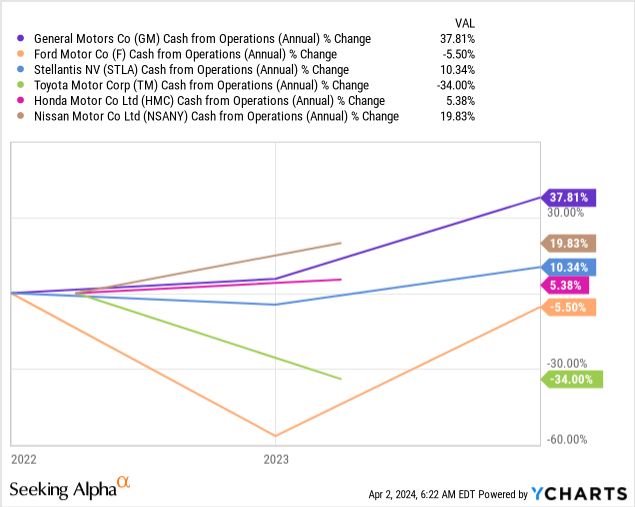
One year, obviously, is not a trend. But as the Quant Rating system makes clear, it’s not using only a single year. It uses multiple years. And speaking of growth, it might be helpful to point out that, between it and the same five companies I have already compared it to, General Motors has been the fastest-growing player during the past three years. The same can also be said when talking about revenue, as shown in the chart above, and operating cash flow, as shown in the graph below. I would definitely consider these numbers, both objectively and on a relative basis, to be worthy of the A that the Quant System assigned the stock.
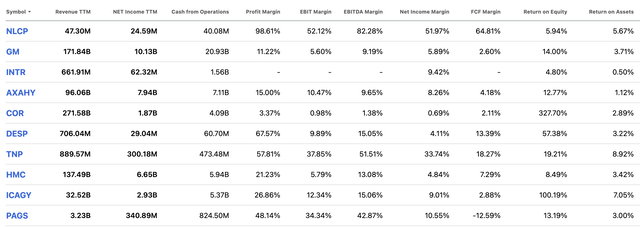
The third metric of concern is profitability. Other than valuation, profitability is the one that I personally assign the greatest weighting to. And interestingly enough, this received the highly uncommon A+ grade by the Quant Rating system. Under this category, there are multiple metrics that are looked at. But at the end of the day, it really boils down to profit margins in relation to revenue, as well as various metrics like return on assets.
To keep this one simple, I looked not only at the metrics on an absolute basis, I also looked at three of these metrics relative to similar firms. Those results can be seen in the table below. And what I found was a picture that wasn’t as bullish as what the Quant Rating system indicates. On the positive side, General Motors ended up being the second highest rated of the six companies on an EBITDA margin basis. This number creeps down to three when it comes to the net profit margin, before dropping to number four on an operating cash flow margin basis.
| Company | Net Profit Margin | Operating Cash Flow Margin | EBITDA Margin |
| General Motors | 5.89% | 11.12% | 14.11% |
| Ford | 2.47% | 8.47% | 6.71% |
| Stellantis | 9.81% | 11.86% | 14.62% |
| The Toyota Motor Company | 6.60% | 7.95% | 11.85% |
| Honda Motor Company | 3.85% | 12.59% | 12.57% |
| Nissan Motor Co. | 2.09% | 11.52% | 6.73% |
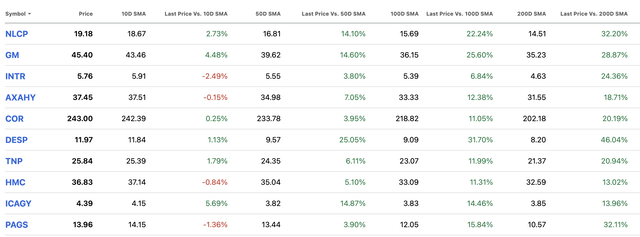
When it comes to the fourth metric, momentum, many technical analysts are sure to get excited. The idea behind momentum investing is that, once a company starts showing a clear and consistent trend of upside or downside, it can build momentum based on investor sentiment. And when we look at the image below, it should come as no surprise that General Motors has received a rather lofty A- rating. Based on the price that shares were trading at as I wrote about the company, the stock was up 5.50% compared to its 10-day simple moving average. This number continues to increase the longer the time frame is that we look at. This is true right up through the comparison to the 200-day simple moving average. During this window of time, shares have seen an upside of 28.9%. At some point, this sort of relationship has to break down. But in the near term, it can lead to some significant upside.
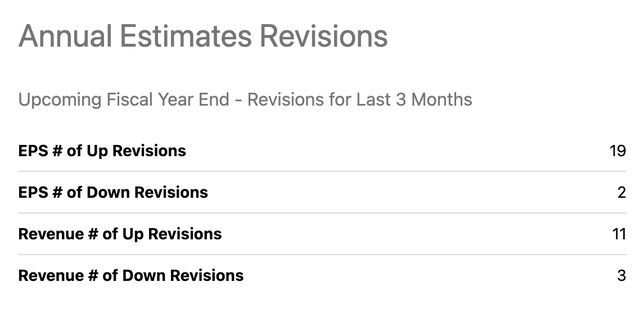
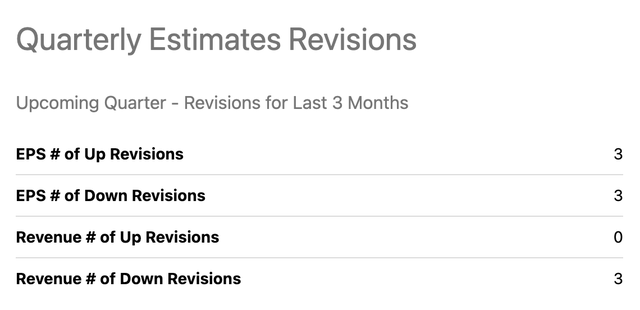
Lastly, we have EPS (earnings per share) revisions. At present, the Quant Rating system has given General Motors an A on this particular metric. This is essentially an assessment of how much analysts are upgrading or downgrading their expectations of the company’s results on a forward basis. For instance, looking at earnings per share estimates for the 2024 fiscal year, General Motors has seen 19 instances in which earnings were revised up. That compares to only two with downward revisions. When it comes to revenue, there have been 11 upward revisions compared to only three downward ones. And this only covers the last three months. When it comes to quarterly results, it’s a little more balanced, with four upward revisions compared to three downward ones. However, revenue has been guided down three times compared to the zero times that it has been guided up. So while analysts are more bullish about profits, they are feeling cautious when it comes to sales. Honestly, that doesn’t surprise me. After all, in the final quarter of 2023, revenue generated by our prospect was actually down 0.3% year over year, despite the fact that overall sales were up nicely. So this could be part of a changing trend on that front.
Takeaway
As it stands, the Quant Rating system employed by Seeking Alpha has gotten General Motors right where analysts, myself included, have largely gotten it wrong. 60% of the last articles written on the company were neutral, with the 40% remaining being bullish. But that bullishness was split between the ‘buy’ and ‘strong buy’ ratings. And the actual performance achieved by the company during this window of time really makes the ‘buy’ ratings inadequate. What this teaches analysts like myself, as well as what it should teach readers, is that taking a multifaceted approach to evaluating stocks is important. Even the best investors aren’t right all of the time. And by paying attention to quant systems like this, systems that aggregate and synthesize data for the purpose of coming out with a simple answer, we might have a good opportunity to optimize our returns.
Looking into the picture deeper like this has also given me different ways to look at the company. From my own observation, I would still say that I disagree with the valuation rating rather significantly. I would actually be more bullish on the firm than Seeking Alpha’s Quant Rating is. I would also argue that the profitability rating is perhaps a bit too high. This is especially true when you look at the company compared to similar firms. Though on an absolute basis, its margins are perfectly fine. But outside of that, topics like growth, momentum, and even sentiment through the form of analysts’ revisions, point to a company with a lot going for it. Given these facts and how cheap shares still are on an absolute basis and relative to similar firms, I would argue that upgrading the stock to a soft ‘buy’ would be logical.
Editor’s Note: This article discusses one or more securities that do not trade on a major U.S. exchange. Please be aware of the risks associated with these stocks.
Analyst’s Disclosure: I/we have no stock, option or similar derivative position in any of the companies mentioned, and no plans to initiate any such positions within the next 72 hours. I wrote this article myself, and it expresses my own opinions. I am not receiving compensation for it (other than from Seeking Alpha). I have no business relationship with any company whose stock is mentioned in this article.
Seeking Alpha’s Disclosure: Past performance is no guarantee of future results. No recommendation or advice is being given as to whether any investment is suitable for a particular investor. Any views or opinions expressed above may not reflect those of Seeking Alpha as a whole. Seeking Alpha is not a licensed securities dealer, broker or US investment adviser or investment bank. Our analysts are third party authors that include both professional investors and individual investors who may not be licensed or certified by any institute or regulatory body.
Crude Value Insights is an exclusive community of investors who have a taste for oil and natural gas firms. Our main interest is on cash flow and the value and growth prospects that generate the strongest potential for investors. You get access to a 50+ stock model account, in-depth cash flow analyses of E&P firms, and a Live Chat where members can share their knowledge and experiences with one another. Sign up now and your first two weeks are free!

