Summary:
- Ford is currently trading at a low P/E ratio of 6.5x FWD EPS.
- The single-digit P/E certainly does not hurt a value proposition.
- But the main reasons for my bull considerations are the other signs that indicate F is near or in the expansion phase of a new cycle.
E_Y_E
Ford is trading at 6.5x P/E
Many bullish articles on Ford Motor Company (NYSE:F), at least among those that I’ve read, point out the deep value here. Indeed, it is hard to argue against the value here with the stock trading at around 6.5x FWD EPS.
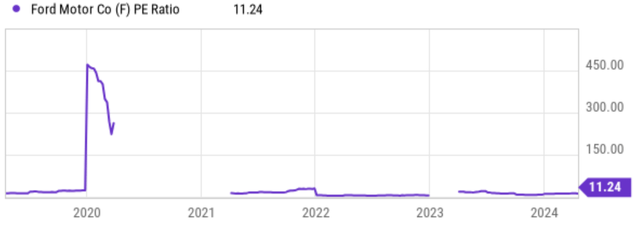
However, In the remainder of this article, I will argue why P/E is poor guidance for highly cyclical stocks like automakers. For these cyclical stocks, their earnings (especially accounting earnings) can swing so widely that it renders the P/E multiples almost meaningless. And F is no exception here, as you can see from the next chart below.
This is a good point to articulate my thesis. Otherwise, you might begin to form the impression that I am going to argue against the bulls. The goal of this article is to argue for a bullish thesis on F too. It is just the reason for my bullish thesis, not the low P/E. My key reason for being bullish involves the cyclical nature of its business. Next, I will argue why I think the stock is currently near a cyclical low and is either near or in the expansion stage of a new cycle.
F’s cyclicality
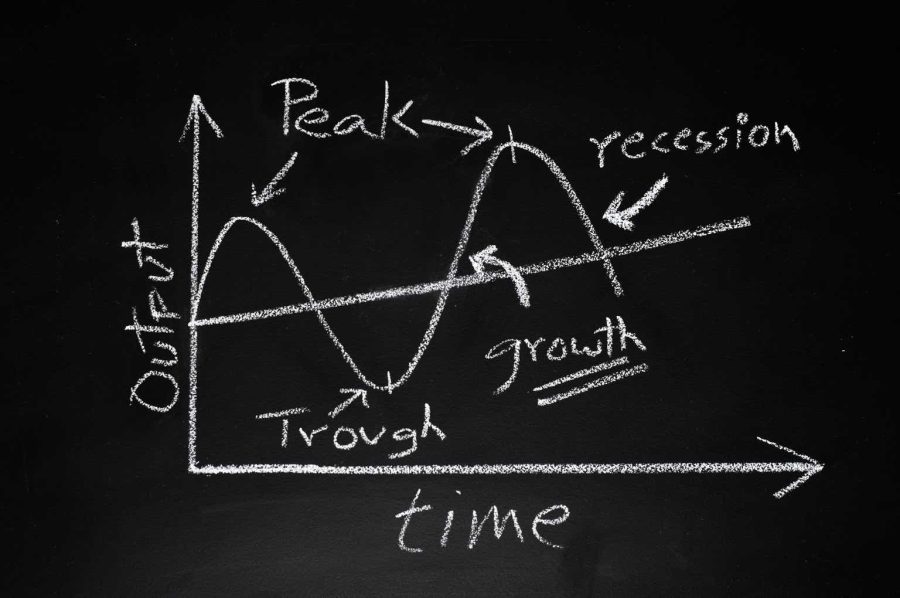
My method for analyzing cyclical stocks relies on revenue growth rather than P/E. As we will see in a minute, F has demonstrated tractable cycles in the past, and I expect the rhythm to repeat for good reasons. During bad times, most cyclical businesses suffer profit decline (or even losses). As a result, the P/E skyrockets while such times are precisely the good entry points for investors. Vice versa, when times are good, they tend to enjoy robust profits and expand enthusiastically, thus planting the seed for the downside phase of the cycle.
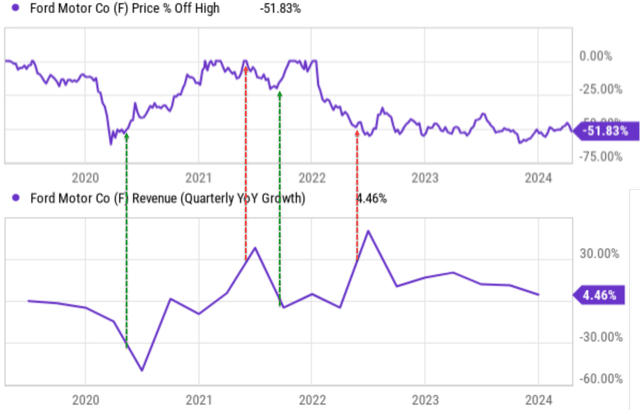
The chart next shows this pattern for F in the past 5 years. Even only over the course of 5 years, I can see the pattern repeating itself multiple times, as marked by the red dotted and green dotted lines. During each good time, the business enjoys a super growth phase (we are talking about 30%+ quarterly revenue growth YOY as seen). However, the growth phase was then followed by a large price correction shortly afterward. Vice versa, when the times are bad, the topline contractions are then followed by a robust price rally quickly.
Currently, I think F is either near or in a downward phase of its cycle judging by its topline growth and its inventory levels (more on this later). As seen, in its most recent quarter, the business reported a YOY growth rate of 4.4% only – barely enough to keep pace with inflation.
Growth outlook
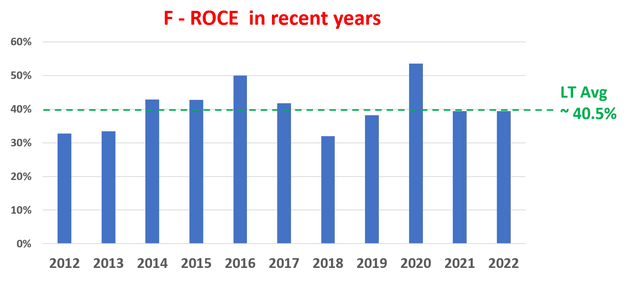
Despite deep cyclicality, F has been maintaining solid profitability over the long term, as reflected by its Return on Capital Employed (“ROCE”). As seen in the chart below, its ROCE has been on average 40.5%, when averaged over a period long enough to include multiple cycles.
As such, F can maintain a healthy amount of growth capital allocation over the long term. And there are indeed several good growth areas to invest in. The most immediate item on my list is the restarting of its truck plant in Kentucky, and I expect this to help the F-series in particular. The F-Series was hit hard in the fourth quarter, with sales falling 4.9% year over year to 177,419 units. Also, I expect continued strong demand for such popular models as the Bronco Sport, Maverick, and Mustang. Looking further out, other growth areas on my list include a favorable mix weighted toward higher-margin SUVs, its more profitable heavy-duty pickup production, and also its EV production ramp-up.
Other risks and final thoughts
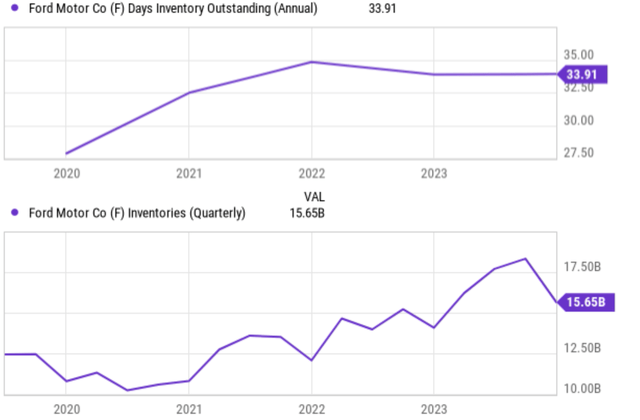
Another indicator I rely on to gauge the stage of cyclicality involves inventory. The chart below shows two ways of looking at F’s inventory levels: days’ inventory outstanding (“DIO”) and absolute dollar amount. Days’ inventory outstanding is a measure of how many days it takes a company to sell its inventory assuming its current sales. As seen, Ford’s inventory has been on an overall increase trend till the last quarter by both metrics, a good indicator of softened demand and/or overproduction. Then finally, the last quarter reported a large decrease in its inventory, a drop from a peak of ~$17.6B to about $15.7, an indicator of the beginning of the expansion phase of the cycle.
Although, carrying such a large inventory entails downside risks. Regardless of the cause, high inventory poses general risks like reduced cash flow (money tied up in unsold inventory limits cash available for other uses), storage costs (such as rent, utilities, etc.), and obsolescence risk (old models become less valuable when/if new models come out).
Beyond these general risks, automakers face some specific challenges when holding a large amount of inventory due to the unique nature of selling cars. In today’s market, the auto industry is rapidly adopting new technologies like electric vehicles and advanced driver-assistance systems. So the vehicles in the inventory become more sensitive to the obsolescence risk just mentioned. Car sales can also be seasonal and regional. An automaker with high inventory at the wrong time of year or wrong location may struggle and suffer higher costs to move the inventory around. Finally, dealerships typically finance their inventory through agreements with automakers called “floor plans.” These plans accrue interest, so the longer a car sits unsold, the more it costs the dealership. This can squeeze the profit for the dealer and strain the relationship between the automaker and its dealers.
Another main downside risk in my view involves the elevated interest rates. Against this macroscopic background, rates on auto loans are significantly higher than they were 1~2 years ago. As customers become more reluctant to take on loans to finance purchases, F may have to increase its budget for customer incentives and suffer margin compression.
All told, my conclusion is that the upside potential outweighs the downside risks. The single-digit P/E certainly does not hurt. But my main considerations are the other signs that indicate F is near or in the expansion phase of a new cycle, judging by the topline growth rates and inventory changes.
Analyst’s Disclosure: I/we have a beneficial long position in the shares of F either through stock ownership, options, or other derivatives. I wrote this article myself, and it expresses my own opinions. I am not receiving compensation for it (other than from Seeking Alpha). I have no business relationship with any company whose stock is mentioned in this article.
Seeking Alpha’s Disclosure: Past performance is no guarantee of future results. No recommendation or advice is being given as to whether any investment is suitable for a particular investor. Any views or opinions expressed above may not reflect those of Seeking Alpha as a whole. Seeking Alpha is not a licensed securities dealer, broker or US investment adviser or investment bank. Our analysts are third party authors that include both professional investors and individual investors who may not be licensed or certified by any institute or regulatory body.
As you can tell, our core style is to provide actionable and unambiguous ideas from our independent research. If your share this investment style, check out Envision Early Retirement. It provides at least 1x in-depth articles per week on such ideas.
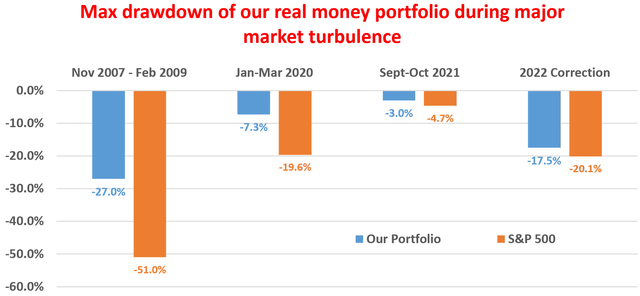
We have helped our members not only to beat S&P 500 but also avoid heavy drawdowns despite the extreme volatilities in BOTH the equity AND bond market.
Join for a 100% Risk-Free trial and see if our proven method can help you too.
