Summary:
- Netflix reported strong first quarter earnings, beating estimates on earnings per share, revenue, and new subscriber additions.
- Wall Street is concerned about lower guidance for the second quarter and the company’s decision to stop reporting subscriber numbers and revenue per subscriber.
- Despite the market’s reaction, Friedrich Global Research believes NFLX will continue to grow and sees it as a long-term investment opportunity.
Michael Vi
Wall Street is fickle!
Netflix (NASDAQ:NFLX) reported earnings after the close of trading on Thursday, and here are the facts:
Netflix reported 1st Quarter earnings of $5.28 per share, well above the consensus estimate of $4.52. It almost doubled the earnings it reported in the same quarter of last year of $2.88 per share. The company also grew on revenue, reporting $9.37 Billion compared to consensus estimates of $9.27 Billion, which represents an increase of 14.8% over the same period last year. The consensus estimate for new subscribers was 4.8 million. Netflix reported an increase of 9.3 million. The company provided guidance for EPS of $4.68 per share for the 2nd quarter, ahead of consensus estimates of $4.54. The operating margin came in at 28.1% compared to 21% in the same period last year and well ahead of previous guidance of 24%. The company also updated full-year guidance to 24%. Free Cash Flow came in at 2.14 billion, compared to the consensus estimate of 1.9 billion. Shares of Netflix fell 8.59% today!
What was wrong
As far as I can tell, the problem that Wall Street saw was two-fold:
Tepid Guidance: 2nd Quarter operating margin was slightly lower, at 26.6%. The company also expects the new subscriber additions in the 2nd Quarter to be slightly lower than in the 1st. The second quarter is always a down quarter for Netflix, so this should have been expected. But the full-year guidance is also lower, at 24%, so I guess Wall Street thinks the sky is falling. The bigger problem (from a Wall Street perspective) is that Netflix will no longer report subscriber numbers or revenue per subscriber beginning early next year. It will, however, provide revenue guidance.
Netflix, like most media companies, releases most new series during the 4th quarter. This lends itself to significantly more promotional opportunities later in the 3rd quarter, throughout the 4th quarter and into the 1st quarter; hence higher subscriber acquisition. The 2nd quarter is a slow period with little to promote and therefore results in lower subscriber acquisitions. This year should still be an improvement over previous years due to the continued roll-out of the company’s not allowing password sharing outside a single household. Many people who have come to rely on Netflix as an entertainment staple will sign up when they can no longer “ride” on a paid account of a friend or relative not living with them. I have personal experience in this matter. One account led to three new accounts this year. And there are millions more who will eventually come back to Netflix after being shut out (once the initial anger and trauma wear off).
Wall Street (and investors who listen to it) seems to be punishing Netflix for not wanting to report metrics it depends on that are specific to streaming. The company will continue to report earnings and revenue, and will provide guidance on those metrics, just like every other company. But why does Netflix not want to continue the guidance that analysts desire?
The answer lies in the growing complexity of providing breakdowns the way Wall Street would like. Netflix has multiple tiered pricing that varies from one region to another, as well as from country to country within any region. The company has found a formula that works, based upon several factors such as median household income, competing services, etc. Netflix would like to retain that information as a proprietary advantage rather than sharing it with competing streamers via Wall Street, as well it should. Let Disney (DIS), Paramount, Amazon (AMZN), and the rest figure it out on their own. Let them make costly mistakes along the way as they attempt to penetrate lucrative new markets. This allows Netflix to maintain its lead for longer and enables it to continue to expand in hard-to-penetrate markets ahead of competition. It is simply good business!
Free Cash Flow Analysis of Netflix
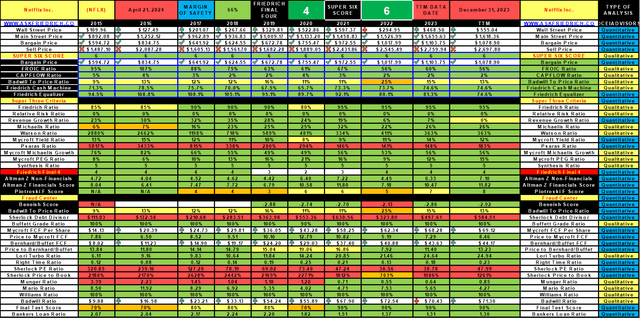
At Friedrich Global Research, we base all our analysis on FCF (free cash flow) and consistency. As you can see from the data file below that we developed using our proprietary algorithm, Netflix has consistently produced high levels of FCF and superior results over the last ten years.
For a description of each ratio and how they are calculated, please refer to AskFriedrich.com. To note a few highlights:
FCF Return on Invested Capital (FROIC) is a measure of how well a company allocates its capital. Anything above 20% is outstanding by our standards and, as it turns out, is very rare.
Friedrich Cash Machine measures how much of each revenue dollar generates in FCF. We measure FCF as: Net Income + Depreciation + Amortization – Capital Expenditures. It is a simplified calculation which eliminates such transient factors as changes in assets and liabilities that will swing one way or another from year to year, but are rarely sustainable over the long term. Different companies’ treatment of certain expenses may vary and there are arguments on both sides of the issue, but we believe that the methods applied by Netflix make sense. All that is to say that our calculation of FCF may seem more generous than traditional methods, but the results have proven to be accurate in identifying a standout performer among stocks.
Finally, the Price to Bernhard/Buffett ratio measures the value of a stock relative to its price on Wall Street. Anything with a ratio below 15 is considered a buy, if it is not due to a one-time event and is supported by consistently superior results over 3 years or longer. As you can see, Netflix meets the criteria for long-term investment.
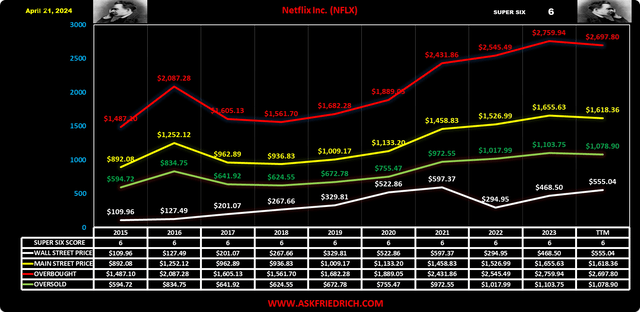
The Friedrich Chart shown below illustrates how undervalued Netflix is based upon our FCF analysis methodology. The yellow line is the value we believe Netflix would be valued at for purposes of an acquisition by another company or to take it private. The white line is the current market price. The green line is the bargain price (33% discount to the acquisition value). The red line is simply the acquisition value + 66%, which is when we consider selling a stock position. The market can overprice companies by extreme amounts at times, but we have found that this level is generally the point at which even quality companies find resistance to further increases.
We expect Netflix to continue to grow at a healthy pace going forward for many years. Wall Street’s temper tantrums will not last. I still like the trend in the Netflix chart below:
wsj.com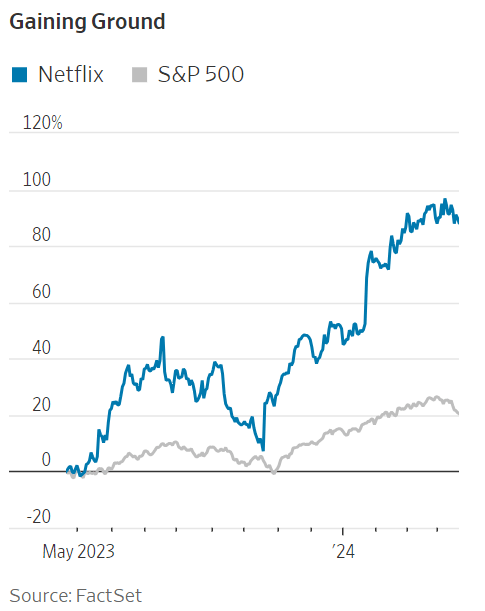
Rotation Causing Market Swings
In other news, it appears that the markets are in a period of rotation, with energy and defensive stocks gaining while technology stocks and other high-growth companies are getting repriced back down out of the stratosphere.
Pension funds pulled as much as $325 billion out of equities in the quarter, mostly in the last week or two, I would say. It is a smart move. Pension fund managers may have already recorded gains in excess of their annual targets, so locking in profits and moving into short-term treasuries earning over 5% makes a lot of sense. They are reducing their portfolio risk while exceeding expectations after a great run.
My thoughts on the U.S. economy for 2024:
Commercial Real Estate
What a mess! Commercial real estate is spiraling downward, with occupancy rates continuing to fall in most major cities. At some point, the owners will no longer have enough cash flow to make payments on their loans. That will put pressure on the banks, especially regional and community banks, that hold those loans. The properties underlying the loans are no longer worth as much as the money still owed. The banks continue to report those loans (or at least most of them) at their original value, and will until they are forced to report them at market value. In some cases, the value of the underlying property can be as much as 40% less than the outstanding loan. If the owner surrenders the property in foreclosure, the bank will either hold on to it or sell it at the market rate.
All commercial real estate is not in trouble, but primarily office buildings that are sitting half-full or vacant are the problem. Some malls may still be in trouble as several of the big anchor store chains continue to struggle. Apartment buildings, warehouses, hospitals and healthcare, data centers, and the like should be fine. But when you drive into a major city downtown and look up, most of what you see are large office buildings. As work from home, or remote work, becomes more accepted, those buildings continue to lose tenants and the rent income needed to pay mortgages. That will eventually become a major problem unless many are retrofitted as residential. The transition could be rough.
More Financial Sector Problems
Many banks, big and small, still hold a lot of long-term treasury bonds, which have lost a lot of value as interest rates rose. Bond values move inverse to interest rates, meaning that as interest rates rise, bond values fall. As a rule of thumb, a 10-year treasury bond can increase or decrease in value by about 10% for every 1% more from interest rates. Longer maturity bonds can move even more.
If a bank bought a 30-year bond five years ago at a yield below 2%, with interest rates on 30-year treasury bonds now sitting at 4.7%, the market value of that bond may be 30-40% below face value now. Of course, the bank can report the bond at face value if it is held to maturity. But if the bank needed to sell the bond at market value, it would have to record a big loss.
Banks may also be holding low-interest rate mortgages, which are valued similar to bonds. Same problem. As long as banks can hold out for lower interest rates, everything will be fine. But the commercial real estate fiasco could be the first shoe to drop if interest rates remain higher for too long.
Inflation Is Stubborn
Unfortunately, I do not expect inflation to come under control this year unless, that is, some negative catalyst creates a crack in the dam and forces the Fed to cut rates to stave off a crisis. Otherwise, I believe we are going to see rates remain restrictive through year-end, as long as the consumer can keep the economy growing.
Housing is also a mess. Not enough inventory (existing homes for sale), mortgage rates remain too high (back over 7% with pristine credit), and builders are seeing traffic dropping. And yet, home prices continue to go up because there is still enough pent-up demand to outstrip supply. Of course, this is helping to hold inflation up because housing makes up over 30% of CPI (consumer price index), the headline gauge of inflation.
Geopolitics
The geopolitical situation around the world is extremely tense. That does not help either. If the war in the Middle East expands, we are all in trouble and the economy will probably fall into contraction quickly. Oil prices would rocket higher, and companies would start taking precautionary measures to prepare for a recession, which, in turn, would probably create a recession. If Iran makes good on its threat to close the Strait of Hormuz, the global oil supply would be reduced by about 20.5 million barrels a day, equal to roughly 20% of the total daily demand for crude. Not only would gas prices rise, but so would everything else that must be transported (which is almost everything in today’s globally connected economy). Inflation would rise again as the higher costs would be pushed through to consumers as price increases. There would also be supply chain delays and disruptions, causing even more inflationary pressures.
Do not assume that I believe Iran or expect this worst-case scenario to become reality. But what I am saying is that we should be aware of the possibility and be prepared to take the necessary steps to avoid most of the fallout. Many industries will suffer more than others, and a few will reap outsized benefits, leading to profit growth. Knowing ahead of time which companies fall into the very different groups is what investing is all about. In that respect, investing is a little like politics, “Never let a good crisis go to waste.”
Growing Size of Treasury Auctions
There are many other problems, especially things like how much federal debt will need to be rolled over at high interest rates and whether the appetite for Treasuries will continue to be strong enough to absorb it all. Recent auctions have faced reduced demand, so the question could be answered in the next few quarters because there is a lot of new debt as well as a lot of debt maturing this year.
I could go on and on, but I think you get the idea. I am not saying a recession is imminent, but I do believe we are in a period where it is important to be cautious, especially when investing. Our portfolio holdings include a lot of cash, so we are well positioned to take advantage of any turmoil should the occasion arise.
Will the economy fall into recession? Yes. When? That is the question that will only be answered by events that have yet to transpire. I am an analyst, not a prophet.
The Future of Netflix
Netflix, like most other companies, cannot completely avoid a downturn in the overall economy, but it is more likely than most to produce sustainable growth throughout the turmoil. The growth rate may dip for a few quarters but, long term, Netflix will continue to add subscribers and, more importantly, retain subscribers better than its peer group. I believe Netflix will become a $1,000 stock in the next few years (unless it splits again). We are holding on to our shares for the longer term.
Analyst’s Disclosure: I/we have a beneficial long position in the shares of NFLX either through stock ownership, options, or other derivatives. I wrote this article myself, and it expresses my own opinions. I am not receiving compensation for it (other than from Seeking Alpha). I have no business relationship with any company whose stock is mentioned in this article.
DISCLAIMER: This analysis is not advice to buy or sell this or any stock; it is just pointing out an objective observation of unique patterns that developed from our research. Factual material is obtained from sources believed to be reliable, but the poster is not responsible for any errors or omissions, or for the results of actions taken based on information contained herein. Nothing herein should be construed as an offer to buy or sell securities or to give individual investment advice.
Seeking Alpha’s Disclosure: Past performance is no guarantee of future results. No recommendation or advice is being given as to whether any investment is suitable for a particular investor. Any views or opinions expressed above may not reflect those of Seeking Alpha as a whole. Seeking Alpha is not a licensed securities dealer, broker or US investment adviser or investment bank. Our analysts are third party authors that include both professional investors and individual investors who may not be licensed or certified by any institute or regulatory body.
Friedrich Global Research provides regular views on the economy as well as analysis on over 20,000 exchange-listed stocks in 36 countries on 6 continents. We manage two model portfolios which continue to consistently beat their respective benchmarks even with large positions of cash.
