Summary:
- Nike boasts robust brand equity and holds a dominant position in an industry that is poised for sustained growth.
- The new CEO is prioritizing innovation through a multiyear cycle.
- Early indications suggest that the new management is preparing the company for a new phase of solid growth.
Robert Way
Investment thesis
Nike (NYSE:NKE) boasts robust brand equity and holds a dominant position in an industry that is poised for sustained growth, with more than double the sales of its closest competitor. The company is facing several headwinds, some of which are temporary and others that will take longer to address as it reassesses its business model and growth algorithm looking ahead. Yet, all the discussion around Nike boils down to whether the company can sustain its brand equity, a key competitive advantage that has historically been built upon innovation, which, in turn, creates the foundation of the new strategy encompassing a multiyear innovation cycle. The company’s history is marked by periods of innovation cycles, with growth first accelerating and then moderating over time. While past success does not guarantee future results, there seems to be indications that the new management is preparing the company for a new phase of growth; scheduling an Investor Day later this year (the first time in a while) to unveil its next five-year plan, along with generating excitement in Paris ahead of the Olympics by showcasing a glimpse of its innovation pipeline, may suggest this notion. With the stock trading near its 52-week lows, and with modest consensus expectations for FY24E (when margins are expected to bottom) and FY25E (with top-line growing low-single-digit and with EPS already revised down by ~-20% since the start of 2023), for those with patience and a belief that the company is entering a new cycle of growth, I believe now could be an opportune moment to consider looking at the name, and possibly be rewarded in the future.
Nike faces near-term headwinds and increased competition
Nike is the largest seller of athletic footwear (65% of sales) and apparel (27% of sales) globally. The company sells its products through 1,000+ owned stores (20% of sales), followed by its digital platform NIKE Brand Digital (24% of sales), and wholesale customers (56% of sales). Nike’s operations span nearly all countries worldwide, with North America (NA) accounting for 42% of sales, followed by Europe, Middle East and Africa (EMEA) at 26%, China at 14%, and Asia/Latin America at 13%.
Nike has managed to maintain consistent profitability despite business cyclicality. However, in 2023, EBIT margin bottomed out at 12.1% (-220bps versus 2016). While COVID-19 had an impact, causing higher input costs, supply chain volatility, and shifts in consumer spending, strategic missteps also contributed to the underperformance. For example, a surge in demand in 2021 led to excess inventory, prompting management to rely on increased markdowns and promotional activity to reduce inventory levels, thereby impacting margins.
Moreover, despite the widespread impact of COVID-19 on the industry, Nike has faced heightened competition from global and local brands, which have consistently outperformed Nike over the past years. For example, when comparing Nike to a peer group of seven companies on a consolidated basis and acknowledging differences in FX, geographical exposures, timing companies report their fiscal years, and comparison bases, the median growth for the peer group’s USD top-line averaged +19.1% from 2021 to 2023, while Nike grew +11.2% during the same period.
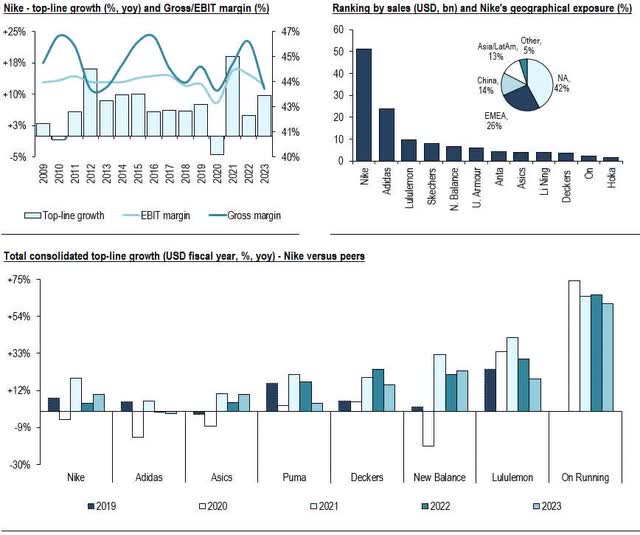
Image created by author with Seeking Alpha and company data
The CEO is prioritizing innovation through a multiyear cycle
John Donahoe assumed the role of CEO in January 2020, and outlined Nike’s direction for the coming years. The overall strategy aims at achieving long-term revenue growth by disrupting the industry with “must-have” products, building deep personal connections with customers, and delivering compelling experiences through digital platforms and retail outlets.
Mr. Donahoe brings experience in digital commerce, technology, global strategy (as former CEO of ServiceNow and eBay), and consulting (holding leadership roles at Bain & Company for two decades). As such, the company is expected to prioritize growth and enhance digital/direct to consumer channels and operational efficiency. While the stock was down -0.5% on the day of the announcement, his past achievements demonstrate a solid track record. For example, as CEO of eBay (from 2008 to 2015), he oversaw eBay and PayPal, pioneering early advancements in mobile commerce and payments. During his tenure, revenues doubled to $18 billion, and the company’s market cap increased by 250% to $80 billion. At ServiceNow (from 2017 to 2019), he led strong customer expansion and achieved annual revenue growth of 30%+, with the market cap more than tripling.
In fact, during the Q3 earnings call, management shared forward-looking insights. In order to fuel growth and increase relevance, they are executing the Consumer Direct Acceleration strategy, emphasizing premium consumer experiences in digital and owned stores, alongside selected wholesale partners. Increased investments are forecasted in the wholesale channel to support the marketplace and innovate in physical stores. The Nike Direct channel is pivotal for enhancing the consumer experience, which will involve increased investment in marketing, assortment, and service. Consequently, the focus is on achieving a 40% share in digital or 60% in direct metric in the future (versus the current 24% and 44%, respectively). This shift reflects a more consumer-focused strategy that is expected to increase DTC channel share while decreasing wholesale share over time.
Management also plans to dive deeper into their next five-year plan at the Investor Day later this year (first time in a while). Before that, they plan to leverage the Olympic Games in July-August to showcase their new product portfolio and serve as a catalyst for their latest innovations. In fact, the company has recently held a high-profile product launch in Paris where it unveiled its new collection of 13 new footwear products ahead of the Olympic Games, claiming that AI is sparking a “super cycle” of innovation, with the event apparently resonating well with the market. Notably, according to Google Trends analytics, over the past six Olympic Games, all events except one (China in 2022) witnessed a surge in “Nike” searches during and sometimes after the games. This suggests that, overall, Nike has been successful in creating a buzz around their brand and innovation, potentially translating into increased sales and brand awareness.
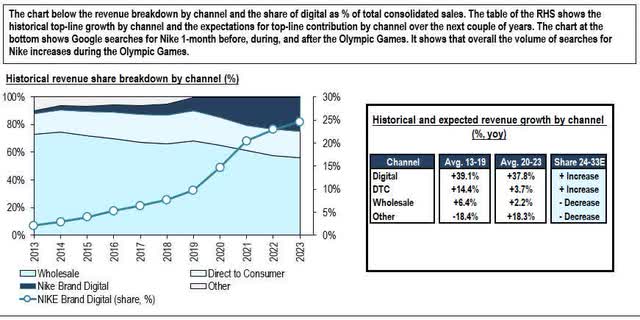
Image created by author with company data
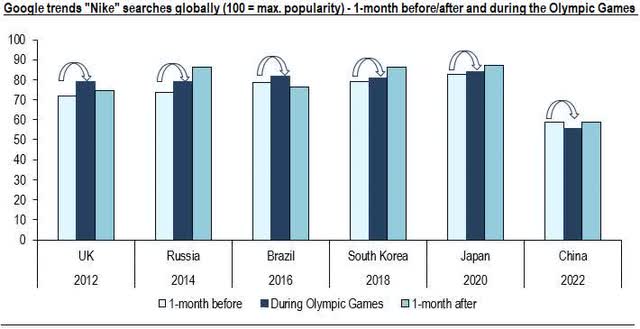
Image created by author with data from Google Trends
Moreover, as a brand focused on increasing its digital penetration and strengthening connection with customers, Nike seems to be heading in the right direction in its global social media strategy. When compared across different platforms, Nike has the largest combined number of followers on Instagram, X, Facebook, YouTube and TikTok. Additionally, it ranks high in likes on Facebook and has effectively driven engagement on its posts on Instagram and X. For example, its latest Instagram posts have an average of over 100k likes, which compares to an average of fewer than 40k likes for peers, while its “Win on Air” post on X had over 400k views. This engagement helps drive traffic to its website and bolsters its online presence. For instance, analyzing worldwide website traffic performance over the past three months, Nike’s website has consistently outperformed peers, receiving more monthly visits (and comparable pages per visit) than any other peer. This underscores the company’s strong marketing capabilities in driving interest and engagement with customers.
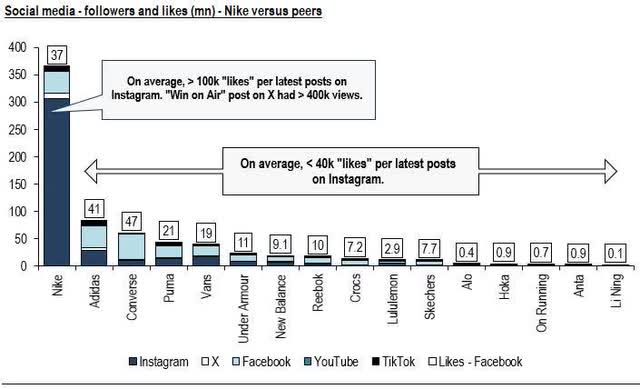
Image created by author with data from social media platforms
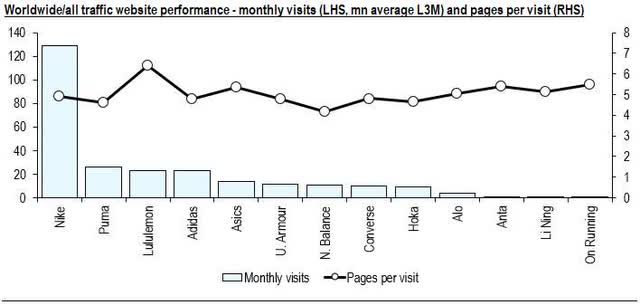
Image created by author with data from Similarweb and own estimates
In fact, when analyzing Nike’s history since 1984, the company has sustained interest in the brand and client engagement through innovation and marketing campaigns. As a result, it has consistently rebounded its top-line performance during challenging periods. As such, its largest division, North America, has often times tracked or outperformed personal consumption expenditures of clothing and footwear in the United States. However, as a result of the pandemic, there were abnormal peaks in this metric in 2021/2022 (highest since 1984), which have since been normalizing. In my view, considering the size of Nike in the industry and the fact that this division accounts for 40%+ of Nike’s consolidated sales, the subdued expectations for top-line performance this fiscal year (and possible into the first half of the next fiscal year) can be partly explained by these trends in consumer behavior. Yet, considering Nike’s industry stature and marketing/innovation capabilities, coupled with gradual improvements in consumer spending, performance could rebound in the next fiscal year.
Furthermore, it’s important to contextualize the discussion on growth, in my view. From 1984 to 2000, both North America and the consolidated entity showed solid growth in the mid/high-teens. As expected, average annual growth slowed to mid/high-single digits from 2000 to 2019. Additionally, dividing the last 20 years into halves, growth in North America accelerated from 2010 to 2019, while it remained relatively stable at the consolidated level. As such, caution is warranted depending on the timeframe being analyzed. Although it is likely that other divisions ex-North America will eventually experience lower growth in the future, impacting consolidated results, it is also true that the company’s growth profile since the 2000s has already decelerated and hovered around mid/high-single digits. Consequently, sustaining a mid/high-single digits top line performance into the future is not unfavorable, especially considering it would align with or surpass industry growth expectations going forward.
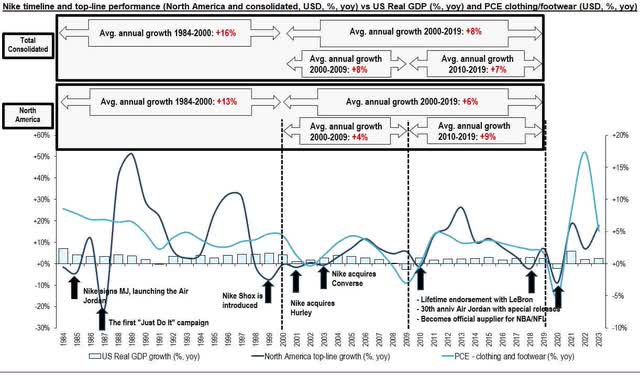
Image created by author with data from company and Bureau of Economic Analysis
First-half of FY25 soft, with expected 2H25 improvement
Nike should continue to benefit from strategic price increases, lower freight/input costs, and improved supply chain efficiency, resulting in lower inventory levels. Moreover, during Q2, management mentioned cost-saving opportunities that could generate up to $2 billion in savings over the next three years, to be reinvested in key growth areas. Yet, headwinds should persist on both macro and micro fronts. Soft macro backdrop and high inflation have dampened consumer sentiment and discretionary spending, amid intensified competition and promotional environment. Nike is also investing in digital capabilities and supply chain infrastructure, which, together with channel mix headwinds as it transitions product portfolios within larger franchises, should add pressure near-term.
As a result, during Q2 results, management reduced sales guidance for fiscal year 2024 from mid-single digits to approximately +1%, resulting in a -12% decline in the stock. Moreover, management maintained a cautious tone for fiscal year 2025, especially in the first half of the year. They mentioned a lack of product newness at scale in the portfolio, which should contribute to a decline of low single-digit in the first half of the year, with expectations of improvement in the second half. For the full fiscal year 2025, they expect revenue and earnings to grow year-on-year, with operating margins expanding (excluding the impact of the $450 million restructuring charges in fiscal year 2024). More tangible insights into fiscal year 2025 will be provided during Q4.
Consequently, the stock performance year-to-date has been lackluster, with a decline of -13%, which compares to +7% for the S&P500 and a median of +11% for peers. Furthermore, given the level of uncertainty for fiscal year 2025, consensus expectations for both top-line and margins indicate a wide-ranging of estimates. For example, analysts expect median top-line growth of +1.4%, ranging from a decline of -0.8% to an increase of +4.3%. Similarly, median EBITDA margin is expected to expand to 15.0% (+90bps), with estimates ranging from 13.0% to 15.5%. Notably, there have been no upward revisions to EBITDA margin expectations for fiscal year 2025 and 2026, which highlights the uncertainty ahead.
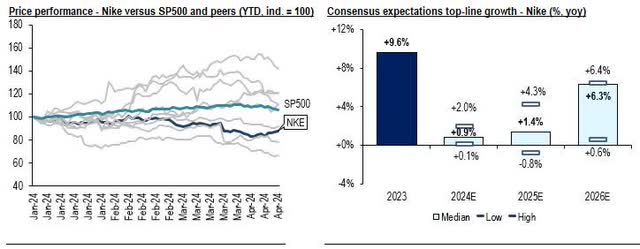
Image created by author with data from Seeking Alpha and FactSet
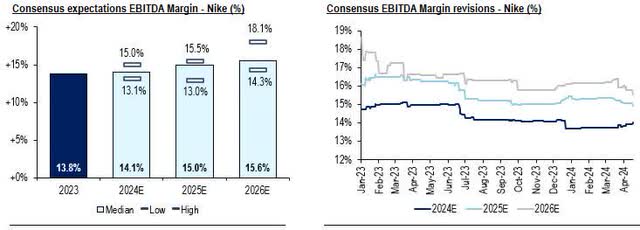
Image created by author with data from FactSet
China’s volatile trends raise questions about Nike’s growth algorithm in the country
China encompasses 1.4 billion people and a growing middle class population. Although accounting for 14% of sales in 2023 (+4 percentage points versus 2013), Nike’s performance in China has weakened since 2021, witnessing a decline of -5 percentage points from its peak share in 2019. Moreover, although Nike experienced solid growth at low double-digits before the pandemic, it has moderated to mid-single-digit growth levels since 2020. Trends improved somewhat throughout the nine months of the fiscal year 2024, with average growth in local currency at +8.7% yoy, albeit off from a low base of -2.0% yoy during the same period last year. Despite most of the growth coming from the wholesale channel, monthly revenue data from Pou Sheng International, a leading retailer and distributor of sportswear in Mainland China, shows subdued sales in March 2024 and lackluster sales trends since the beginning of 2022.
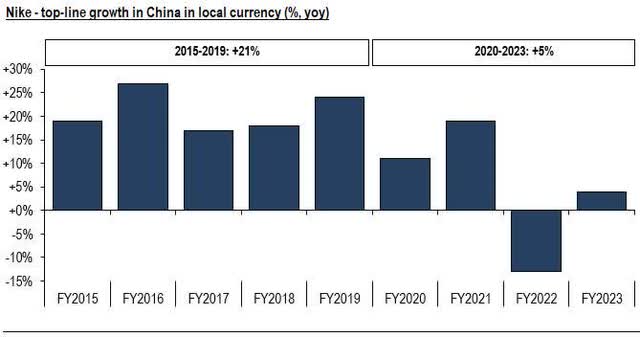
Image created by author with company data
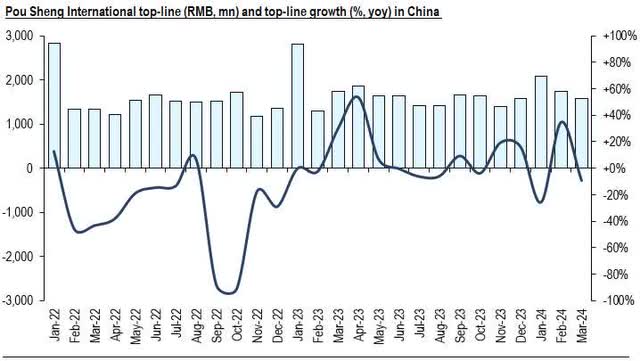
Image created by author with company data
On a consolidated basis in China, Nike has been underperforming local peers Anta Sports (OTCPK:ANPDY) and Li Ning (OTCPK:LNNGF) since before the pandemic. The sales gap between Nike and Anta Sports/Li Ning have been narrowing since 2018, while accelerating from 2021 onwards, which might be partly attributed to Nike’s temporary backlash from local consumers due to its stand against Xinjiang-made cotton. For example, in 2018, Nike sales in local currency were 1.7X that of Anta or 3.5X that of Li Ning, while in 2023, Anta surpassed Nike’s sales (0.9X) and Li Ning narrowed to 1.8X. Moreover, management attributes the weakness in digital to a temporary change in consumer behavior towards the physical retail channel, despite Nike being the number one sports brand on Tmall, the biggest digital platform in China. They mentioned that the platform has been experiencing lower growth and increased promotional activity. However, they remain optimistic that Nike can grow across multi-channels, and with social commerce contributing to growth in digital. They see an opportunity in the Douyin social commerce platform, where Nike has yet to establish a presence.
Additionally, as with peers in China, Nike’s top-line growth in local currency has often outperformed the clothing and footwear expenditure of urban households in China. However, the trend for Nike reversed in 2022, declining -13% yoy, while the “industry” remained relatively flat. Nonetheless, Nike managed to reverse the trend again in fiscal year 2023, with a +4% yoy increase compared to -1% yoy decline, respectively.
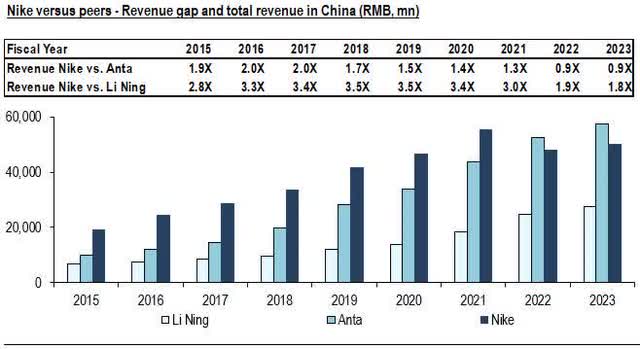
Image created by author with data from company
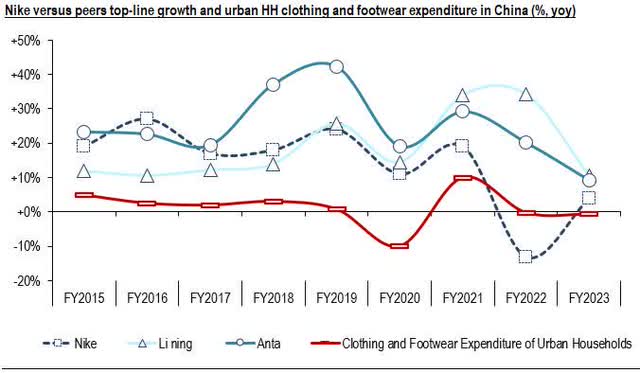
Image created by author with data from company and National Bureau of Statistics of China
In my view, the drivers behind the sluggish growth in China might include several reasons, such as softening consumer confidence, heightened competition from local and global brands, and to certain extent, “Guochao”, a term recently established that translates to “national wave”, referring to a movement in China where consumers, particularly Millennials and Gen-Z, show a strong preference for domestic brands and products that incorporate traditional Chinese culture and style. Furthermore, Anta is expanding its retail presence with a large number of stores and a strong focus on digital channels, making its products more accessible to consumers. Chinese companies may be capitalizing on this trend (and challenging Nike); Anta, for example, has been leveraging marketing and branding to get close to consumers. As an exercise, assuming that Nike’s consolidated demand creation expense as a percentage of sales is the same in China, Anta’s marketing expenses ratio would rank above that of Nike, while accelerating in 2021 (when peers decelerated) and currently spending more RMB in advertising than Nike in the country.
As such, sustaining the same level of solid growth as in the past (low double-digits) may be challenging for Nike to achieve over the long-term due to increased competition and a higher comparison base. On the other hand, interest in the brand remains strong. As evidence, Google Trends data indicates consistent searches for “Nike” in China since the beginning of 2021. Moreover, Nike outperformed in search volume its closest global peers, including Adidas (OTCQX:ADDYY) and the increasingly popular Lululemon (LULU). Additionally, Nike’s products are positioned in the affordable luxury segment in China, with selling prices higher than those of local brands. Although consumer confidence in China has been weak, interest in the Nike brand seems to persist. So, financial constraints may also be prompting consumers to shift to cheaper local brands.
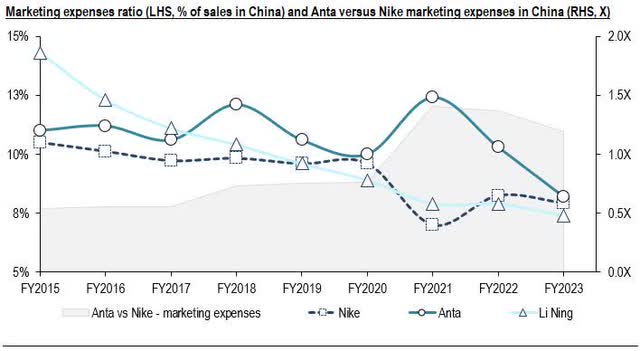
Image created by author with data from company
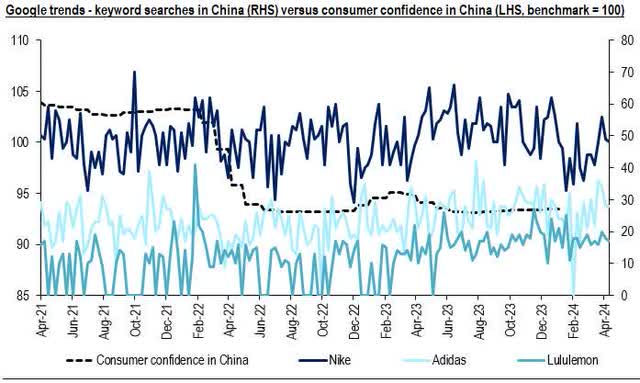
Image created by author with data from Organization for Economic Co-operation and Development and Google
Valuation: Although trading at a discount, Nike shares are not a bargain
Due to its relevance, Nike is closely monitored by investors. As a result, arbitrage opportunities are limited to periods of volatility when the stock may temporarily deviate from its “intrinsic value”. Under normal circumstances, its performance should not significantly deviate from that of the market over time. For example, over the past 15 years, including dividends, from 2009 to 2023, Nike’s average annual total return was +17%, compared to +15% for the S&P500. When comparing the past 10 years, both returned an average of +13%. As such, when considering an investment in Nike stock, it may be reasonable to focus on capturing upside asymmetry that would justify concentrating the risk in a single stock rather than diversifying the risk across the index. Nike operates in a cyclical industry, with a significant portion of its value lying in perpetuity (terminal value accounts for >70% of valuation). In turn, this long-duration profile is highly sensitive to changes in interest rates, which can significantly impact valuation.
The sudden easing of monetary policy to mitigate the effects of COVID contributed to exceptionally high valuations and multiples, which helped distort historical averages. In turn, relying solely on historical averages (or short-term valuation metrics) may be misleading, as it might suggest that a stock is significantly undervalued. For example, when analyzing Nike’s 10-year historical EV/EBITDA and P/E multiples, the former averaged 25.3X and the latter 42.7X, implying -23%/-41% discount to FY24E. Yet, upon analyzing the historical data, it becomes evident that there were periods of outliers. In my view, to avoid relying on inflated multiples, it might be prudent to normalize trends by eliminating periods of erratic peaks (while this exercise may be perceived as subjective, it may help mitigate the risk of overpaying for a stock). After doing this adjustment, my “normalized” EV/EBITDA and P/E multiples show 21.9X and 28.5X, respectively, or -11% and -12% discount to FY24E, pointing that the discount appears less pronounced than previously thought.
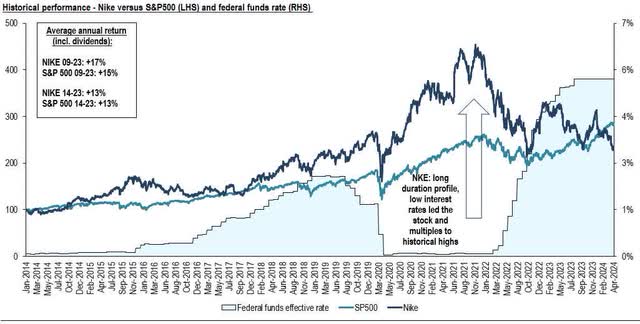
Image created by author with data from company and Aswath Damodaran website
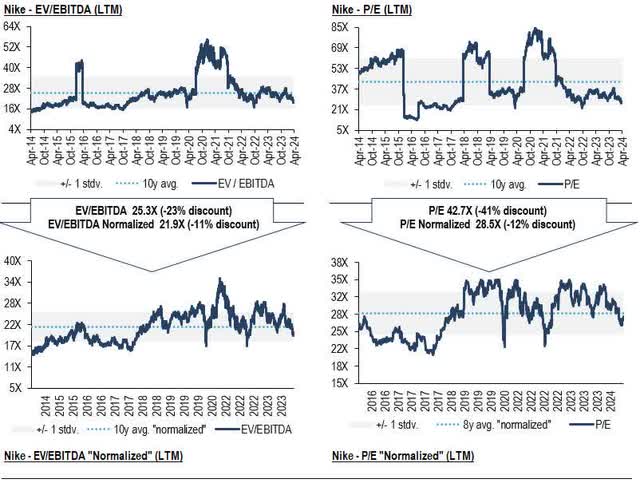
Image created by author with data from FactSet and own estimates
On the flip side, relying solely on its historical average could also be misleading. As such, examining PEG ratios could be helpful. Additionally, comparing it to those of peers in the same industry or even to peers in the tech sector (considering their growth profiles) could provide additional insight. By plotting the PEG ratio against consensus EPS CAGR over 3 to 5 years for Nike, industry peers (Under Armour (UAA), Crocs (CROX), Lululemon (LULU), Deckers (DECK), Skechers (SKX), On Holding (ONON), and Adidas (ADDYY)), and well-known tech companies (Apple (AAPL), Microsoft (MSFT), Google (GOOGL), Amazon (AMZN), Meta Platforms (META), Netflix (NFLX), and Nvidia (NVDA)), Nike ranks high, with a PEG ratio of 2.2, only below AAPL (2.52) and MSFT (2.51). While this methodology might suggest that the stock is overvalued (fairly valued would be equal to 1), caution is warranted, as with any valuation methodology. Nonetheless, it offers insight of how much one would be paying for Nike’s expected +11% earnings growth relative to those of other peers.
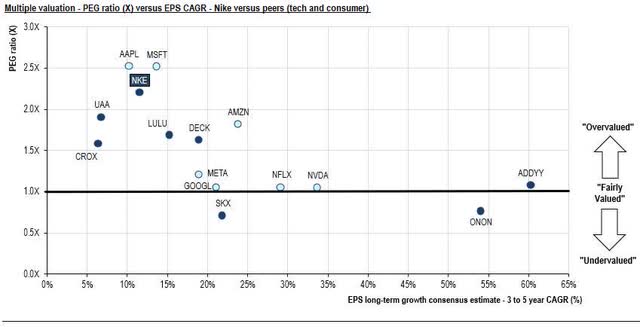
Image created by author with data from Seeking Alpha
Furthermore, as a way to assess whether two companies with similar characteristics are trading outside their historical range, the following analysis compared Nike’s historical multiple performance (EV/EBITDA, LTM) with that of Adidas since the beginning of 2018. On average, Nike’s multiple traded at a premium of +71% versus Adidas. However, starting in July 2023, this trend reversed, with Nike now trading at a discount to Adidas of approximately -25%. This may suggest that Nike’s discount could revert in the future, assuming the historical relationship holds true.
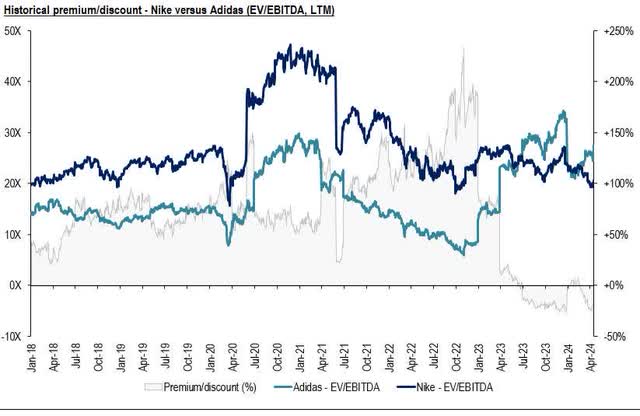
Image created by author with data from YCharts
Valuation incorporates two scenarios for near-term uncertainty
In order to account for near-term uncertainty, Nike’s valuation considers two scenarios (base and bull case), each with assumed equal probability of occurrence. Moreover, each scenario considers a 50%/50% blend of DCF (10-year forecast) and exit EV/EBITDA multiple (to incorporate expectations for growth). The exit multiple is the same in both cases, with differences lying in growth and margins assumptions. In the “base case scenario”, growth estimates are somewhat more conservative due to the limited visibility of the near-term macro backdrop. In the medium term, there’s also uncertainty around execution and geographical exposure outside North America (mainly in China). In contrast, the “bull case scenario” aims to capture potential “upside risk” if management delivers strong execution, with growth and margins accelerating. The terminal growth and cost of capital are equal within both scenarios: terminal growth rate of 4.0% (U.S. CPI plus real GDP growth over the long-term), and WACC at 7.7% (10.3% cost of equity, 3.0% cost of debt, 25.0% tax rate, and 4.6% risk-free rate).
Base case
This scenario forecasts average growth of +5.2% from 2024E to 2033E, which compares to +6.3% from 2016 to 2019. This assumes China’s growth decelerating to mid-single-digit from high-teens (in USD) before the pandemic, North America growing on average at +4.3%, and EMEA and Asia/LatAm expanding mid/high-single-digits. Additionally, it is assumed gross margin expansion due to some pricing power and gradual shift towards the DTC channel (which commands higher margins), reaching 46.0% in 2033E versus 44.8% historical average. Moreover, the scenario assumes operating leverage and efficiency gains, translating into a 16.5% EBITDA margin at the end of the forecast period (+120bps versus the historical average). EPS is expected to grow at an average of +9.2% over the next three years.
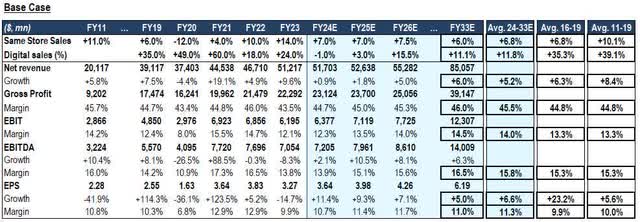
Image created by author with data from company and own estimates
Bull case
This scenario forecasts average growth of +5.9% from 2024E to 2033E, which compares to +6.3% from 2016 to 2019. This assumes China’s growth decelerating to mid-single-digit from high-teens (in USD) before the pandemic, North America growing on average at +4.7%, and EMEA and Asia/LatAm expanding high-single-digits. Additionally, it is assumed gross margin expansion due to some pricing power and gradual shift towards the DTC channel (which commands higher margins), reaching 46.2% in 2033E versus 44.8% historical average. Moreover, the scenario assumes operating leverage and efficiency gains, translating into a 17.5% EBITDA margin at the end of forecasted period (+220bps versus the historical average). EPS is expected to grow at an average of +10.7% over the next three years.
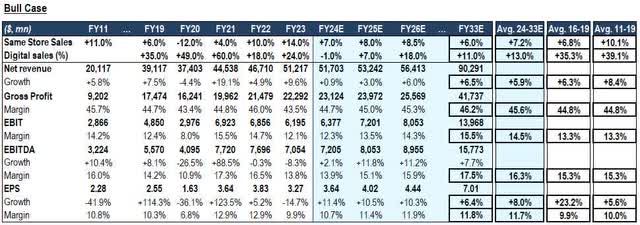
Image created by author with data from company and own estimates
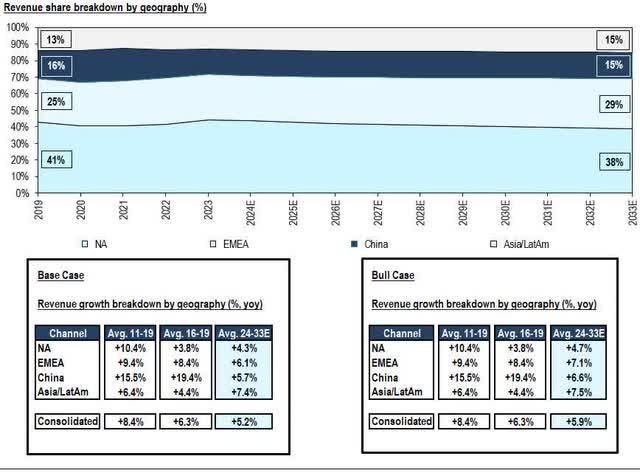
Image created by author with data from company and own estimates
Both scenarios align closely with median consensus expectations for top-line growth in fiscal year 2024E. For 2025E, the base case is slightly above (+40bps), and the bull case is +160bps above, while for 2026E, both scenarios fall below consensus. Moreover, in both scenarios, top-line growth estimates more closely align with the historical average growth between 2016-2019 (mid-single-digit) than with the historical average growth between 2011-2019 (high-single-digit). However, margins for both scenarios are somewhat in line with median consensus for the next three years and surpass the historical average over the forecasted period, thanks to the shift in the business model towards DTC, which commands higher margins.

Image created by author with data from company, own estimates, and FactSet
For the multiple valuation methodology, both scenarios assume an exit EV/EBITDA multiple of 20.0X (~-10% discount versus the normalized historical average to adjust for lower growth and margins in the future). Moreover, the DCF estimates also imply an EV/EBITDA of 20.0X at the end of the forecasted year of 2033E. Assuming an equal probability for each scenario, the model output indicates a 12-month price of $113.00, or +20% potential upside versus current price (as of April 25).
As previously discussed, both Nike and the S&P500 have seen an average annual total return of +13% over the past 10 years. Notably, this return closely aligns with the potential upside of the base case scenario, with the upside risk mainly stemming from the bull case scenario. In essence, considering limited visibility on the strategic plan and macro backdrop, especially in the first half of the next fiscal year, the total return suggests that the execution and pipeline of innovation are adequate to justify the extra risk. If that’s not the case, it might be wiser to diversify and mitigate concentration risk while aiming (at least historically) for comparable return.
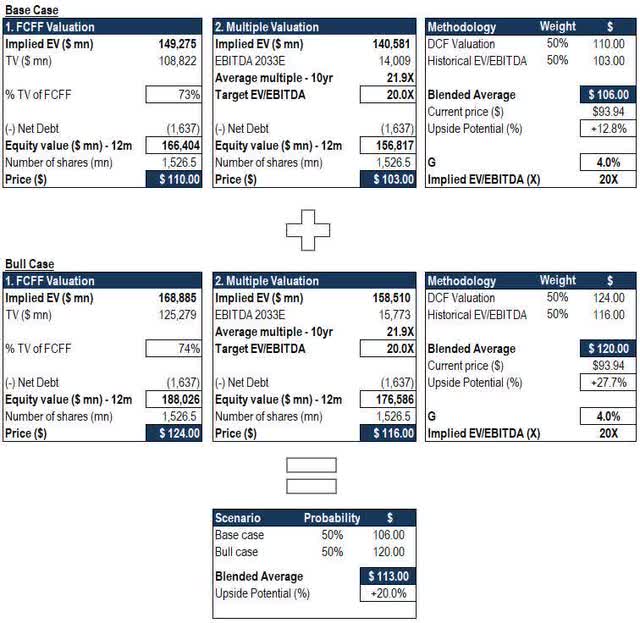
Image created by author with data from own estimates
Risks
A key upside risk concerns stronger than expected management execution, hence surpassing the parameters outlined in the bull case model. This could result in growth and margins ahead of expectations, and the impact even more pronounced if it occurs in the near term, especially considering the subdued median consensus expectations for FY2025E. Additionally, the company’s plan to take advantage of the Olympic Games in Paris, along with the Investor Day later this year, could act as stronger than expected catalysts not factored into the model. Yet, the recent guidance had a cautious tone, and therefore, poses a challenge in incorporating more bullish assumptions. Moreover, Nike, as a company with significant free cash flow generation, derives much of its value from perpetuity. As a result, there are upside risks should the market starts factoring in a lower cost of capital due to easing of monetary policy. On the other hand, persistent inflationary pressure resulting in a softer consumer spending environment could lengthen the macro recovery process, presenting downside risks not fully contemplated in the forecast. An additional downside risk encompasses increased competition over the long-term, while heightened promotional activity represents a downside risk in the near-term.
Concluding thoughts
The softening macro environment and ongoing supply chain disruptions, although temporary, continue to pose challenges for a global discretionary operator amidst a full revamp of its strategy. Furthermore, the outlined plan presents significant execution risk, vis-à-vis the gradual shift in channel from wholesale to retail. This transition will require a more complex supply chain and more capital intensive business model, alongside increased marketing efforts to drive foot traffic to retail stores. At the same time, operating costs for brick-and-mortar stores remain elevated.
Nike also faces increased competition from a broader array of comparable companies across various business segments and geographies compared to previous periods. While cost-savings initiatives and operational efficiency improvements are welcomed, these also entail risks, particularly at a time the company seeks to invest for growth and reassess its growth algorithm looking ahead.
Yet, Nike’s core competitive advantage, its brand equity, remains strong and the industry is poised for sustained grow. Nike has historically demonstrated the ability to adapt and maintain strong brand appeal, largely driven by cycles of innovation. Ultimately, the key lies in preserving brand equity, which for Nike encompasses a focus on innovation, a core element of the new management’s strategy. While some challenges outlined in the analysis may be transient, others may require time to overcome. However, as these obstacles gradually diminish, tangible improvements should become clearer. While past success doesn’t guarantee future outcomes, those with patience and a belief that the company is entering a new cycle of growth through innovation may be rewarded. With the stock trading near its 52-week lows, I believe it could be an opportune moment to consider looking at the name.
Editor’s Note: This article discusses one or more securities that do not trade on a major U.S. exchange. Please be aware of the risks associated with these stocks.
Analyst’s Disclosure: I/we have no stock, option or similar derivative position in any of the companies mentioned, and no plans to initiate any such positions within the next 72 hours. I wrote this article myself, and it expresses my own opinions. I am not receiving compensation for it (other than from Seeking Alpha). I have no business relationship with any company whose stock is mentioned in this article.
Seeking Alpha’s Disclosure: Past performance is no guarantee of future results. No recommendation or advice is being given as to whether any investment is suitable for a particular investor. Any views or opinions expressed above may not reflect those of Seeking Alpha as a whole. Seeking Alpha is not a licensed securities dealer, broker or US investment adviser or investment bank. Our analysts are third party authors that include both professional investors and individual investors who may not be licensed or certified by any institute or regulatory body.
