Summary:
- Nvidia Corporation has solidified its position in the AI industry with strong earnings and revenue growth.
- Despite rising competition, consensus expectations suggest continued growth for Nvidia in the coming years.
- Technical analysis indicates a Bull Flag pattern, suggesting potential for further price increases, with support levels at $750.
serg3d
For many investors, this year’s stock market star has been Nvidia Corporation (NASDAQ:NVDA), as the central “picks and shovels” play for anyone looking to capitalize on developments within the rapidly accelerating artificial intelligence industry. During fiscal year 2024, the company continued to solidify its unparalleled position in the production of GPUs for world-class data centers with incredible adjusted per-share earnings growth of 288% and revenue growth of 126%. Perhaps not surprisingly, those GPUs contributed nearly 80% of Nvidia’s revenue figure during that period – but it also remains clear that market supply of Nvidia GPUs has been widely outpaced by market demand, and this makes it straightforward to see why the massive bull run in NVDA share prices might be far from over.
For fiscal year 2025, consensus expectations suggest that revenue growth could still gain as much as 82% annually, while per-share earnings growth might post at even higher rates (89%) for the period. So, while it’s almost certain that Nvidia will continue to face rising competitive forces from rivaling companies like Intel Corp. (INTC) and Advanced Micro Devices, Inc. (AMD), broader trends in the market remain highly supportive, and it remains quite possible that NVDA’s bull run still has the potential to extend much further.
NVDA: Hourly Downtrend Breaks (Income Generator via TradingView)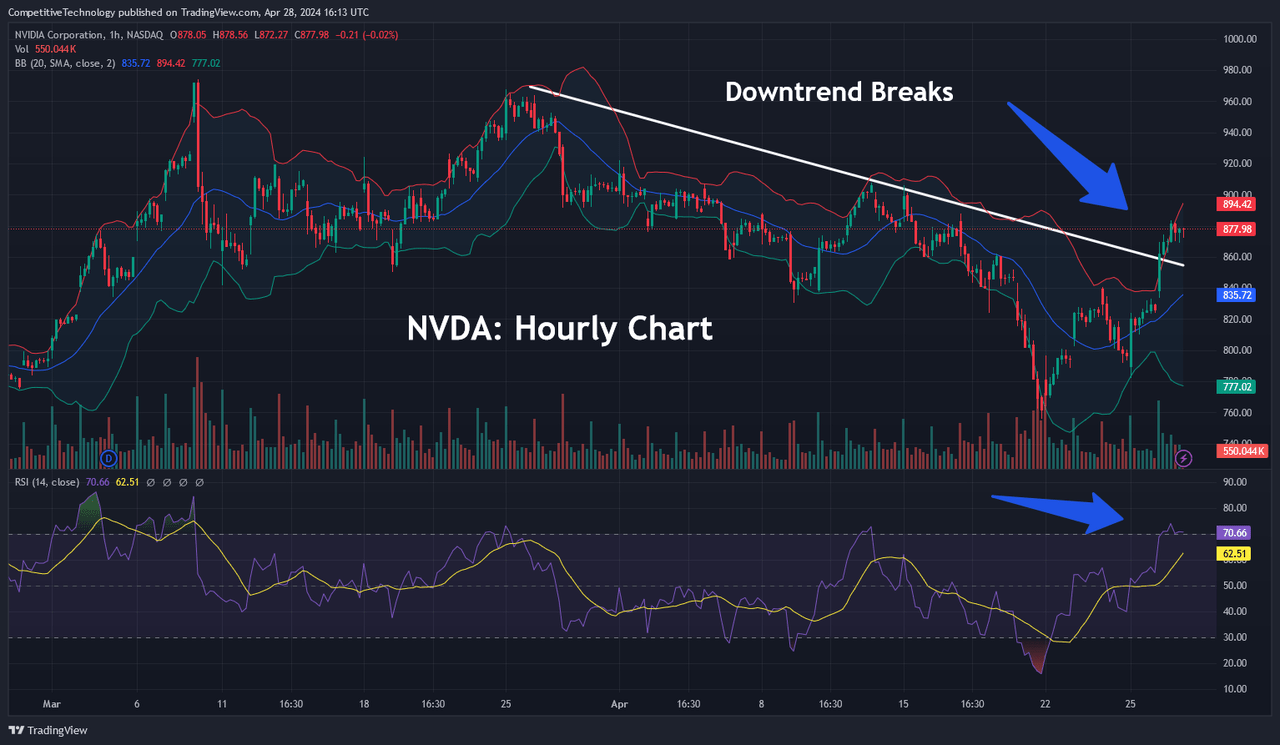
For most of the last two months, NVDA shares have given back some of the sizable gains that have been generated this year as many bullish investors likely decided to book profits and take some risk exposure off the table with the stock trading at elevated levels.
Fortunately, this moderate downside activity allowed hourly indicator readings as measured by the Relative Strength Index (RSI) to roll over out of heavily overbought territory – and we actually saw this indicator fall into oversold territory on April 19th. Given the strength of the 2024 NVDA bull run, it is not surprising that this occurrence was ultimately viewed as a positive opportunity at lower levels – and the buying activity that followed has been strong enough to invalidate the short-term corrective downtrend that began in early March.
Bull Flag Pattern Emerges (Income Generator via TradingView)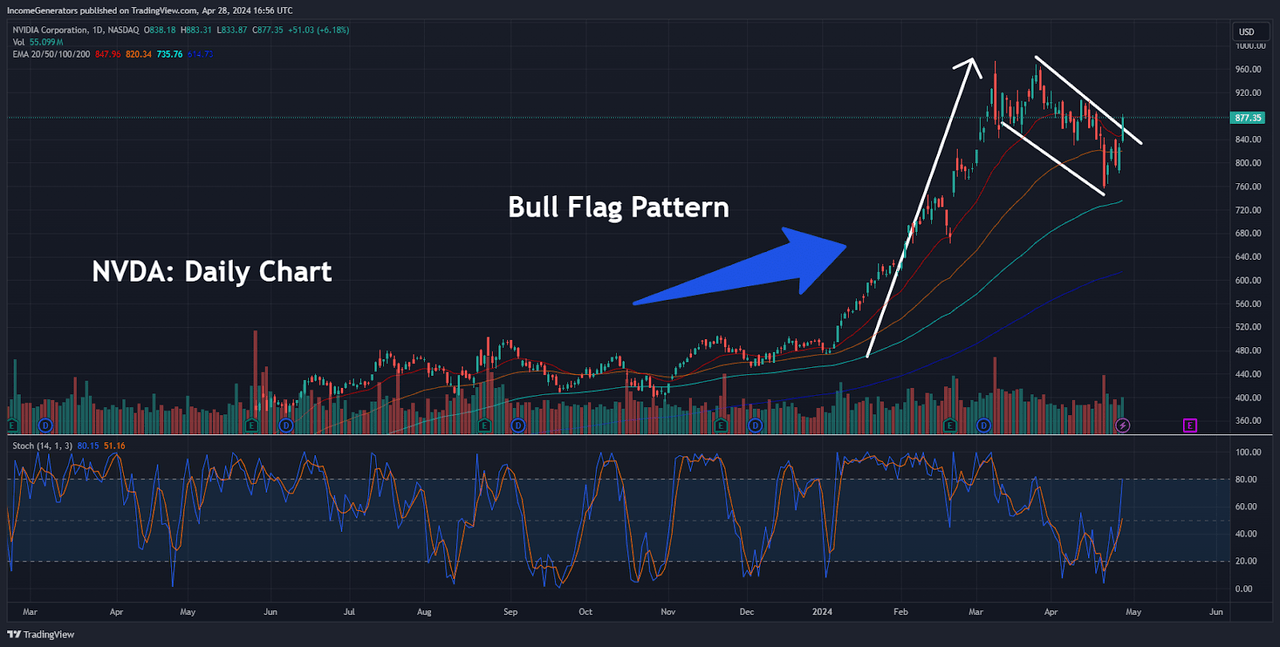
Next, we will take a look at the daily charts – and this is where things start to become quite interesting from a technical analysis perspective. Specifically, we can see that the rally which began on January 3rd, 2024 (at $473.20) sent prices surging by an incredible 105.8% – all the way to the all-time highs near $974 (posted on March 8th, 2024).
Of course, a large portion of this buying activity can be attributed to the AI fervor that has been gripping stock markets for most of this year. But to see share price gains of more than 105% in just two months is almost unheard-of when we are talking about a company that is as large and well-established as Nvidia. Clearly, something deeper is going on here, and this is why we think it is important to discuss the essential characteristics of a Bull Flag price pattern in greater depth.
Broadly speaking, the Bull Flag is considered to be a consolidation-continuation pattern that is formed when an asset has developed a very strong uptrend. This uptrend (analogized as the “flag pole”) is then followed by a rectangular period of consolidation that tends to show a slight drift in the downward direction (countertrend), which is described as the “flag” formation itself. This pattern can also occur in the opposite direction (commonly referred to as the Bear Flag pattern), but the dominant trend direction is focused on the downside in those instances.
Of course, there are variations of this pattern (such as the Bull Pennant, which has slightly different characteristics), but what is essentially important here is the fact that we have a very strong uptrend that is followed by a period of countertrend consolidation. Often, this activity will allow overbought indicator readings to reset themselves – and give new buyers an opportunity to re-enter the market at somewhat lower levels.
Equidistant Projected Price Moves (Income Generator via TradingView)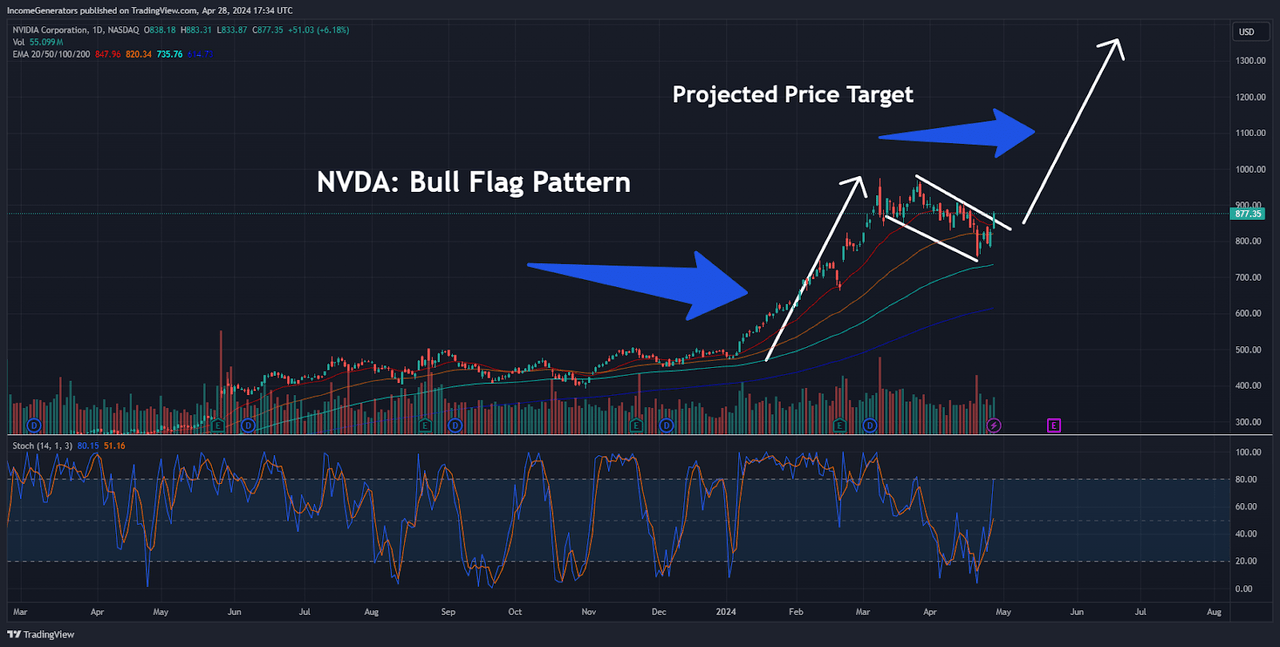
Additional strength is typically attributed to these patterns in cases where rising trading volumes can be identified just before the market price breakout. On the 4-hour charts, we can see that NVDA stock fell to its lows in trading volumes on April 8th before rising higher into the eventual Bull Flag breakout-point that occurred on April 26th.
Overall, this increase in trading volumes helps to confirm the validity of the broader pattern and suggests that the projected equidistant price target (which is roughly equal in length when compared to the original structural formation) remains viable.
NVDA: Potential Support Zones Below (Income Generator via TradingView)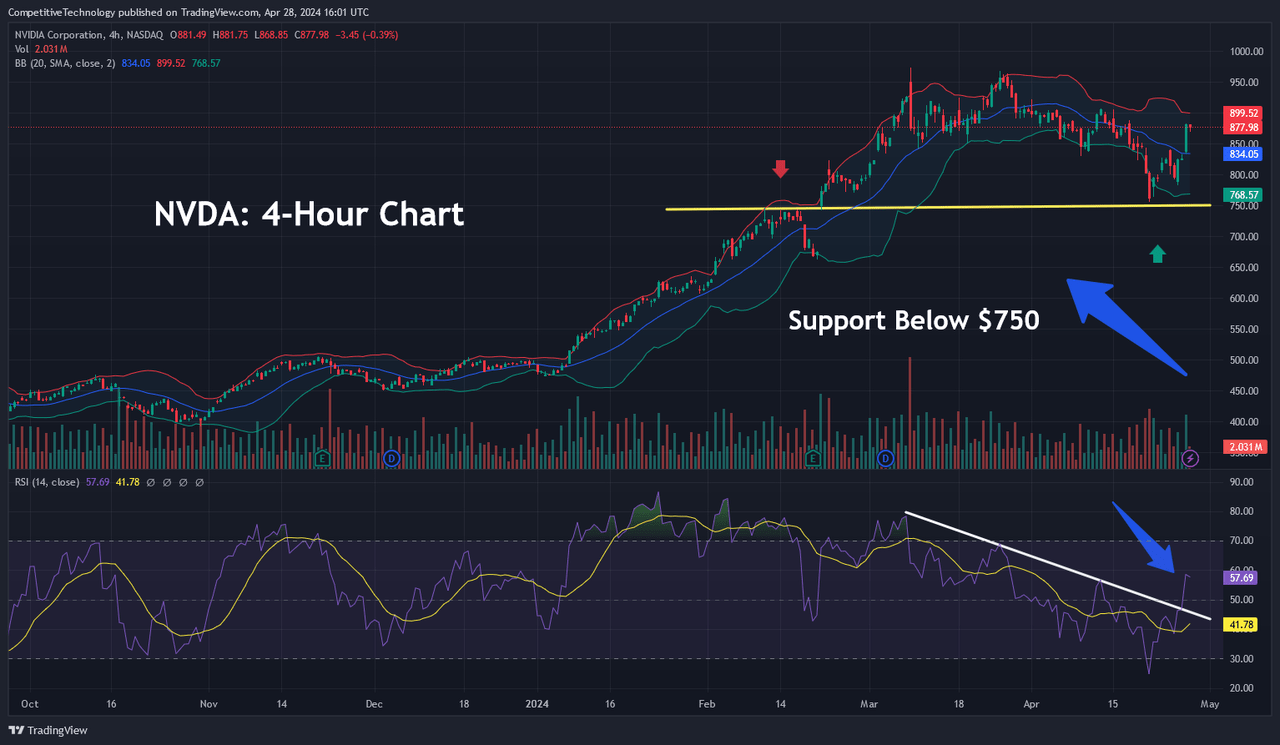
All of that said, we must also be sure to outline price levels on the downside which might be expected to act as support zones if this bullish outlook ultimately proves to be incorrect. One of the most common technical analysis concepts that we cover in our research deals with situations where important support and resistance levels are broken, and then the role of those levels will begin to work in the opposite direction. Specifically, this means that a resistance level that is overcome (to the upside) will then be expected to act as a region of support upon future re-tests. Conversely, support levels that are broken (to the downside) will then be expected to contain prices (as resistance) in later sessions.
When we look at the NVDA 4-hour chart, we can see a textbook example of a resistance-turned-support zone which has been confirmed by a re-test at a later date. Specifically, the stock’s price high near posted on February 12th initially contained market valuations (which later dropped to lows of $662.50 on February 24th). After this resistance zone eventually broke to the topside, bullish momentum accelerated, and NVDA shares ultimately rose to all-time highs near $974 on March 8th. Consolidating countertrend selling pressure then brought share prices back down toward the $750 level on April 19th.
Since Nvidia Corporation bulls were able to hold the line in this area (and ultimately break the downtrend line shown in the first price chart), we can see that $750 can be viewed as a strong level of support that could be used for later buy entries if our Bull Flag pattern fails and prices move lower into the end next month.
Analyst’s Disclosure: I/we have a beneficial long position in the shares of NVDA either through stock ownership, options, or other derivatives. I wrote this article myself, and it expresses my own opinions. I am not receiving compensation for it (other than from Seeking Alpha). I have no business relationship with any company whose stock is mentioned in this article.
Seeking Alpha’s Disclosure: Past performance is no guarantee of future results. No recommendation or advice is being given as to whether any investment is suitable for a particular investor. Any views or opinions expressed above may not reflect those of Seeking Alpha as a whole. Seeking Alpha is not a licensed securities dealer, broker or US investment adviser or investment bank. Our analysts are third party authors that include both professional investors and individual investors who may not be licensed or certified by any institute or regulatory body.
