Summary:
- AMD slightly beat earnings expectations with $0.62 per share, but gaming segment sales declined by 48%.
- The company expects AI chip sales to reach $4 billion in 2024, up from previous guidance of $3.5 billion.
- AMD’s stock price is facing selling pressure and technical indicators suggest a bearish outlook, with potential support zones at $121.20 and $93.12.
JHVEPhoto
Advanced Micro Devices, Inc. (NASDAQ:AMD) slightly surpassed consensus expectations with its earnings release for the first-quarter period, posting per-share earnings figures of $0.62 (against market estimates of $0.61) on revenues of $5.47 billion (against market estimates of $5.46 billion).
AMD also generated $123 million in net income ($0.07 per share), marking a significant turnaround from the -$139 million loss (equal to -$0.09 per share) during the same period last year. Other areas of note can be found in AMD’s data center figures, as the company’s MI300 AI chip helped the segment post substantial annualized growth of 80% during the period.
Additionally, the company now anticipates 2024 AI chip sales figures to reach $4 billion, which also marks a sizable increase from the January guidance (calling for 2024 AI chip sales of $3.5 billion). On the negative side, AMD’s gaming segment posted annualized declines of 48% (at $922 million) due to significant sales weakness in hardware designed for gaming PCs and gaming consoles, such as the PlayStation 5 from Sony (SONY). However, despite this area of weakness, the company continued to show strength in its desktop CPU segment with annualized gains of 85% (at $1.4 billion in sales) for the first-quarter period.
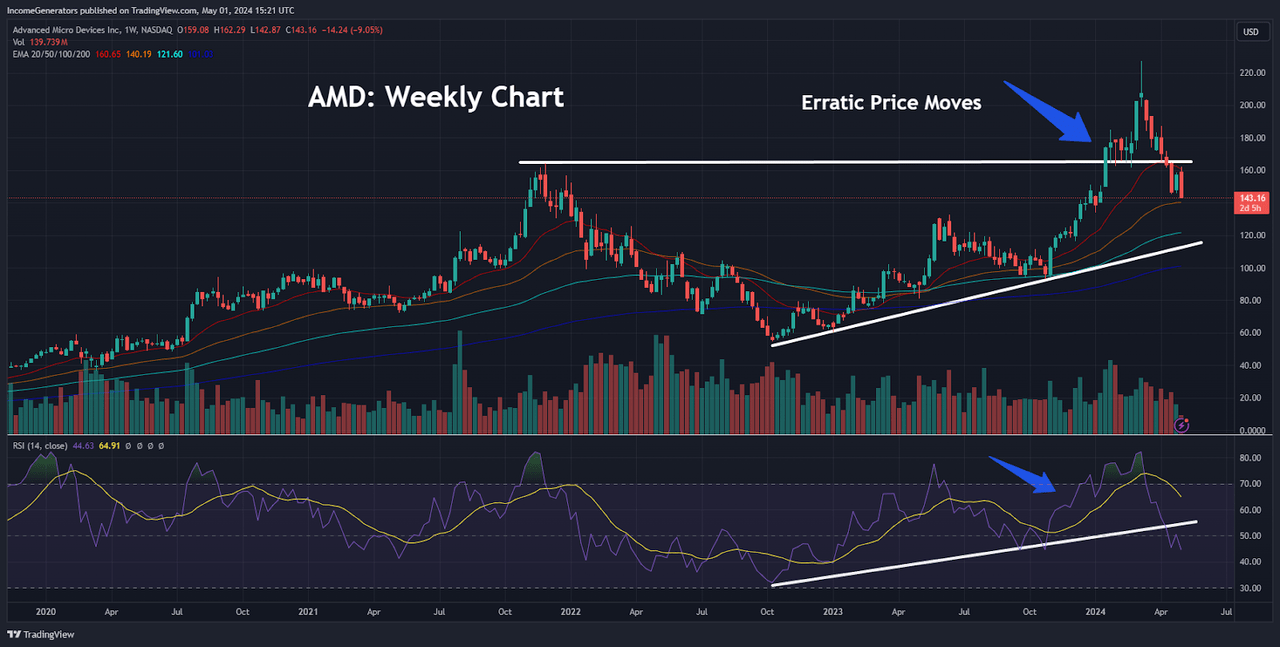
AMD: Erratic Price Moves (Income Generator via TradingView)
Unfortunately, moderately positive surprises do not seem to be receiving favorable responses in the stock market at the moment – and AMD is looking like the most recent example of selling pressure. Perhaps, the best example of this negative trend can be found in the post-earnings response that was seen with Meta Platforms (META) and our prior coverage of these events can be found here.
In AMD’s case, share price activity might be in an even more vulnerable position (when looking at things from a longer-term perspective), given the erratic trend moves that have already taken place on the weekly charts. Specifically, we can see that important resistance levels from November 2021 (at $164.46) were broken to the topside in the bullish impulse price move that occurred in January 2024.
In most instances, this type of price would be considered to be a highly positive event, with an expectation for significant follow-through to the upside. Given the eventual spike high that was recorded in early March 2024 (at $227.30), we can make the argument that this assertion would have been true. However, the stock’s inability to maintain those highs – and the ultimate decline back through this important price zone – calls that initial rally into question, and makes the long-term uptrend appear to be much more vulnerable in its foundations.
Further evidence supporting this bearish outlook can be found in the weekly indicator readings from the Relative Strength Index (RSI), which began recording bullish trends in October 2022. Of course, this positive indicator reading was able to maintain itself (and look quite healthy) until this most recent downturn lower, and the chart above shows the eventual downside break of this technical event.
Ultimately, when we combine all of these factors (spike highs from $227.30 creating a Doji pattern and failing, violation of resistance-turned-support levels at $164.46, broken uptrend in weekly RSI indicator readings), it becomes very difficult to make a credible bullish argument for AMD share prices from the longer-term perspective.
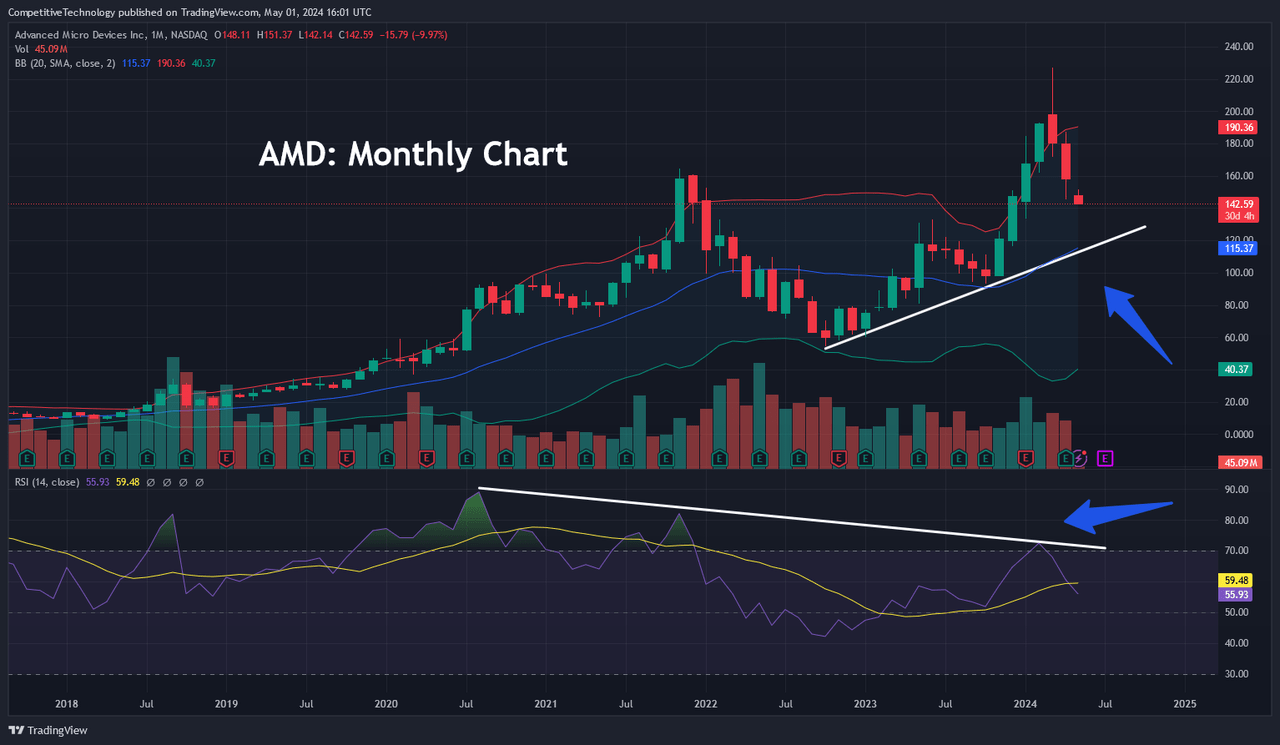
AMD: Monthly Chart (Income Generator via TradingView)
With this outlook in mind, it is important for traders to start looking for potential support zones that might contain downside activity going forward. If we look at the monthly charts, we can see that a minor uptrend began to form in October 2022. If this structure can manage to hold, potential support zones can be found near the $120 handle. Here, it is important to note that monthly indicator readings in the RSI remain bearish and are quite far from falling into oversold territory. On balance, this suggests that the recent downturn in share prices still has more room to extend to the downside.
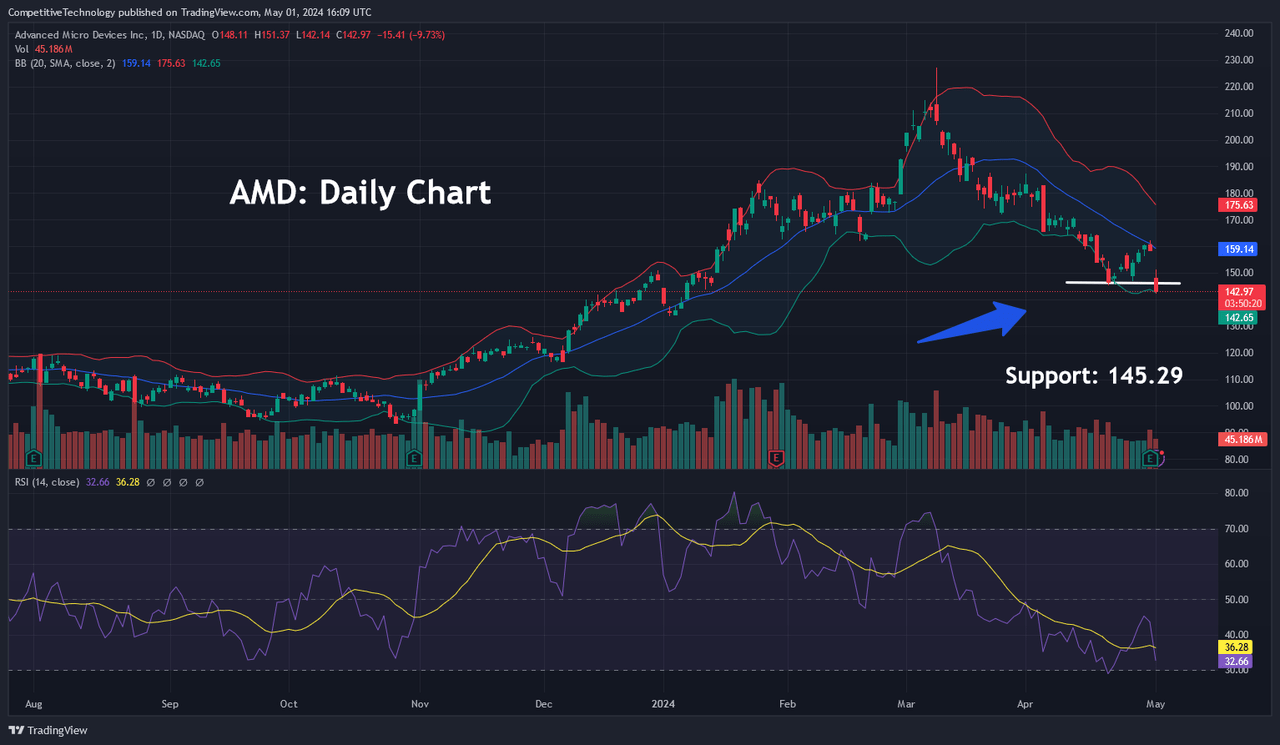
AMD: Daily Chart (Income Generator via TradingView)
On the daily charts, we can see that short-term support levels are breaking in a relatively consistent fashion. Most recently, the stock’s price lows from April 19th, 2024 have now been invalidated, and this bear move has actually sent AMD shares through the lower Bollinger Band.
We can pair this event with the fact that daily RSI readings are approaching oversold territory – and this does suggest that selling pressure could start to abate soon. The only problem with this outlook is the fact that we do not have much available in the way of historical support levels, and this suggests that there will be no clear “line in the sand” for traders to start placing buy orders in anticipation of an upside reversal.
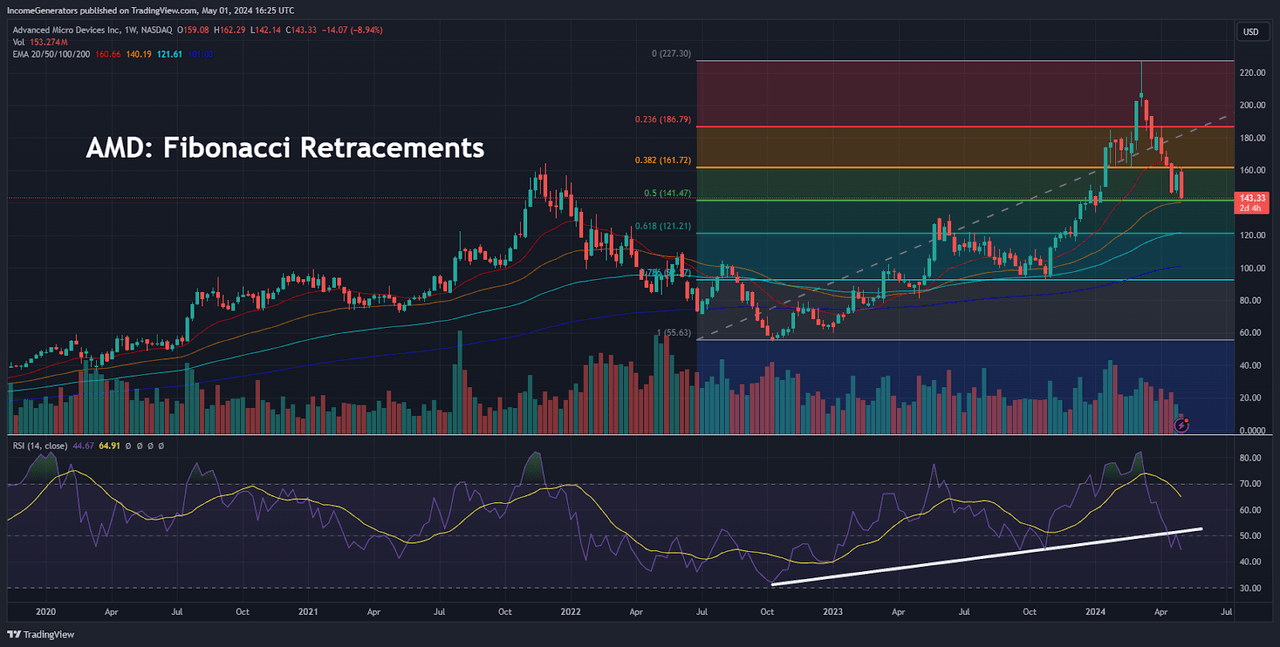
AMD: Fibonacci Retracements (Income Generator via TradingView)
Lack of historical support levels will leave Fibonacci retracement as the primary method of identifying downside support zones, and here we can see that AMD is currently contesting with 50% retracement of the dominant bull wave which extended from October 2022 to March 2024. Interestingly, this level also comes within close proximity to the stock’s 50-week exponential moving average – and this could help contain selling pressure going forward. However, it appears that we are going to be forming a Bearish Engulfing candle this week – and we do have the broken uptrend in the weekly RSI indicator, so it seems unlikely that this will be enough to offer much relief for AMD bulls.
From here, the next Fibonacci support zone can be found with the 61.8% of this aforementioned price move, which is located near $121.20. Surprisingly, this Fibonacci level is another area that falls within close proximity to exponential moving averages (in this case, we are looking at the 100-week exponential moving average). If prices manage to fall to these levels, it will be important for traders to reassess the weekly RSI indicator readings because at that stage it is quite possible that we will have fallen into oversold territory – and this might present new buying opportunities at that time.
Conversely, if prices fall through the 61.8% Fibonacci retracement zone, we will not have another historical support level until we reach the lows from October 2023 (at $93.12), which are located less than $1 away from the 78.6% Fibonacci retracement of the stock’s dominant price move. Overall, the market does not appear to be showing much interest in the slight earnings beats that AMD was able to record during the first-quarter period. Given the recent selling pressure seen in share prices, we believe that it is time for AMD bulls to start taking a more defensive stance and identify support zones to the downside before establishing countertrend positions in anticipation of a bullish reversal.
Analyst’s Disclosure: I/we have no stock, option or similar derivative position in any of the companies mentioned, but may initiate a beneficial Short position through short-selling of the stock, or purchase of put options or similar derivatives in AMD over the next 72 hours. I wrote this article myself, and it expresses my own opinions. I am not receiving compensation for it (other than from Seeking Alpha). I have no business relationship with any company whose stock is mentioned in this article.
Seeking Alpha’s Disclosure: Past performance is no guarantee of future results. No recommendation or advice is being given as to whether any investment is suitable for a particular investor. Any views or opinions expressed above may not reflect those of Seeking Alpha as a whole. Seeking Alpha is not a licensed securities dealer, broker or US investment adviser or investment bank. Our analysts are third party authors that include both professional investors and individual investors who may not be licensed or certified by any institute or regulatory body.
