Summary:
- Target has outperformed the S&P 500 with a 15% surge in stock price YTD.
- While TGT management has outlined their focus on growing revenue and operating margin, there is uncertainty in the success of these plans.
- Possible headwinds in the short term may lead to continued pressure on Target’s top line and thinner margins.
- If improvements in operating margins are realized, the Company would increase their ROIC and their stock valuation.
- Until significant progress is achieved to improve operating margin, my rating on Target is a “Hold”.
Editor’s note: Seeking Alpha is proud to welcome Ling Ya Luo as a new contributing analyst. You can become one too! Share your best investment idea by submitting your article for review to our editors. Get published, earn money, and unlock exclusive SA Premium access. Click here to find out more »
J Studios/DigitalVision via Getty Images
Benefitting from a 10% surge in price since the start of the year, Target Corp. (NYSE:TGT) has outperformed the S&P 500’s 6% rise. A solid improvement in 2023’s operating margin to 5.3% from the dismal 3.6% operating margin seen in 2022, combined with positive guidance on margin improvements, helped the stock surge 15% post-earnings. Given the large jump in price, is the stock still fairly valued?
Investment Thesis
My rating for Target currently stands at a ‘Hold’. Despite the forecasted improvements in operating margin and revenue growth, Target may face significant difficulties in realizing these improvements. Significant investments are required for Target’s growth plans that may impact free cash flow. Hence, operating margins may be thinner than priced in by the market. The success of Target’s plans to grow revenue and streamline operating expenses to achieve operating margin improvements is also not guaranteed.
Investment summary
From Target’s latest earnings call, Target management provided some important guidance regarding the direction of growth. Growth drivers for the next decade were identified as comparable sales, new stores and other sources of revenue – leading to a projection of 4% average revenue growth for the next decade. Projections for operating margin were also set at 6%.
Target also announced a new membership program, Target Circle 360. Priced at $99/year ($49/year if you sign up early), the main selling point of this membership is the unlimited same-day delivery that the membership offers. Like its competitors like Walmart (WMT) and Amazon (AMZN), Target is recognizing consumer expectations of same-day deliveries and a seamless shopping experience.
The growth of Target’s revenue and operating margin depends on the execution of its membership program and how it plays into Target’s current omnichannel model. The membership model could become a new sales driver, with members under Target’s current free membership program shown to spend 5 times more than non-members. There is also considerable synergy between this new revenue stream and Target’s efforts to increase online sales, and I believe that if successful, it can diversify Target’s revenue source and increase online traffic. However, I doubt Target’s ability to successfully adapt to the increase in fulfilment demand for online sales and same day-delivery from this membership program.
Target’s stores are at the heart of its fulfilment model, which the company said acts as an omnichannel hub for its operations. “This new operating model is also how we enable our growing suite of fulfilment services. From drive up to pick up and delivery from Shipt, our stores are serving up a whole range of options to meet guests however they want to shop and as soon as an hour,” Target Chief Operating Officer John Mulligan said.
However, the success of the store fulfilment model is not guaranteed. One just needs to look at Nordstrom as an example. Speaking on Nordstrom’s decision to reduce store fulfilment of online orders, CEO Erik Nordstrom said that “it’s a little more difficult finding the product in a treasure hunt environment in the stores”, alluding to the difficulties in maintaining the inventory required to support store fulfilment.
While Target has made considerable investments in sortation centres to expand its fulfilment capacity and increase capacity, it is still severely dependent on its stores as fulfilment hubs, with stores making up over 95% of fulfilment channels. It remains to be seen if Target can utilize these sortation centres to increase the efficiency of delivery and compete with the likes of Walmart and Amazon, who have already made significant investments into improving their delivery logistics (cite).
A reliance on stores will continue to drag on Target’s financial ratios. These stores have to be significantly bigger than necessary to accommodate inventory expected from online sales. Consequently, Target has spent a significant portion of its recent CapEx remodelling its store to ensure that these stores can fulfil online orders, and it will continue to invest in bigger stores to support fulfilment needs. As a result, Target’s fixed asset to revenue ratio is significantly lower than its competitor Walmart, and this will impact their returns on invested capital, as I will discuss below in the Comparison of ROIC section.
Since the pandemic, consumer tastes and preferences may have shifted as well. While US consumers appear to still be spending, it appears that many of them are prioritising travel over discretionary items, especially with higher mortgage rates and less government rebates. From Wayfair’s most recent earnings call, management said that the bigger-ticket category “remains weak” and it’s uncertain when demand for home furnishings will improve. Consumers have also started seeking out value and better deals, which may favour Target’s competitor Walmart and make it harder for Target to expand operating margin. Combined with the weakening pricing power of companies due to the challenging demand climate and already high prices from inflation, there is considerable difficulty in Target achieving its operating margin goals.
In conclusion, I find the operating margin of 6% hard to justify, at least in the short-run. While efforts by management to improve operating efficiency have led to cost savings in fiscal 2023, I would have to see consistent improvement in margin and a solid execution of their membership program and fulfilment operation to confidently value such an improving in operating margin. With the current macroeconomic conditions and a lack of elaboration on their plan to support the expansion in store fulfillment, I find it unlikely that management can success execute on their plans and improve revenue and operating margin.
The Silver Lining
However, there are some bullish factors for Target’s growth story in the next decade.
Target’s expansion of private label brands bodes well for future revenue growth and operating margins. With the introduction of a new in-house brand, “Dealworthy” that targets budget-conscious consumers, it may be able to attract and compete against patrons of Walmart. Further, these private labels have been generating a significant portion of Target’s revenue and have larger margins than their other products as well, hence such an introduction could help in management’s push for higher revenue growth and larger operating margins.
The use of AI for a customized retail shopping experience could help boost Target’s revenue growth. Using members’ past purchases and preferences, AI could supercharge recommendations based on their tastes and preferences and encourage consumers to purchase products that they are interested in from Target. Target has already proven to have driven $1.5 billion in incremental sales in fiscal 2023 through the use of personalized deals and bonus offers, and AI would serve to augment this even further.
Fundamental Analysis
To avoid distorting effects and focus solely on core operations, Return on Invested Capital will be used as a measure to evaluate performance. The textbook “Valuation: Measuring and Managing the Value of Companies” by McKinsey commonly discusses the use of Return on Invested Capital (ROIC) as a measurement for the value a company is generating.
ROIC is defined as Net Operating Profit After Tax (NOPAT) divided by Invested Capital. NOPAT is the operating profit of a company adjusted for taxes, excluding any financing expenses like interest to control for differences in capital structure between companies. Invested Capital is the value of the assets of the company net of liabilities used to generate NOPAT, commonly consisting of assets like PP&E and working capital.
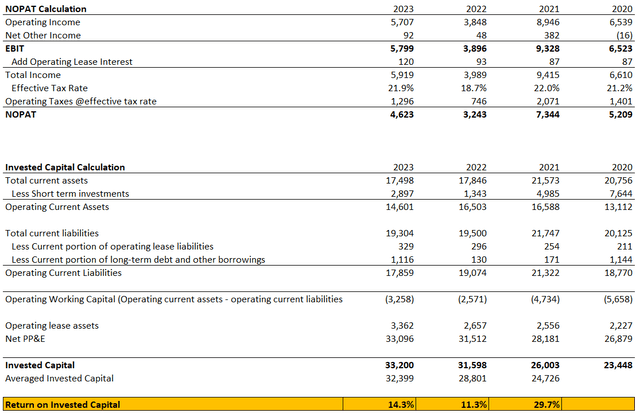
However, the literature on ROIC differs greatly from source to source as it is not a US GAAP accepted measure of profitability; there are many differing definitions of Invested Capital as line items are subject to subjective judgment on whether they contribute to the generation of NOPAT. I have chosen to calculate ROIC based on my understanding of Target’s operations, presented below.
Starting with operating income from the Income Statement, I added other income to get the total income. Applying the same effective tax rate used for reported taxes, I obtain Net Operating Profit After Tax.
For the calculation of Invested Capital, I summed up assets net liabilities involved in the operation of the company. I subtract short-term investments from current operating assets as I treat short-term investments as excess cash equivalents, which are not required for the day-to-day operations of Target. I removed debt and operating lease liabilities from current liabilities, as I treat these items as debt equivalents. Net current liabilities from current assets to get operating working capital. Add net PP&E and operating lease assets to that to get the total Invested Capital.
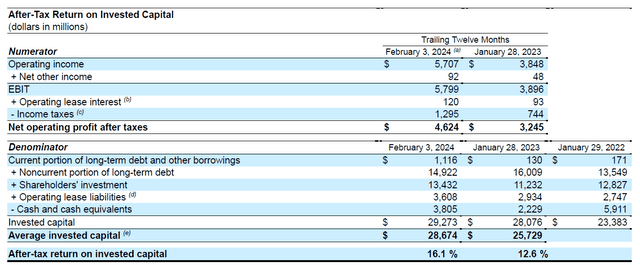
It is worth noting that Target presents their own calculation of ROIC in their annual report.
Though NOPAT is roughly the same, there are differences between the calculated Invested Capital. I have reconciled my figure and the one presented in Target’s 10K as shown below.
The main difference lies in the treatment of cash and miscellaneous items from Target’s Balance Sheet. When calculating Invested Capital, I only subtracted short-term investments from current assets to get current operating assets as I view short-term investments as excess cash that is not needed for operations, while Target chose to subtract all cash and cash equivalents. Secondly, I chose to exclude other noncurrent assets and liabilities from the computation of Invested Capital, with the reasoning that these items do not contribute to the generation of NOPAT, while they are included in Target’s computation.
Comparison of ROIC
I have done a similar computation for one of Target’s biggest competitors, Walmart.
Target’s ROIC compared to Walmart is significantly lower. I theorize that compared to Walmart, Target has a smaller scale, a less innovative business model and less differentiation in terms of products offered. Walmart’s greater scale offers it significant bargaining power with its suppliers and helps it tap into economies of scale to achieve larger revenues for the same amount of invested capital. Furthermore, Walmart utilizes its membership model to attract and retain customers consistently, while expanding into innovative ways to enhance customer experiences with new technology, explaining its dominant lead over Target in terms of ROIC.
ROIC can also be compared to WACC to find the economic profit of the business. This can be thought of as excess returns over the opportunity cost of capital and has proven to be a good indicator of premium valuation by the market.
Looking at Target and Walmart’s current WACC, they are 10.11% and 7.52% respectively (according to GuruFocus). Taking Target and Walmart’s ROIC of 14.3% and 19.4% for the most recent fiscal year, it can be clearly seen that Walmart has a much larger positive spread of ROIC above WACC of 11.88% compared to Target’s 4.19%. This helps explain Walmart’s premium valuation compared to Target, like the higher P/E multiple for Walmart, due to Walmart generating more value.
Delving deeper into ROIC, I decomposed ROIC into line item analysis. ROIC is a function of operating margin and capital turnover, which can be further broken down into line item ratios as seen below.
Breakdown of Target’s ROIC Breakdown of Walmart’s ROIC

As expected, Target earns a larger operating margin on its revenue compared to Walmart. However, this is outweighed by the large disparity between the ratio of revenue to invested capital between Walmart and Target, driven by Walmart’s higher fixed asset to revenue ratio. As alluded to previously, Target invests heavily in its brick-and-mortar stores and renovation to maintain a positive shopping experience for its customers and due to its store fulfilment model, leading to a much higher book value of net PP&E.
From the breakdown of ROIC, it highlights that Target should focus on improving its operating margin to stay competitive in its ROIC, considering that Walmart has a competitive advantage in scale and hence prices. Target’s focus has always been on consumer experience and brand loyalty, which should translate to consistently higher operating margins compared to other competitors.
DCF Valuation
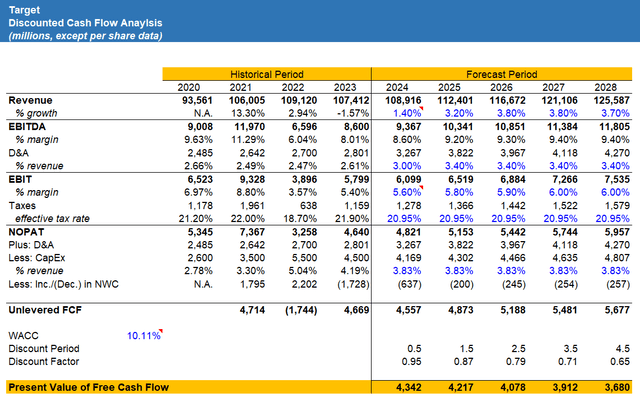
I built a DCF model for Target, incorporating some of these projections for Target’s operating income and revenue.
For revenue, I expect continued pressure on Target’s top line in the short term due to the aforementioned shifting consumer behaviour. Similarly, for operating margin, I expect margin to suffer in the short term and only reach 6% in 2027.
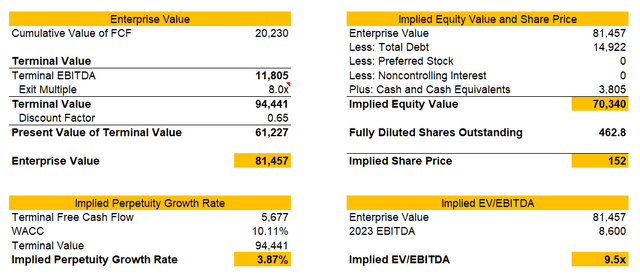
For terminal value, I used an exit multiple of 8.0 EV/EBITDA that gave a reasonable perpetuity growth rate of 3.87%, roughly in line with the 4% long-term US GDP growth rate forecasted by the CBO. This gives us an implied share price of $152, slightly below the current market price of $160.
Doing a sensitivity analysis, we see that a higher exit multiple gives a share price more in line with current market prices, but a perpetuity growth rate that is rather inflated.
Finally, computing the net investment (which is the change in invested capital across a period), reinvestment rate and ROIC for the forecast period, we see that there is a gradual increase in ROIC of Target, due to the assumptions of improved operating margin that we have built into the DCF.
Using the formula of growth rate = reinvestment rate * ROIC, we see that the growth rate is 2.1% for the last forecast year, an indication that the market may be slightly overvaluing Target Corporation.
Conclusion
Target Corporation has made significant operating improvements since the supply chain disruptions seen in 2022. Using ROIC analysis, we can clearly see the comparative advantage of Target lies in its operating margin, and it has plans to further improve its operating margin. However, with the success of their growth model uncertain, I would rate this stock a Hold right now.
Analyst’s Disclosure: I/we have no stock, option or similar derivative position in any of the companies mentioned, and no plans to initiate any such positions within the next 72 hours. I wrote this article myself, and it expresses my own opinions. I am not receiving compensation for it (other than from Seeking Alpha). I have no business relationship with any company whose stock is mentioned in this article.
Seeking Alpha’s Disclosure: Past performance is no guarantee of future results. No recommendation or advice is being given as to whether any investment is suitable for a particular investor. Any views or opinions expressed above may not reflect those of Seeking Alpha as a whole. Seeking Alpha is not a licensed securities dealer, broker or US investment adviser or investment bank. Our analysts are third party authors that include both professional investors and individual investors who may not be licensed or certified by any institute or regulatory body.


